260 NW Golden Hills Dr #2 · Pullman, WA
Flood risk No data
- FEMA flood zone
- —
- Chance of flooding over 30 yrs
- —
- Est. flood insurance / yr
- —
Fire risk No data
- Est. fire insurance / yr
- —
Heat risk No data
- Hot days now (above threshold)
- —
- Hot days in 30 yrs
- —
Wind risk No data
- Chance of severe wind over 30 yrs
- —
Air-quality risk No data
- Unhealthy air days now
- —
- Unhealthy air days in 30 yrs
- —
Risk factors via First Street. Map © Google.
Why this score? — see what drove the B+ grade
The composite is a weighted blend of 9 inputs, each scored 0–100. Each bar is that input's sub-score; the figure is the points it added to the 100-point composite (weight × sub-score).
- Cash flow +30.0/30.0
- ARV discount +13.7/15.0
- 1% rule +10.0/10.0
- DSCR +10.0/10.0
- Schools +5.8/10.0
- Livability +4.2/5.0
- Rent growth +3.4/5.0
- Condition / age +2.5/5.0
- Appreciation +0.0/10.0
$100,000
🖨 Deal sheet 📄 Offer letter ✓ Due diligence
Listing remarks
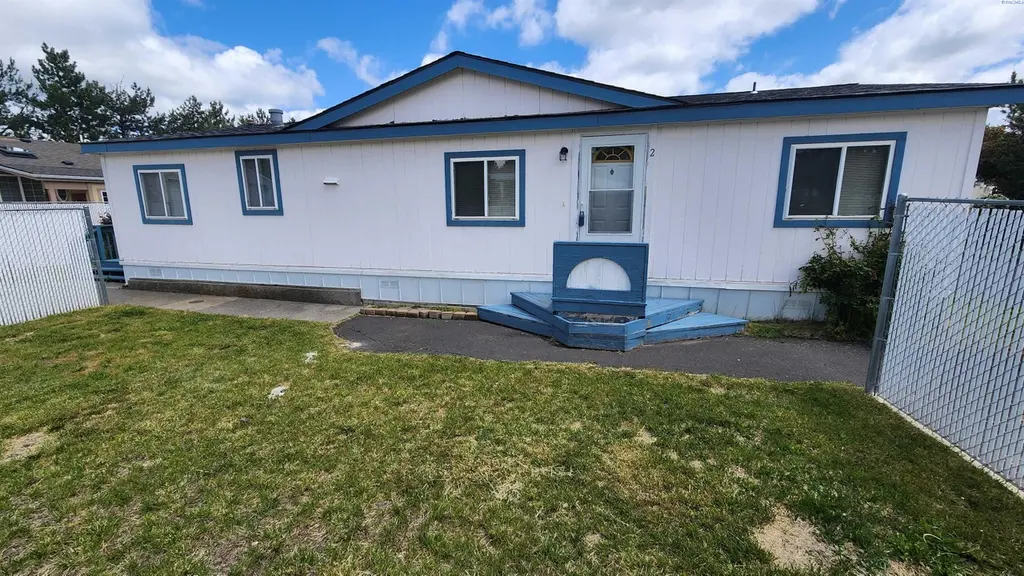
MLS# 293287 This 1995 Fleetwood manufactured home with NEW Roof, NEW interior paint and NEW flooring throughout. Features include 3 bedrooms, 2 full bath, with 1,248 Sqft, HVAC, SS Fridge, dishwasher, pantry, laundry hook-ups, partially fenced yard with storage shed and also NEW skylight in master bath.
Key facts
- Ss fridge
- Hvac
- New flooring
Tags
Property features AI
Finance
- Other: Property is on a rented lot; Zoned for residential manufactured homes
Exterior
- Parking: No garage; Off-street parking
- Utilities: Public water; Electric on property; Sewer connected
- Home design: Manufactured home (double wide); Single-story; New construction; Located in a manufactured home park (Golden Hills MHP)
- Construction: Composition roof; Fleetwood manufactured unit
- Exterior features: Deck; Shed(s); Paved road access; Rented lot
Interior
- Kitchen: Dishwasher; Refrigerator; Range; Oven
- Flooring: Laminate; Vinyl
- Bathrooms: 2 full bathrooms
- Heating & cooling: Central air conditioning; Forced air heating
- Interior features: Pantry; Vaulted ceilings; Double pane windows
Neighborhood map
What this means for you Summary
Snapshot
- This is a 2-bed/2.0-bath manufactured listed at $100k.
Deal economics
- At list price, monthly cash flow is $607 ($7k/yr) — positive.
- The deal already cash-flows at list — no discount required.
- Meets the 1% rule at list price ($2k rent vs $100k).
- Recommended offer: $98k (1.5% below list) — sets the bar for market timing.
- Cap rate 13.6% vs local median 2.2% in Pullman — top-decile yield for the area; either an underpriced asset or a hidden risk that comps aren't pricing in. Stress-test before assuming the spread holds.
Location & tenants
- Location reads 85/100 on livability (#32 in WA, #542 nationally) — a professional / high-income tenant draw. Strengths: crime A+, amenities A+, commute A+; Watch: housing C-, employment F.
- Pullman School District (town): math 63% / reading 76% proficiency, ranked #30 of 291 in WA (top 10%) — acceptable for families but not a draw, mixed tenant base, ~2y average lease.
- Market conditions: Rents rising (+3.4%/yr); 192 active listings in the ZIP; 5 comparable units currently listed for rent nearby; rentals lingering (median 44d on market — plan ~5-8 weeks vacancy on turnover, expect pricing pressure); 100% of comp listings sitting > 30 days — soft ceiling on asking rent; 49 units permitted in Whitman County in 2024 (0 in 5+ unit buildings).
- This rent runs 40% of the median local income ($48k/yr) — at the standard rent-burdened threshold; future hikes will face affordability resistance.
Forward outlook
- Local home prices are declining (-3.0%/yr); year-one equity from $691 of loan paydown is wiped out by about $3k of value loss. Plan a longer hold.
- Whitman County population projected at +57% by 2050 — long-run rental-demand tailwind backs the buy-and-hold thesis.
- At projected returns (-3.0% appreciation + 3.4% rent growth), your $28k cash investment doubles in ~5 years — after that, you're playing with house money.
Negotiation context
- It's been on market 20 days — a 2% lower offer ($98k) is reasonable based on typical stale-listing flexibility.
Questions for the listing agent
- Is there a deadline driving the sale (1031 exchange, divorce, estate, relocation)? That informs how much negotiation room exists.
- Schools are A-rated — typically a magnet for longer-tenancy family renters. What's the average tenant stay here, and is there a school-zone premium baked into asking?
- What's the average days-on-market for RENTAL listings here right now (not sales)? A rising rental-DOM trend means longer vacancies and softer asking-rent achievability than the comps imply.
- What's the recent tenant-quality profile in this submarket — average credit score on applications, eviction rate, late-payment / NSF rate, and stable-employment percentage? A property-management company in the area should have these aggregated.
- How much new for-sale + rental construction is in the pipeline within 1–3 miles? Heavy new supply typically softens prices + rents 12–24 months out; constrained supply supports both.
Investment metrics
- 1% rule
- 1.59% ✓
- Cap rate
- 13.58%
- Cash-on-cash
- 26.03%
- DSCR
- 2.16
- GRM
- 5.2
CMA / ARV
- ARV (on-the-fly)
- $116,064
- Comps found
- 12
Show comp detail 12 sales within ~0.75 mi
| Address | Dist | Beds/Ba | Sqft | Sold | Price | $/sf | Match |
|---|---|---|---|---|---|---|---|
| 260 NW Golden Hills #65 Dr #65 | 0.00mi | 3/2.0 (+1) | 1,260 (+1%) | 8mo | $97,000 | $77 | 86 |
| 260 NW Golden Hills Dr #52 Dr #52 | 0.00mi | 3/2.0 (+1) | 1,248 (0%) | 16mo | $39,000 | $31 | 82 |
| 260 Golden Hills Dr #63 | 0.00mi | 2/2.0 | 1,134 (-9%) | 9mo | $105,000 | $93 | 77 |
| 206 NW Lancer Ln | 0.20mi | 3/2.0 (+1) | 1,248 (0%) | 15mo | $144,000 | $115 | 74 |
| 255 NW Golden Hills Dr #56 | 0.17mi | 2/2.0 | 1,176 (-6%) | 15mo | $80,000 | $68 | 70 |
| 260 NW Golden Hills Dr. #10 Dr #10 | 0.00mi | 3/2.0 (+1) | 1,066 (-15%) | 2mo | $125,000 | $117 | 69 |
| 115 NW Glenhaven Dr | 0.31mi | 3/2.0 (+1) | 1,232 (-1%) | 11mo | $155,000 | $126 | 69 |
| 116 NW Glenhaven Dr | 0.26mi | 2/2.0 | 1,120 (-10%) | 3mo | $100,000 | $89 | 68 |
| 260 NW Golden Hills Dr. #39 Dr #39 | 0.00mi | 3/2.0 (+1) | 1,080 (-14%) | 12mo | $52,000 | $48 | 63 |
| 101 NW Glenhaven Dr | 0.23mi | 3/2.0 (+1) | 1,344 (+8%) | 16mo | $165,000 | $123 | 59 |
| 114 NW Glenhaven Dr | 0.25mi | 3/2.0 (+1) | 1,072 (-14%) | 15mo | $137,000 | $128 | 47 |
| 410 NW Park West Dr | 0.58mi | 3/2.0 (+1) | 1,344 (+8%) | 12mo | $79,900 | $59 | 45 |
Match score weights: distance 35% · size 25% · config 20% · recency 20%. Top-matched comps best support the ARV.
Projected returns pro-forma
-3.0% appreciation · 3.43% rent growth · sell at horizon
- IRR
- 20.2%
- Equity multiple
- 1.83×
- Total profit
- $23,166
- Equity at exit
- $14,910
- IRR
- 28.7%
- Equity multiple
- 3.60×
- Total profit
- $72,842
- Equity at exit
- $8,646
Cash invested: $28,000 (down + closing). Projections, not guarantees.
Landlord ↔ Tenant lean methodology
- Overall (STATE)
- 28 Tenant-Leaning
- State Washington
- 28 Tenant-Leaning · D+8
- County
- — inherits STATE
- City
- — inherits STATE
ZIP-level market 99163
- Rents YoY
- 3.4%
- Active inventory
- 192
- Price-to-rent
- 5.2×
Monthly cashflow live
- Estimated rent
- $1,593 medium interval (Pro) →
- Mortgage (P&I)
- −$524
- Tax from tax record
- −$85 /mo · $1,023/yr
- Insurance
- −$42
- HOA
- −$0
- Vacancy / Maint / Mgmt
- −$335
- Net cashflow
- $607
Break-even live
UW: 25.0% down · 7.5% · 30yr · 1.5% tax · 5.0% vac · 8.0% maint · 8.0% mgmt
Financing live
Cash to close
- Down payment
- $25,000
- Closing costs
- $3,000
- Reserves months
- —
- Total cash needed
- —
Loan-product check · same deal, 3 products live
Conventional
25% down · 7.5% · 30yr
- Down + closing
- —
- Monthly P&I
- —
- Monthly cashflow
- —
- DSCR
- —
- Eligible?
- —
Personal DTI + credit; lowest rate.
DSCR
20% down · 8.5% · 30yr
- Down + closing
- —
- Monthly P&I
- —
- Monthly cashflow
- —
- DSCR
- —
- Eligible?
- —
No personal income docs; deal must DSCR.
Hard money
10% down · 12.0% · 12mo
- Down + closing
- —
- Monthly P&I
- —
- Monthly cashflow
- —
- DSCR
- —
- Eligible?
- —
Short-term bridge; refi at stabilization.
Rent comps 5 comps
| Address | Beds | Baths | Sqft | Rent | $/sqft | DOM | Units | Dist |
|---|---|---|---|---|---|---|---|---|
| 640 SW Golden Hills Dr Pullman, WA | 1.0–3.0 | 1.0–2.0 | 1002 | $1,884 | $1.88 | 43d | 1 | 0.56mi |
| 1115 SW Lost Trail Dr Pullman, WA | 3.0 | 2.5 | 1472 | $2,100 | $1.43 | 43d | 1 | 0.65mi |
| 605 S Grand Ave Apt M Pullman, WA | 2.0 | 2.0 | 1000 | $1,350 | $1.35 | 43d | 1 | 1.21mi |
| 605 S Grand Ave Apt B Pullman, WA | 1.0 | 1.0 | 790 | $1,000 | $1.27 | 43d | 1 | 1.21mi |
| 455 E Main St Pullman, WA | 2.0–5.0 | 2.0–5.0 | 975 | $539 | $0.55 | 43d | 1 | 1.49mi |
Listing history 15 events
-
2026-06-19statusdays on market $100,000 Active 20 DOM
-
2026-06-16status $100,000 Pending 19 DOM
-
2026-06-15days on market $100,000 Active 19 DOM
-
2026-06-14days on market $100,000 Active 17 DOM
-
2026-06-12days on market $100,000 Active 16 DOM
-
2026-06-09days on market $100,000 Active 13 DOM
-
2026-06-08days on market $100,000 Active 12 DOM
-
2026-06-07days on market $100,000 Active 11 DOM
-
2026-06-05days on market $100,000 Active 8 DOM
-
2026-06-02days on market $100,000 Active 6 DOM
-
2026-06-01days on market $100,000 Active 5 DOM
-
2026-05-31days on market $100,000 Active 4 DOM
-
2026-05-30days on market $100,000 Active 3 DOM
-
2026-05-27$100,000 Active
-
2025-09-19price $99,000
ⓘ Source: listings_history table (triggers on properties + properties_extension) + one-shot
backfill from property_details.listing_events for pre-trigger history.
Tax reassessment forecast WA · Resets to sale price
- Current annual tax
- $1,023 · $85/mo
- Projected year-2 tax
- $1,023 · $85/mo
- Expected delta
- $0/yr ($0/mo · -0.0%)
ⓘ Screening estimate from a state-policy table — verify with the county assessor before closing.
Nearby sold comps map
Loading sold comps map…
Walkable amenities ~0.75 mi
Loading nearby amenities…
Taxation est. · year 1
- Rental income
- $19,119
- − Mortgage interest
- −$5,602
- − Property taxes
- −$1,023
- − Insurance
- −$500
- − Repairs & maintenance
- −$1,530
- − Management
- −$1,530
- − Depreciation
- −$2,909
- Taxable income
- $6,026
- Est. tax owed @ 24.0%
- −$1,446
- After-tax cash flow
- $5,841/yr
For passive investors: Depreciation is non-cash, so a rental often shows a tax loss while cash-flowing — sheltering income. Rental losses are passive: they offset passive income freely, and up to $25,000/yr can offset ordinary (W-2) income if you actively participate and your MAGI is under $100k (phasing out to $0 by $150k); unused losses carry forward. On sale, claimed depreciation is recaptured at up to 25%, and gains may owe capital-gains tax (a 1031 exchange can defer both). Figures are a year-1 estimate at your 24.0% rate — not tax advice; consult a CPA.
Schools (NCES district)
- District
- Pullman School District
- NCES district ID
- 5306930
- Math proficiency
- 63% ▼ -1.00%
- Reading proficiency
- 76% ▲ 1.00%
- Median HH income
- $29,034
- Composite
- 58.15/100
- National rank
- #2131
- State rank
- #30 of 291 in WA
Livability — Pullman
- Score
- 85/100
- State rank
- #32
- US rank
- #542
Category grades
Schools grade is shown separately in the Schools card above.
Census & demographics
- Census place
- Pullman, WA
- County
- Whitman County · 34,022 people
- City population
- 34,022
- Metro
- Pullman, WA
- Population (ZIP)
- 34,022
- Household income
- $48,231
- Rent vs Own
- Severe rent burden
- 3453.0
Population outlook (Whitman County) Hauer SSP2
- Today (2025)
- 57,639 people
- By 2030
- 63,440 · +10.1%
- By 2040
- 75,870 · +31.6%
- By 2050
- 90,294 · +56.7%
- By 2075
- 131,756 · +128.6%
- By 2100
- 169,239 · +193.6%
Race, ethnicity, and origin ACS 2023
- Neighborhood character
- Predominantly White (69%)
- Race & ethnicity
- White 69% Two or more races 12% Asian 10% Hispanic / Latino 9% Black 2%
- Hispanic origin (detail)
- Mexican 6%
- Common ancestry
- Italian 5% Portuguese 5% Slovak 3%
- Foreign-born
- 10% · China, Canada, Vietnam
- Languages at home
- 86% English-only · Spanish 4% Chinese 4% Other Indo-European 2%
Political lean MEDSL · Whitman
- 2024 margin
- Lean D (+9.0) · D 52.8% · R 43.8% · Other 3.4%
- 2008→2024 swing
- +3.5pp toward D · 2008: 5.5pp · 2024: 9.0pp
- All cycles
- 2024: D+9.0 2020: D+10.0 2016: D+0.5 2012: R+3.7 2008: D+5.5
Not yet ingested
- Civics
- —
Market trends
- HPI YoY
- ▼ -367.44%
- Current HPI
- 153.4778
- Rent YoY
- ▲ 3.43%
- Metro
- Pullman, WA
- State GDP YoY
- ▲ 4.65%
- F500 in state
- 22
Industry mix (Fortune 500 HQ in WA)
| Industry | F500 HQs | Revenue |
|---|---|---|
| Retail | 2 | $269B |
|
||
| Technology / Retail | 1 | $638B |
|
||
| Technology | 1 | $245B |
|
||
| Telecommunications | 1 | $38B |
|
||
| Food / Beverage | 1 | $36B |
|
||
| Automotive / Trucks | 1 | $34B |
|
||
Price history
+1.0% since first listed2 events — show timeline
- 2026-05-27 Listed $100,000 PACMLS
- 2025-09-19 Price Changed $99,000 PACMLS
Property tax history
+3.9%/yrLatest (2026): $1,023 · -14.2% YoY. Source: county tax records.
Cash-flow waterfall
monthlySold comps — $/sqft
last 12 mo · ≤1 miLoading sold comps…