 Multi-family
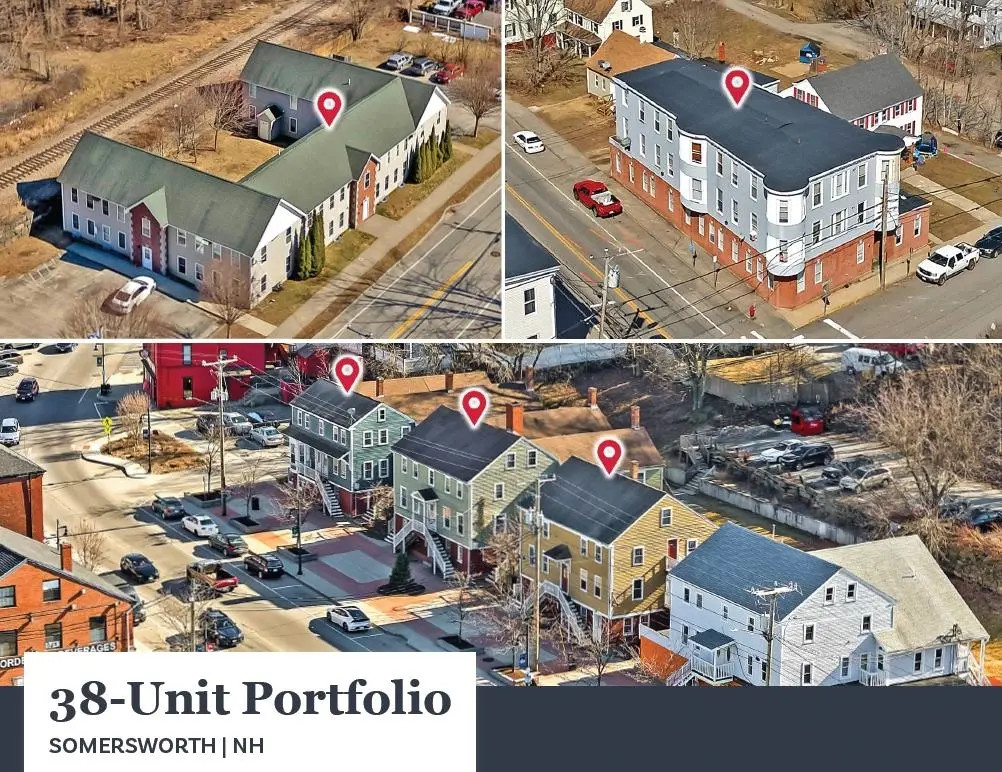
38 Somersworth Portfolio Unit Somersworth · Somersworth, NH
Flood risk 1/10 · Minimal
- FEMA flood zone
- X (unshaded)
- Chance of flooding over 30 yrs
- 0.0%
- Est. flood insurance / yr
- $507 – $1,088
Fire risk 1/10 · Minimal
- Est. fire insurance / yr
- $507 – $941
Heat risk 4/10 · Minor
- Hot days now (above 97°F)
- 7 days/yr
- Hot days in 30 yrs
- 15 days/yr
Wind risk 4/10 · Minor
- Chance of severe wind over 30 yrs
- 20.0%
Air-quality risk 2/10 · Minimal
- Unhealthy air days now
- 1 days/yr
- Unhealthy air days in 30 yrs
- 1 days/yr
Risk factors via First Street. Map © Google.
Why this score? — see what drove the C grade
The composite is a weighted blend of 9 inputs, each scored 0–100. Each bar is that input's sub-score; the figure is the points it added to the 100-point composite (weight × sub-score).
- Cash flow +24.7/30.0
- DSCR +8.0/10.0
- ARV discount +7.5/15.0
- 1% rule +6.4/10.0
- Livability +4.0/5.0
- Rent growth +2.5/5.0
- Condition / age +2.2/5.0
- Schools +2.1/10.0
- Appreciation +0.0/10.0
$6,600,000
🖨 Deal sheet 📄 Offer letter ✓ Due diligence
Multi-family units
County records classify this as Multi-Family (5+ Unit). Listing-text estimate: 1 unit. estimate disagrees with records
5+ unit building — per-unit beds/baths from public records are typically unavailable; the breakdown below (if shown) is an estimate from the listing text.
Listing remarks
The Portfolio at 17-31 Market Street, 62 Green Street, and 260 Main Street contains thirty-eight (38) units consisting of three (3) 3-Bedroom/1-Bathroom units, twenty-eight (28) 2-Bedroom/1-Bathroom units, and seven (7) 1-Bedroom/1-Bathroom units with 35,785 square feet of gross living area in 49,680 square feet of gross area. The Property is on a combined 1.32 acres of land and features over thirty-eight (38) parking spaces between the Properties. 260 Main Street is a two-story building containing twelve (12), 2-Bedroom/1-Bathroom residential units with 9,936 square feet of living area in 15,062 square feet of total gross area on a 0.53-acre parcel. The Property is separately metered for e
Key facts
- 1.32 acre lot
- Built 1824
- Listed 9 days
Property features AI
Finance
- Other: Operating expenses include heat, insurance, maintenance, snow removal, trash, utilities, and water/sewer
- Financial info: Reported net income: $502,225
Exterior
- Parking: Paved driveway
- Utilities: Public water; Public sewer; Electric service: Other; Internet: Unknown; Utilities vary by unit
- Home design: Multi-unit property (38 units); Existing construction
- Construction: Built in 1824; Exterior materials include aluminum, brick, clapboard, and vinyl; Asphalt shingle roof and other roof types
- Exterior features: Paved driveway; Public road frontage (paved); Road frontage length approximately 50 feet; Lot details: Other
Interior
- Bedrooms: 38 units total: 7 one-bedroom units, 28 two-bedroom units, 3 three-or-more-bedroom units
- Heating & cooling: Natural gas heating; Cooling: Other
- Interior features: Basement with interior access
Neighborhood map
What this means for you Summary
Snapshot
- This is a multifamily listed at $6.60M. Condition is rated fair.
Deal economics
- At list price, monthly cash flow is $14k ($165k/yr) — positive.
- The deal already cash-flows at list — no discount required.
- Meets the 1% rule at list price ($75k rent vs $6.60M).
- Cap rate 8.8% vs local median 3.5% in Somersworth — top-decile yield for the area; either an underpriced asset or a hidden risk that comps aren't pricing in. Stress-test before assuming the spread holds.
Location & tenants
- Location reads 80/100 on livability (#17 in NH, #1,853 nationally) — a professional / high-income tenant draw. Strengths: commute A+, housing A+, health & safety A+; Watch: amenities F.
- Somersworth School District (suburban): math 16% / reading 30% proficiency, ranked #93 of 98 in NH (top 95%) — low school quality limits family demand, transient renter base, plan for 1-2y turnover.
- Market conditions: 46 active listings in the ZIP; solid renter incomes; 951 units permitted in Strafford County in 2024 (551 in 5+ unit buildings).
- At $75,111/mo this rent would consume 1200% of the median local household income ($75k/yr) (locally 560% of renters already pay >50% of income on rent) — very limited rent-growth headroom before tenants either downsize or default.
Forward outlook
- Local home prices are declining (-3.0%/yr); year-one equity from $46k of loan paydown is wiped out by about $198k of value loss. Plan a longer hold.
- Strafford County population projected at +7% by 2050 — modest demand growth; plan on rents tracking national, not racing it.
Negotiation context
- Only 9 days on market — expect competitive offers; lowballing is unlikely to land.
Risks & watch-outs
- Watch-outs: built in 1824 — expect roof / HVAC / electrical / plumbing capex.
Questions for the listing agent
- Have any recent inspections been done? Can we get a copy of the seller's disclosures and any deferred-maintenance estimates?
- Built in 1824 — when were the roof, HVAC, electrical panel, plumbing, and water heater last replaced?
- Is there a deadline driving the sale (1031 exchange, divorce, estate, relocation)? That informs how much negotiation room exists.
- What's the average days-on-market for RENTAL listings here right now (not sales)? A rising rental-DOM trend means longer vacancies and softer asking-rent achievability than the comps imply.
- What's the recent tenant-quality profile in this submarket — average credit score on applications, eviction rate, late-payment / NSF rate, and stable-employment percentage? A property-management company in the area should have these aggregated.
- How much new apartment / multifamily construction is in the pipeline within 1–3 miles? Heavy new supply (>2% of stock underway) typically softens rents 12–24 months out; light construction supports rent growth.
Investment metrics
- 1% rule
- 1.14% ✓
- Cap rate
- 8.79%
- Cash-on-cash
- 8.91%
- DSCR
- 1.40
- GRM
- 7.3
CMA / ARV
No comps found within radius.
Projected returns pro-forma
-3.0% appreciation · 3.0% rent growth · sell at horizon
- IRR
- -2.8%
- Equity multiple
- 0.89×
- Total profit
- $-194,097
- Equity at exit
- $984,081
- IRR
- 6.9%
- Equity multiple
- 1.52×
- Total profit
- $961,328
- Equity at exit
- $570,647
Cash invested: $1,848,000 (down + closing). Projections, not guarantees.
Landlord ↔ Tenant lean methodology
- Overall (STATE)
- 56 Moderately Landlord-Leaning
- State New Hampshire
- 56 Moderately Landlord-Leaning · D+1
- County
- — inherits STATE
- City
- — inherits STATE
ZIP-level market 03878
- Home prices YoY
- -26.1%
- Active inventory
- 46
- Price-to-rent
- 252.1×
Monthly cashflow live
- Estimated rent
- $75,111 high interval (Pro) →
- Mortgage (P&I)
- −$34,611
- Tax est. 1.5%
- −$8,250 /mo · $99,000/yr
- Insurance
- −$2,750
- HOA
- −$0
- Vacancy / Maint / Mgmt
- −$15,773
- Net cashflow
- $13,727
Break-even live
38-unit breakdown (identical units grouped — click to expand)
| Units | Beds | Baths | Est. rent |
|---|---|---|---|
| 3× units | 3 | 1 | $6,546 |
| #1 | 3 | 1 | $2,182 |
| #2 | 3 | 1 | $2,182 |
| #3 | 3 | 1 | $2,182 |
| 28× units | 2 | 1 | $55,636 |
| #4 | 2 | 1 | $1,987 |
| #5 | 2 | 1 | $1,987 |
| #6 | 2 | 1 | $1,987 |
| #7 | 2 | 1 | $1,987 |
| #8 | 2 | 1 | $1,987 |
| #9 | 2 | 1 | $1,987 |
| #10 | 2 | 1 | $1,987 |
| #11 | 2 | 1 | $1,987 |
| #12 | 2 | 1 | $1,987 |
| #13 | 2 | 1 | $1,987 |
| #14 | 2 | 1 | $1,987 |
| #15 | 2 | 1 | $1,987 |
| #16 | 2 | 1 | $1,987 |
| #17 | 2 | 1 | $1,987 |
| #18 | 2 | 1 | $1,987 |
| #19 | 2 | 1 | $1,987 |
| #20 | 2 | 1 | $1,987 |
| #21 | 2 | 1 | $1,987 |
| #22 | 2 | 1 | $1,987 |
| #23 | 2 | 1 | $1,987 |
| #24 | 2 | 1 | $1,987 |
| #25 | 2 | 1 | $1,987 |
| #26 | 2 | 1 | $1,987 |
| #27 | 2 | 1 | $1,987 |
| #28 | 2 | 1 | $1,987 |
| #29 | 2 | 1 | $1,987 |
| #30 | 2 | 1 | $1,987 |
| #31 | 2 | 1 | $1,987 |
| 7× units | 1 | 1 | $12,929 |
| #32 | 1 | 1 | $1,847 |
| #33 | 1 | 1 | $1,847 |
| #34 | 1 | 1 | $1,847 |
| #35 | 1 | 1 | $1,847 |
| #36 | 1 | 1 | $1,847 |
| #37 | 1 | 1 | $1,847 |
| #38 | 1 | 1 | $1,847 |
| Total (38 units) | $75,111 | ||
UW: 25.0% down · 7.5% · 30yr · 1.5% tax · 5.0% vac · 8.0% maint · 8.0% mgmt
Financing live
Cash to close
- Down payment
- $1,650,000
- Closing costs
- $198,000
- Reserves months
- —
- Total cash needed
- —
Loan-product check · same deal, 3 products live
Conventional
25% down · 7.5% · 30yr
- Down + closing
- —
- Monthly P&I
- —
- Monthly cashflow
- —
- DSCR
- —
- Eligible?
- —
Personal DTI + credit; lowest rate.
DSCR
20% down · 8.5% · 30yr
- Down + closing
- —
- Monthly P&I
- —
- Monthly cashflow
- —
- DSCR
- —
- Eligible?
- —
No personal income docs; deal must DSCR.
Hard money
10% down · 12.0% · 12mo
- Down + closing
- —
- Monthly P&I
- —
- Monthly cashflow
- —
- DSCR
- —
- Eligible?
- —
Short-term bridge; refi at stabilization.
Listing history 8 events
-
2026-06-18days on market $6,600,000 Active 9 DOM
-
2026-06-17days on market $6,600,000 Active 8 DOM
-
2026-06-16days on market $6,600,000 Active 7 DOM
-
2026-06-15days on market $6,600,000 Active 6 DOM
-
2026-06-13days on market $6,600,000 Active 4 DOM
-
2026-06-13days on market $6,600,000 Active 3 DOM
-
2026-06-10remarks 699-char remark
-
2026-06-10$6,600,000 Active 1 DOM
ⓘ Source: listings_history table (triggers on properties + properties_extension) + one-shot
backfill from property_details.listing_events for pre-trigger history.
Climate risk First Street
- Flood 1/10 Low FEMA zone X (unshaded) · 0% chance over 30 yrs
- Wildfire 1/10 Low
- Heat 4/10 Moderate 7 d/yr ≥97°F today · 15 d/yr by 30 yrs out
- Wind 4/10 Moderate 20% chance of damaging wind over 30 yrs
- Air quality 2/10 Low 1 unhealthy d/yr today · 1 by 30 yrs out
Nearby sold comps map
Loading sold comps map…
Walkable amenities ~0.75 mi
Loading nearby amenities…
Taxation est. · year 1
- Rental income
- $901,332
- − Mortgage interest
- −$369,703
- − Property taxes
- −$99,000
- − Insurance
- −$33,000
- − Repairs & maintenance
- −$72,107
- − Management
- −$72,107
- − Depreciation
- −$192,000
- Taxable income
- $63,416
- Est. tax owed @ 24.0%
- −$15,220
- After-tax cash flow
- $149,499/yr
For passive investors: Depreciation is non-cash, so a rental often shows a tax loss while cash-flowing — sheltering income. Rental losses are passive: they offset passive income freely, and up to $25,000/yr can offset ordinary (W-2) income if you actively participate and your MAGI is under $100k (phasing out to $0 by $150k); unused losses carry forward. On sale, claimed depreciation is recaptured at up to 25%, and gains may owe capital-gains tax (a 1031 exchange can defer both). Figures are a year-1 estimate at your 24.0% rate — not tax advice; consult a CPA.
Condition & rehab AI · 12 photos
This multi-family property requires moderate renovations to improve its condition and increase its resale and rental value. Key areas for improvement include exterior painting, interior updates, and HVAC maintenance.
Repairs flagged
- Minor Kitchen cabinets — Cabinets show signs of wear.
- Minor Bathroom fixtures — Fixtures appear outdated.
- Moderate Exterior siding — Siding shows signs of wear and needs repainting.
- Moderate Carpeted flooring — Floors need replacement or refinishing.
- Moderate Paint — Paint needs touch-up or repainting.
- Moderate HVAC system — System may need maintenance or replacement.
- Moderate Landscaping — Landscaping needs updating and maintenance.
Value-add opportunities
- Both Paint exterior and interior — Fresh paint enhances curb appeal and interior aesthetics.
- Both Replace worn-out fixtures and appliances — Modernizing the kitchen and bathrooms improves functionality and appeal.
- Both Landscaping and curb appeal — A well-maintained exterior boosts curb appeal and property value.
- Both HVAC system maintenance or replacement — A reliable HVAC system ensures comfort and energy efficiency, attracting tenants and buyers.
- Both Flooring replacement — New flooring in common areas and bathrooms enhances the overall look and feel of the property.
Renovation cost estimate screening
| Repair item | Severity | Est. cost |
|---|---|---|
| Kitchen cabinets · Cabinets show signs of wear. | Minor | $500–3,000 |
| Bathroom fixtures · Fixtures appear outdated. | Minor | $500–3,000 |
| Exterior siding · Siding shows signs of wear and needs repainting. | Moderate | $3,000–15,000 |
| Carpeted flooring · Floors need replacement or refinishing. | Moderate | $3,000–15,000 |
| Paint · Paint needs touch-up or repainting. | Moderate | $3,000–15,000 |
| HVAC system · System may need maintenance or replacement. | Moderate | $3,000–15,000 |
| Landscaping · Landscaping needs updating and maintenance. | Moderate | $3,000–15,000 |
| Total estimated repair cost · 7 items | $16,000–81,000 |
Value-add ROI direction
- Both Paint exterior and interior — Fresh paint enhances curb appeal and interior aesthetics. ↑
- Both Replace worn-out fixtures and appliances — Modernizing the kitchen and bathrooms improves functionality and appeal. ↑
- Both Landscaping and curb appeal — A well-maintained exterior boosts curb appeal and property value. ↑
- Both HVAC system maintenance or replacement — A reliable HVAC system ensures comfort and energy efficiency, attracting tenants and buyers. ↑
- Both Flooring replacement — New flooring in common areas and bathrooms enhances the overall look and feel of the property. ↑
ⓘ Cost ranges are severity-bucket heuristics (US national rule-of-thumb). Get contractor quotes + a written scope before underwriting a rehab budget.
Schools (NCES district)
- District
- Somersworth School District
- NCES district ID
- 3306240
- Math proficiency
- 16% ▼ -21.00%
- Reading proficiency
- 30% ▼ -12.00%
- Median HH income
- $55,501
- Composite
- 20.87/100
- National rank
- #8496
- State rank
- #93 of 98 in NH
Livability — Somersworth
- Score
- 80/100
- State rank
- #17
- US rank
- #1853
Category grades
Schools grade is shown separately in the Schools card above.
Census & demographics
- Census place
- Somersworth, NH
- County
- Strafford County · 75,181 people
- City population
- 12,205
- Metro
- Boston-Cambridge-Newton, MA-NH
- Population (ZIP)
- 12,205
- Household income
- $75,136
- Rent vs Own
- Severe rent burden
- 560.0
Population outlook (Strafford County) Hauer SSP2
- Today (2025)
- 132,503 people
- By 2030
- 135,377 · +2.2%
- By 2040
- 139,609 · +5.4%
- By 2050
- 141,803 · +7.0%
- By 2075
- 149,280 · +12.7%
- By 2100
- 148,667 · +12.2%
Race, ethnicity, and origin ACS 2023
- Neighborhood character
- Predominantly White (83%)
- Race & ethnicity
- White 83% Two or more races 9% Hispanic / Latino 6% Asian 3% Black 3%
- Hispanic origin (detail)
- Mexican 2% Puerto Rican 1%
- Common ancestry
- Lithuanian 13% Romanian 3% Slovak 3%
- Foreign-born
- 6% · Canada, Jamaica, China
- Languages at home
- 94% English-only · Other Asian/Pacific 2% Spanish 2%
Political lean MEDSL · Strafford
- 2024 margin
- D (+12.1) · D 55.5% · R 43.5% · Other 1.0%
- 2008→2024 swing
- -8.3pp toward R · 2008: 20.4pp · 2024: 12.1pp
- All cycles
- 2024: D+12.1 2020: D+15.2 2016: D+8.6 2012: D+14.5 2008: D+20.4
Not yet ingested
- Civics
- —
Market trends
- HPI YoY
- ▼ -119.70%
- Current HPI
- 338.5583
- Rent YoY
- —
- Metro
- Boston-Cambridge-Newton, MA-NH
- State GDP YoY
- —
- F500 in state
- 0
Price history
1 event — show timeline
- 2026-06-09 Listed $6,600,000 PrimeMLS
Cash-flow waterfall
monthlySold comps — $/sqft
last 12 mo · ≤1 miLoading sold comps…