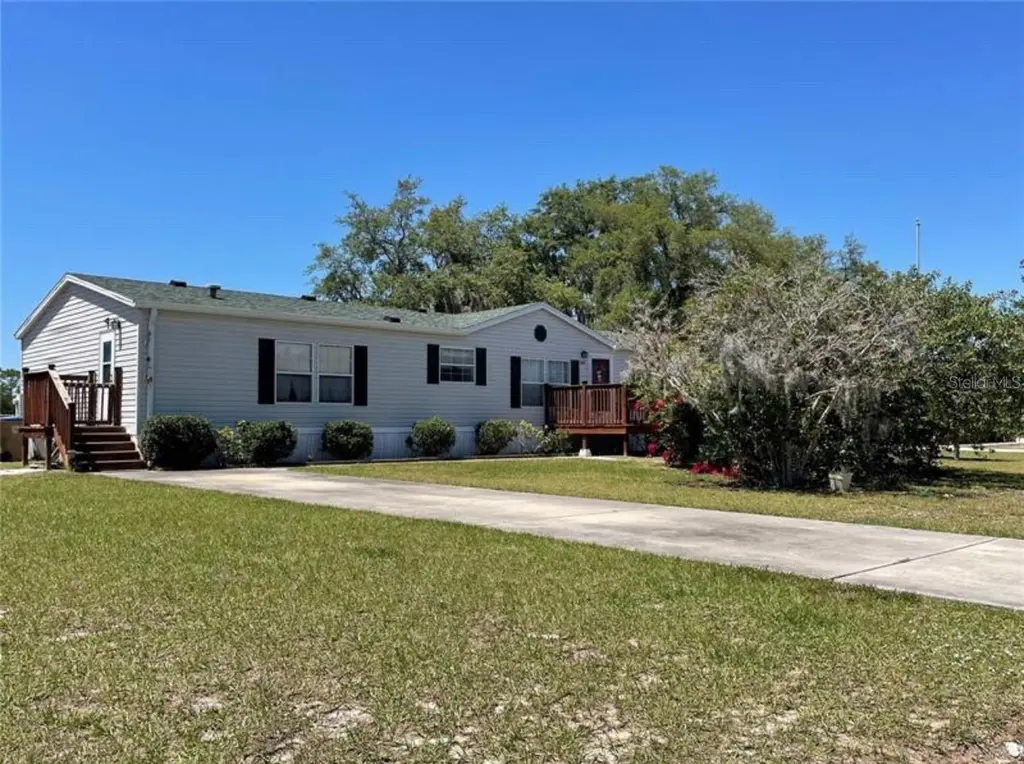
1814 Winchester Ct S · St. Cloud, FL
Flood risk 1/10 · Minimal
- FEMA flood zone
- X (unshaded)
- Chance of flooding over 30 yrs
- 0.0%
- Est. flood insurance / yr
- $507 – $1,088
Fire risk 6/10 · Moderate
- Est. fire insurance / yr
- $947 – $1,759
Heat risk 9/10 · Severe
- Hot days now (above 108°F)
- 7 days/yr
- Hot days in 30 yrs
- 24 days/yr
Wind risk 10/10 · Severe
- Chance of severe wind over 30 yrs
- 99.0%
Air-quality risk 2/10 · Minimal
- Unhealthy air days now
- 1 days/yr
- Unhealthy air days in 30 yrs
- 1 days/yr
Risk factors via First Street. Map © Google.
Why this score? — see what drove the D grade
The composite is a weighted blend of 9 inputs, each scored 0–100. Each bar is that input's sub-score; the figure is the points it added to the 100-point composite (weight × sub-score).
- Cash flow +21.4/30.0
- DSCR +6.8/10.0
- 1% rule +4.7/10.0
- Schools +3.6/10.0
- Rent growth +3.3/5.0
- Livability +2.5/5.0
- Condition / age +2.5/5.0
- ARV discount +0.0/15.0
- Appreciation +0.0/10.0
$260,000
🖨 Deal sheet (PDF) 📄 Offer letter ✓ Due diligence
Listing remarks
Discover the perfect blend of peace and convenience in this 3-bedroom, 2-bathroom home nestled on a half-acre lot in Hunter's Ridge. Enjoy the tranquility of your private backyard while benefiting from the low HOA fee. This home offers easy access to major roadways, putting Orlando and Cocoa Beach within a comfortable 45-minute drive. The surrounding area boasts a variety of amenities, including grocery stores, pharmacies, dining options, and parks, all within a short distance. With excellent schools like Hickory Tree Elementary and Harmony High School nearby, as well as several private school options, this location is ideal for families. Experience the best of both worlds: a serene country
Key facts
- Excellent schools
- Private backyard
- Variety of amenities
Tags
Property features AI
Finance
- Other: Property is homesteaded
- Financial info: Lease restrictions apply
- HOA & community: Has HOA; annual association fee of $80 (approximately $6.67/month); Association approval not required; Pets allowed
Exterior
- Parking: Driveway
- Security: Smoke detector(s)
- Utilities: Well water; Septic tank; Cable available; Electricity available; Phone service available; One well and one septic on site
- Home design: Manufactured double wide home; Single-story; East-facing; Residential property
- Construction: Vinyl siding; Shingle roof; Crawlspace foundation; Built as a double wide manufactured home
- Exterior features: Private mailbox; Rain gutters; Exterior storage; Chain link fencing; Fruit trees on the property; Paved lot within city limits; Asphalt road frontage
Interior
- Kitchen: Dishwasher; Range; Microwave; Refrigerator; Water softener
- Bedrooms: 3 bedrooms
- Flooring: Carpet; Laminate; Vinyl
- Bathrooms: 2 full bathrooms
- Heating & cooling: Central heating; Central air conditioning
- Interior features: Ceiling fans; Eat-in kitchen; Living room/dining room combo; Split bedroom floorplan; Walk-in closets; Skylights; Blinds; Smoke detectors
- Laundry & utility: Laundry room with washer hookup; Washer; Dryer; Corridor access to laundry
Neighborhood map
What this means for you Summary
Snapshot
- This is a 3-bed/2.0-bath manufactured listed at $260k.
Deal economics
- At list price, monthly cash flow is $386 ($5k/yr) — positive.
- The deal already cash-flows at list — no discount required.
- To meet the 1% rule (rent ≥ 1% of price), the offer needs to be $253k (2.8% below list).
- Recommended offer: $253k (2.8% below list) — sets the bar for 1% rule.
- Cap rate 8.1% vs local median 4.0% in St. Cloud — top-decile yield for the area; either an underpriced asset or a hidden risk that comps aren't pricing in. Stress-test before assuming the spread holds.
Location & tenants
- Location reads: area grade D — affects rentability + tenant quality, not the cash-flow math above.
- Osceola (suburban): math 39% / reading 45% proficiency, ranked #60 of 73 in FL (top 82%) — families likely to look elsewhere, expect single-tenant / working-renter base with shorter leases; 60% free/reduced lunch — lower-income household profile, screen leases tightly.
- Market conditions: Rents rising (+3.0%/yr); 1378 active listings in the ZIP; 16 comparable units currently listed for rent nearby; rentals at typical pace (median 15d on market — plan ~3-4 weeks tenant-placement turnaround); solid renter incomes; 8,813 units permitted in Osceola County in 2024 (3,072 in 5+ unit buildings).
- This rent runs 31% of the median local income ($97k/yr) — at the standard rent-burdened threshold; future hikes will face affordability resistance.
Forward outlook
- Local home prices are declining (-3.0%/yr); year-one equity from $2k of loan paydown is wiped out by about $8k of value loss. Plan a longer hold.
- Osceola County population projected at +73% by 2050 — long-run rental-demand tailwind backs the buy-and-hold thesis.
Negotiation context
- It's been on market 18 days — a 2% lower offer ($256k) is reasonable based on typical stale-listing flexibility.
- 2 sale attempts since 2y ago with the ask held roughly flat each time — persistent listings suggest the price (not the market) is what's stuck; bring a comps-based counter.
Risks & watch-outs
- Climate carrying-cost: severe wind risk, 99% chance of damaging wind over 30y; major wildfire risk; extreme-heat days projected 7→24/yr by 2055 (HVAC capex compounding) — expect insurance premiums to compound above CPI over the hold.
Questions for the listing agent
- What does the HOA fee cover, when was the last increase, and are there any pending special assessments or reserve-fund shortfalls?
- Is there a deadline driving the sale (1031 exchange, divorce, estate, relocation)? That informs how much negotiation room exists.
- The area grade is low — what's the realistic commute time and amenity access for the typical tenant pool here? Any planned neighborhood developments (good or bad) we should know about?
- What's the average days-on-market for RENTAL listings here right now (not sales)? A rising rental-DOM trend means longer vacancies and softer asking-rent achievability than the comps imply.
- What's the recent tenant-quality profile in this submarket — average credit score on applications, eviction rate, late-payment / NSF rate, and stable-employment percentage? A property-management company in the area should have these aggregated.
- How much new for-sale + rental construction is in the pipeline within 1–3 miles? Heavy new supply typically softens prices + rents 12–24 months out; constrained supply supports both.
Investment metrics
- 1% rule
- 0.97% ✗
- Cap rate
- 8.08%
- Cash-on-cash
- 6.37%
- DSCR
- 1.28
- GRM
- 8.6
CMA / ARV
- ARV (on-the-fly)
- $174,420
- Comps found
- 1
Show comp detail 1 sale within ~0.75 mi
| Address | Dist | Beds/Ba | Sqft | Sold | Price | $/sf | Match |
|---|---|---|---|---|---|---|---|
| 1831 Winchester Ct S | 0.16mi | 3/2.0 | 2,100 (+14%) | 1mo | $200,000 | $95 | 67 |
Match score weights: distance 35% · size 25% · config 20% · recency 20%. Top-matched comps best support the ARV.
Projected returns pro-forma
-3.0% appreciation · 3.02% rent growth · sell at horizon
- IRR
- -6.5%
- Equity multiple
- 0.76×
- Total profit
- $-17,548
- Equity at exit
- $38,767
- IRR
- 3.1%
- Equity multiple
- 1.22×
- Total profit
- $16,306
- Equity at exit
- $22,480
Cash invested: $72,800 (down + closing). Projections, not guarantees.
Landlord ↔ Tenant lean methodology
- Overall (STATE)
- 87 Strongly Landlord-Friendly
- State Florida
- 87 Strongly Landlord-Friendly · R+3
- County
- — inherits STATE
- City
- — inherits STATE
ZIP-level market 34771
- Home prices YoY
- -30.0%
- Rents YoY
- 3.0%
- Active inventory
- 1378
- Price-to-rent
- 8.6×
Monthly cashflow live
- Estimated rent
- $2,528 high interval (Pro) →
- Mortgage (P&I)
- −$1,363
- Tax from tax record
- −$133 /mo · $1,598/yr
- Insurance
- −$108
- HOA
- −$6
- Vacancy / Maint / Mgmt
- −$531
- Net cashflow
- $386
Break-even live
Sensitivity live
| Price | -10% $534 | -5% $460 | +0% $386 | +5% $313 | +10% $239 |
|---|---|---|---|---|---|
| Rent | -10% $187 | -5% $286 | +0% $386 | +5% $486 | +10% $586 |
| Rate | -1.0pp $517 | -0.5pp $452 | base $386 | +0.5pp $319 | +1.0pp $250 |
UW: 25.0% down · 7.5% · 30yr · 1.5% tax · 5.0% vac · 8.0% maint · 8.0% mgmt
Financing live
Cash to close
- Down payment
- $65,000
- Closing costs
- $7,800
- Reserves months
- —
- Total cash needed
- —
Loan-product check · same deal, 3 products live
Conventional
25% down · 7.5% · 30yr
- Down + closing
- —
- Monthly P&I
- —
- Monthly cashflow
- —
- DSCR
- —
- Eligible?
- —
Personal DTI + credit; lowest rate.
DSCR
20% down · 8.5% · 30yr
- Down + closing
- —
- Monthly P&I
- —
- Monthly cashflow
- —
- DSCR
- —
- Eligible?
- —
No personal income docs; deal must DSCR.
Hard money
10% down · 12.0% · 12mo
- Down + closing
- —
- Monthly P&I
- —
- Monthly cashflow
- —
- DSCR
- —
- Eligible?
- —
Short-term bridge; refi at stabilization.
Rent comps 16 comps
| Address | Beds | Baths | Sqft | Rent | $/sqft | DOM | Units | Dist |
|---|---|---|---|---|---|---|---|---|
| 5574 Bakewell Pl Saint Cloud, FL | 4.0 | 2.0 | 1957 | $2,350 | $1.20 | 22d | 1 | 0.25mi |
| 5684 Western Sun Dr Saint Cloud, FL | 3.0 | 2.0 | 1678 | $2,500 | $1.49 | 24d | 1 | 0.38mi |
| 1679 Bay Breeze Dr Saint Cloud, FL | 4.0 | 2.0 | 1856 | $2,195 | $1.18 | 3d | 1 | 0.52mi |
| 5642 Western Sun Dr Saint Cloud, FL | 3.0 | 2.0 | 1672 | $1,995 | $1.19 | 3d | 1 | 0.61mi |
| 1874 Crooked Creek St Saint Cloud, FL | 3.0–5.0 | 2.0–3.0 | 2046 | $2,300 | $1.12 | 24d | 1 | 0.64mi |
| 2042 Iorio St Saint Cloud, FL | 4.0 | 2.0 | 1862 | $2,600 | $1.40 | 24d | 1 | 0.68mi |
| 5476 Angel Way Saint Cloud, FL | 1.0–3.0 | 1.0–2.0 | 984 | $2,149 | $2.18 | 3d | 34 | 0.69mi |
| 1978 Education St Saint Cloud, FL | 3.0 | 2.5 | 1728 | $2,400 | $1.39 | 18d | 1 | 0.75mi |
| 1859 Castleton Dr Saint Cloud, FL | 4.0 | 2.0 | 2064 | $2,490 | $1.21 | 5d | 1 | 0.77mi |
| 1842 Castleton Dr Saint Cloud, FL | 4.0 | 2.0 | 1859 | $2,419 | $1.30 | 3d | 1 | 0.82mi |
| 6008 Vision Rd Saint Cloud, FL | 4.0 | 2.0 | 2103 | $2,450 | $1.17 | 15d | 1 | 0.82mi |
| 5314 Amersham Ln Saint Cloud, FL | 4.0 | 3.0 | 2110 | $650 | $0.31 | 3d | 1 | 0.97mi |
| 5301 Amersham Ln Saint Cloud, FL | 3.0 | 2.5 | 2434 | $3,000 | $1.23 | 24d | 1 | 1.01mi |
| 5120 Star Ruby Ave Saint Cloud, FL | 3.0 | 2.0 | 1676 | $2,110 | $1.26 | 8d | 1 | 1.30mi |
| 1883 Green Dragon Dr Saint Cloud, FL | 4.0 | 2.0 | 1767 | $2,570 | $1.45 | 5d | 1 | 1.40mi |
| 5203 Northern Flicker Dr Saint Cloud, FL | 3.0 | 2.0 | 1276 | $2,000 | $1.57 | 24d | 1 | 1.43mi |
HOA detail
- Monthly dues
- $6 · $72/yr
Listing history 12 events
-
2026-05-01status Pending
-
2026-04-12$260,000 Active
-
2025-05-23status Pending
-
2025-05-22historical
-
2025-04-09price $290,000
-
2024-11-23price $300,000
-
2024-10-04price $305,000
-
2024-07-25price $315,000
-
2024-07-12price $320,000
-
2024-06-29price $325,000
-
2024-04-12$330,000 Active
-
2000-07-13soldstatus $517,000
ⓘ Source: listings_history table (triggers on properties + properties_extension) + one-shot
backfill from property_details.listing_events for pre-trigger history.
Tax reassessment forecast FL · Resets to sale price
- Current annual tax
- $1,598 · $133/mo
- Projected year-2 tax
- $2,158 · $180/mo
- Expected delta
- +$560/yr (+$47/mo · 35.0%)
ⓘ Screening estimate from a state-policy table — verify with the county assessor before closing.
Climate risk First Street
- Flood 1/10 Low FEMA zone X (unshaded) · 0% chance over 30 yrs
- Wildfire 6/10 Major
- Heat 9/10 Extreme 7 d/yr ≥108°F today · 24 d/yr by 30 yrs out
- Wind 10/10 Extreme 99% chance of damaging wind over 30 yrs
- Air quality 2/10 Low 1 unhealthy d/yr today · 1 by 30 yrs out
Nearby sold comps map
Loading sold comps map…
Walkable amenities ~0.75 mi
Loading nearby amenities…
Taxation est. · year 1
- Rental income
- $30,340
- − Mortgage interest
- −$14,564
- − Property taxes
- −$1,598
- − Insurance
- −$1,300
- − Repairs & maintenance
- −$2,427
- − Management
- −$2,427
- − HOA
- −$72
- − Depreciation
- −$7,564
- Taxable income
- $387
- Est. tax owed @ 24.0%
- −$93
- After-tax cash flow
- $4,543/yr
For passive investors: Depreciation is non-cash, so a rental often shows a tax loss while cash-flowing — sheltering income. Rental losses are passive: they offset passive income freely, and up to $25,000/yr can offset ordinary (W-2) income if you actively participate and your MAGI is under $100k (phasing out to $0 by $150k); unused losses carry forward. On sale, claimed depreciation is recaptured at up to 25%, and gains may owe capital-gains tax (a 1031 exchange can defer both). Figures are a year-1 estimate at your 24.0% rate — not tax advice; consult a CPA.
Schools (NCES district)
- District
- Osceola
- NCES district ID
- 1201470
- Math proficiency
- 39% ▼ -9.00%
- Reading proficiency
- 45% ▼ -4.00%
- Median HH income
- $45,528
- Composite
- 35.7/100
- National rank
- #4865
- State rank
- #60 of 73 in FL
Livability — St. Cloud
No livability data for this city. (Only ~50 U.S. cities are tracked.)
Census & demographics
- County
- Osceola County · 410,217 people
- City population
- 29,247
- Metro
- Orlando-Kissimmee-Sanford, FL
- Population (ZIP)
- 35,257
- Household income
- $97,415
- Rent vs Own
- Severe rent burden
- 338.0
Population outlook (Osceola County) Hauer SSP2
- Today (2025)
- 447,624 people
- By 2030
- 511,823 · +14.3%
- By 2040
- 642,986 · +43.6%
- By 2050
- 774,552 · +73.0%
- By 2075
- 1,078,144 · +140.9%
- By 2100
- 1,269,660 · +183.6%
Race, ethnicity, and origin ACS 2023
- Neighborhood character
- Diverse neighborhood (Simpson 0.62)
- Race & ethnicity
- White 45% Hispanic / Latino 41% Two or more races 20% Black 9% Asian 2%
- Hispanic origin (detail)
- Mexican 3% Puerto Rican 26% Cuban 2% Dominican 4%
- Common ancestry
- Slovak 2% Romanian 2% Lithuanian 1%
- Foreign-born
- 14% · Canada, Jamaica
- Languages at home
- 64% English-only · Spanish 33% Other Indo-European 3%
Political lean MEDSL · Osceola
- 2024 margin
- Toss-up / Even · D 48.7% · R 50.2% · Other 1.1%
- 2008→2024 swing
- -21.2pp toward R · 2008: 19.7pp · 2024: -1.4pp
- All cycles
- 2024: R+1.4 2020: D+13.8 2016: D+25.0 2012: D+24.5 2008: D+19.7
Not yet ingested
- Civics
- —
Market trends
- HPI YoY
- ▼ -124.44%
- Current HPI
- 290.3095
- Rent YoY
- ▲ 3.02%
- Metro
- Orlando-Kissimmee-Sanford, FL
- State GDP YoY
- ▲ 3.28%
- F500 in state
- 36
Industry mix (Fortune 500 HQ in FL)
| Industry | F500 HQs | Revenue |
|---|---|---|
| Industrial Technology | 2 | $29B |
|
||
| Insurance | 2 | $17B |
|
||
| Retail | 1 | $60B |
|
||
| Technology Distribution | 1 | $58B |
|
||
| Homebuilding | 1 | $35B |
|
||
| Technology Manufacturing | 1 | $35B |
|
||
Price history
-49.7% since first listed12 events — show timeline
- 2026-05-01 Pending — Stellar MLS as Distributed by MLS Grid
- 2026-04-12 Listed $260,000 Stellar MLS as Distributed by MLS Grid
- 2025-05-23 Pending — Stellar MLS as Distributed by MLS Grid
- 2025-05-22 Listing Removed — Stellar MLS as Distributed by MLS Grid
- 2025-04-09 Price Changed $290,000 Stellar MLS as Distributed by MLS Grid
- 2024-11-23 Price Changed $300,000 Stellar MLS as Distributed by MLS Grid
- 2024-10-04 Price Changed $305,000 Stellar MLS as Distributed by MLS Grid
- 2024-07-25 Price Changed $315,000 Stellar MLS as Distributed by MLS Grid
- 2024-07-12 Price Changed $320,000 Stellar MLS as Distributed by MLS Grid
- 2024-06-29 Price Changed $325,000 Stellar MLS as Distributed by MLS Grid
- 2024-04-12 Listed $330,000 Stellar MLS as Distributed by MLS Grid
- 2000-07-13 Sold (Public Records) $517,000 Public Records
Property tax history
+6.0%/yrLatest (2025): $1,598 · +7.5% YoY. Source: county tax records.
Cash-flow waterfall
monthlySold comps — $/sqft
last 12 mo · ≤1 miLoading sold comps…