603 W Main St · Van Buren, IN
Flood risk 1/10 · Minimal
- FEMA flood zone
- X (unshaded)
- Chance of flooding over 30 yrs
- 0.0%
- Est. flood insurance / yr
- $473 – $860
Fire risk 1/10 · Minimal
- Est. fire insurance / yr
- $717 – $1,331
Heat risk 3/10 · Minor
- Hot days now (above 100°F)
- 7 days/yr
- Hot days in 30 yrs
- 18 days/yr
Wind risk 2/10 · Minimal
- Chance of severe wind over 30 yrs
- 1.0%
Air-quality risk 3/10 · Minor
- Unhealthy air days now
- 2 days/yr
- Unhealthy air days in 30 yrs
- 3 days/yr
Risk factors via First Street. Map © Google.
Why this score? — see what drove the B grade
The composite is a weighted blend of 9 inputs, each scored 0–100. Each bar is that input's sub-score; the figure is the points it added to the 100-point composite (weight × sub-score).
- Cash flow +30.0/30.0
- 1% rule +10.0/10.0
- DSCR +10.0/10.0
- ARV discount +7.5/15.0
- Appreciation +5.0/10.0
- Schools +3.8/10.0
- Livability +3.0/5.0
- Rent growth +2.5/5.0
- Condition / age +2.5/5.0
$79,900
🖨 Deal sheet 📄 Offer letter ✓ Due diligence
Listing remarks MLS
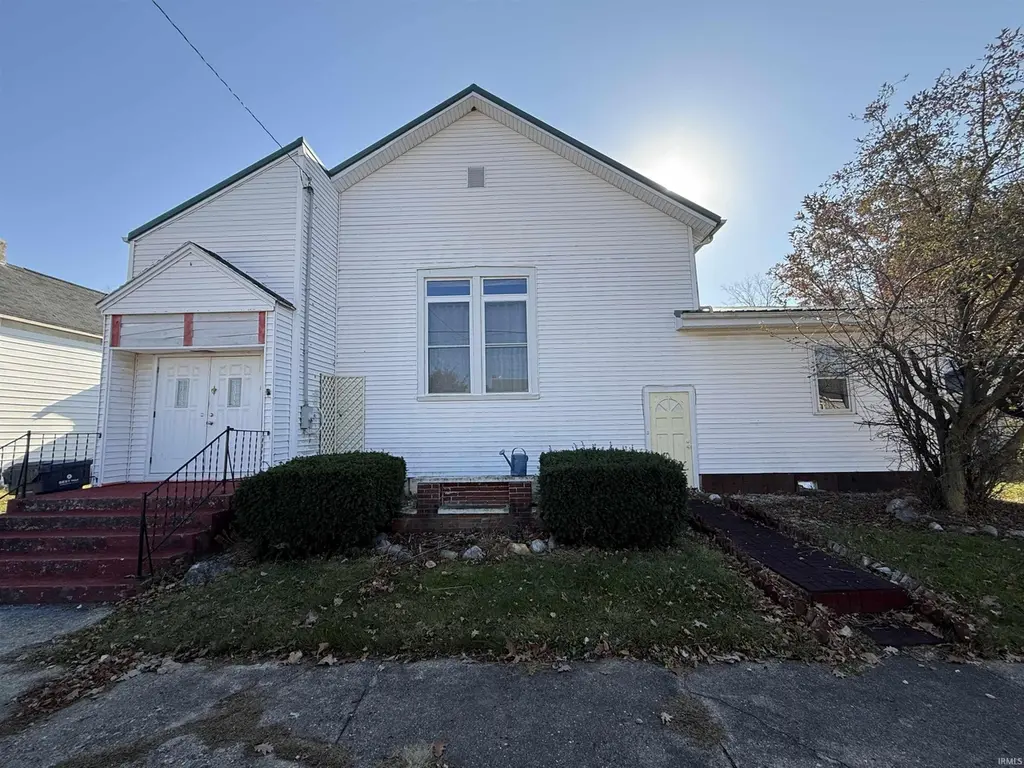
Endless possibilities with this unique, historical property zoned for residential and business. Formerly a church, the property has been converted into a residence with 3 bedrooms, 1 bath, and a large, updated kitchen. The spacious living area has original hardwood floors, built-in bookcases, and a loft. A covered porch overlooks the back yard.
Key facts
- Historic property
- Built-in bookcases
- Open living area
Tags
Property features AI
Finance
- Other: Located in the Eastbrook Community school district
Exterior
- Utilities: Public water; Public sewer
- Home design: Single-family residence; Site-built home; One story
- Construction: Vinyl siding; Concrete perimeter and block foundation
- Exterior features: Level lot; Lot dimensions approximately 55 x 132
Interior
- Bathrooms: 1 full bathroom (main level)
- Heating & cooling: Central air; Wood and forced-air heating
- Interior features: Partial basement; 8 total rooms; Main-level laundry
- Laundry & utility: Laundry on main level
Neighborhood map
What this means for you Summary
Snapshot
- This is a 3-bed/1.0-bath single-family listed at $80k.
Deal economics
- At list price, monthly cash flow is $425 ($5k/yr) — positive.
- The deal already cash-flows at list — no discount required.
- Meets the 1% rule at list price ($1k rent vs $80k).
- Recommended offer: $70k (12.0% below list) — sets the bar for market timing.
Location & tenants
- Location reads 60/100 on livability (#529 in IN) — a middle-class / working-renter tenant base. Strengths: cost of living A+, housing A-; Watch: health & safety C-, crime D, amenities F.
- Eastbrook Community School Corporation (rural): math 42% / reading 46% proficiency, ranked #98 of 301 in IN (top 33%) — families likely to look elsewhere, expect single-tenant / working-renter base with shorter leases.
- Zoned schools: Eastbrook South Elementary (math 50% / reading 45%, grade D, #321 of 994 statewide, top 33%, 377 students, 48% FRL); Eastbrook Middle School (math 30% / reading 45%, grade F, #146 of 330 statewide, top 46%, 399 students, 48% FRL); Eastbrook High School (math 52% / reading 72%, grade B-, #41 of 369 statewide, top 12%, 509 students, 38% FRL).
- Market conditions: 1 active listings in the ZIP; 52 units permitted in Grant County in 2024 (8 in 5+ unit buildings).
Forward outlook
- In year one you build about $3k of equity ($552 loan paydown + $2k appreciation (3.0% local appreciation)).
- Grant County population projected at -18% by 2050 — secular population decline; favor cash flow + early exit over multi-decade hold.
- At projected returns (3.0% appreciation + 3.0% rent growth), your $22k cash investment doubles in ~3 years — after that, you're playing with house money.
Negotiation context
- It's been on market 190 days — a 12% lower offer ($70k) is reasonable based on typical stale-listing flexibility.
- 5 sale attempts since 5y ago; this cycle's ask has dropped $14k (15%) from the opening price — seller is motivated, your offer sets the floor, not the list.
- Current owner paid $57k; 40% above their basis — modest negotiation headroom, anchor on the comps not their cost.
Risks & watch-outs
- Watch-outs: built in 1935 — expect roof / HVAC / electrical / plumbing capex.
Questions for the listing agent
- It's been on market 190 days. Have you received any prior offers? Is the seller open to a 12% concession, seller financing, or rate buy-down credit?
- Built in 1935 — when were the roof, HVAC, electrical panel, plumbing, and water heater last replaced?
- Why hasn't it sold? Are there any deal-killer items the seller is aware of (foundation, flood, title, zoning, code violations)?
- Is there a deadline driving the sale (1031 exchange, divorce, estate, relocation)? That informs how much negotiation room exists.
- Schools are D-rated, which usually means shorter tenancies and higher turnover. Who's the typical renter profile here, and what's been the actual vacancy rate?
- Crime grade is D in this area — have there been break-ins, vandalism, or insurance claims at this property in the last 3 years? What carrier currently insures it and at what premium?
- What's the average days-on-market for RENTAL listings here right now (not sales)? A rising rental-DOM trend means longer vacancies and softer asking-rent achievability than the comps imply.
- What's the recent tenant-quality profile in this submarket — average credit score on applications, eviction rate, late-payment / NSF rate, and stable-employment percentage? A property-management company in the area should have these aggregated.
- How much new for-sale + rental construction is in the pipeline within 1–3 miles? Heavy new supply typically softens prices + rents 12–24 months out; constrained supply supports both.
Investment metrics
- 1% rule
- 1.65% ✓
- Cap rate
- 12.68%
- Cash-on-cash
- 22.82%
- DSCR
- 2.02
- GRM
- 5.1
CMA / ARV
No comps found within radius.
Projected returns pro-forma
3.0% appreciation · 3.0% rent growth · sell at horizon
- IRR
- 29.0%
- Equity multiple
- 2.64×
- Total profit
- $36,777
- Equity at exit
- $35,926
- IRR
- 29.5%
- Equity multiple
- 5.16×
- Total profit
- $93,048
- Equity at exit
- $55,367
Cash invested: $22,372 (down + closing). Projections, not guarantees.
Landlord ↔ Tenant lean methodology
- Overall (STATE)
- 90 Strongly Landlord-Friendly
- State Indiana
- 90 Strongly Landlord-Friendly · R+11
- County
- — inherits STATE
- City
- — inherits STATE
ZIP-level market 46691
- Active inventory
- 1
- Price-to-rent
- 5.1×
Monthly cashflow live
- Estimated rent
- $1,318 medium interval (Pro) →
- Mortgage (P&I)
- −$419
- Tax from tax record
- −$164 /mo · $1,965/yr
- Insurance
- −$33
- HOA
- −$0
- Vacancy / Maint / Mgmt
- −$277
- Net cashflow
- $425
Break-even live
UW: 25.0% down · 7.5% · 30yr · 1.5% tax · 5.0% vac · 8.0% maint · 8.0% mgmt
Financing live
Cash to close
- Down payment
- $19,975
- Closing costs
- $2,397
- Reserves months
- —
- Total cash needed
- —
Loan-product check · same deal, 3 products live
Conventional
25% down · 7.5% · 30yr
- Down + closing
- —
- Monthly P&I
- —
- Monthly cashflow
- —
- DSCR
- —
- Eligible?
- —
Personal DTI + credit; lowest rate.
DSCR
20% down · 8.5% · 30yr
- Down + closing
- —
- Monthly P&I
- —
- Monthly cashflow
- —
- DSCR
- —
- Eligible?
- —
No personal income docs; deal must DSCR.
Hard money
10% down · 12.0% · 12mo
- Down + closing
- —
- Monthly P&I
- —
- Monthly cashflow
- —
- DSCR
- —
- Eligible?
- —
Short-term bridge; refi at stabilization.
Listing history 11 events
-
2026-05-18status Active
-
2026-04-17historical Active Under Contract
-
2026-03-10price $79,900
-
2026-02-23status Active
-
2026-02-19historical Active Under Contract
-
2025-12-02price $85,000
-
2025-11-15$93,500 Active
-
2022-04-22soldstatus $57,000
-
2022-04-22$57,000
-
2022-01-26soldstatus $57,000 346-char remark
Show marketing remark (346 chars)
Endless possibilities with this unique, historical property zoned for residential and business. Formerly a church, the property has been converted into a residence with 3 bedrooms, 1 bath, and a large, updated kitchen. The spacious living area has original hardwood floors, built-in bookcases, and a loft. A covered porch overlooks the back yard.
-
2021-12-08$57,000 346-char remark
Show marketing remark (346 chars)
Endless possibilities with this unique, historical property zoned for residential and business. Formerly a church, the property has been converted into a residence with 3 bedrooms, 1 bath, and a large, updated kitchen. The spacious living area has original hardwood floors, built-in bookcases, and a loft. A covered porch overlooks the back yard.
ⓘ Source: listings_history table (triggers on properties + properties_extension) + one-shot
backfill from property_details.listing_events for pre-trigger history.
Tax reassessment forecast IN · Partial reset (capped growth)
- Current annual tax
- $1,965 · $164/mo
- Projected year-2 tax
- $1,965 · $164/mo
- Expected delta
- $0/yr ($0/mo · 0.0%)
ⓘ Screening estimate from a state-policy table — verify with the county assessor before closing.
Climate risk First Street
- Flood 1/10 Low FEMA zone X (unshaded) · 0% chance over 30 yrs
- Wildfire 1/10 Low
- Heat 3/10 Moderate 7 d/yr ≥100°F today · 18 d/yr by 30 yrs out
- Wind 2/10 Low 100% chance of damaging wind over 30 yrs
- Air quality 3/10 Moderate 2 unhealthy d/yr today · 3 by 30 yrs out
Nearby sold comps map
Loading sold comps map…
Walkable amenities ~0.75 mi
Loading nearby amenities…
Taxation est. · year 1
- Rental income
- $15,819
- − Mortgage interest
- −$4,476
- − Property taxes
- −$1,965
- − Insurance
- −$400
- − Repairs & maintenance
- −$1,266
- − Management
- −$1,266
- − Depreciation
- −$2,324
- Taxable income
- $4,124
- Est. tax owed @ 24.0%
- −$990
- After-tax cash flow
- $4,115/yr
For passive investors: Depreciation is non-cash, so a rental often shows a tax loss while cash-flowing — sheltering income. Rental losses are passive: they offset passive income freely, and up to $25,000/yr can offset ordinary (W-2) income if you actively participate and your MAGI is under $100k (phasing out to $0 by $150k); unused losses carry forward. On sale, claimed depreciation is recaptured at up to 25%, and gains may owe capital-gains tax (a 1031 exchange can defer both). Figures are a year-1 estimate at your 24.0% rate — not tax advice; consult a CPA.
Schools (NCES district)
- District
- Eastbrook Community School Corporation
- NCES district ID
- 1803030
- Math proficiency
- 42% ▬ 0.00%
- Reading proficiency
- 46% ▼ -1.00%
- Median HH income
- $55,030
- Composite
- 38.28/100
- National rank
- #4234
- State rank
- #98 of 301 in IN
Livability — Van Buren
- Score
- 60/100
- State rank
- #529
- US rank
- #19010
Category grades
Schools grade is shown separately in the Schools card above.
Census & demographics
- Census place
- Van Buren, IN
Population outlook (Grant County) Hauer SSP2
- Today (2025)
- 64,394 people
- By 2030
- 62,145 · -3.5%
- By 2040
- 57,252 · -11.1%
- By 2050
- 52,968 · -17.7%
- By 2075
- 45,986 · -28.6%
- By 2100
- 39,400 · -38.8%
Not yet ingested
- Political lean
- —
- Race & ethnicity
- —
- Common origin
- —
- Civics
- —
Market trends
- HPI YoY
- —
- Current HPI
- —
- Rent YoY
- —
- Metro
- —
- State GDP YoY
- ▲ 2.90%
- F500 in state
- 18
Industry mix (Fortune 500 HQ in IN)
| Industry | F500 HQs | Revenue |
|---|---|---|
| Industrial Machinery | 2 | $37B |
|
||
| Healthcare | 1 | $177B |
|
||
| Pharmaceuticals | 1 | $45B |
|
||
| Metals / Steel | 1 | $18B |
|
||
| Agriculture | 1 | $17B |
|
||
| Packaging | 1 | $12B |
|
||
Price history
+40.2% since first listed11 events — show timeline
- 2026-05-18 Relisted — IRMLS
- 2026-04-17 Contingent — IRMLS
- 2026-03-10 Price Changed $79,900 IRMLS
- 2026-02-23 Relisted — IRMLS
- 2026-02-19 Contingent — IRMLS
- 2025-12-02 Price Changed $85,000 IRMLS
- 2025-11-15 Listed $93,500 IRMLS
- 2022-04-22 Listed $57,000 MIBOR as Distributed by MLS Grid
- 2022-04-22 Sold (MLS) $57,000 MIBOR as Distributed by MLS Grid
- 2022-01-26 Sold (MLS) $57,000 IRMLS
- 2021-12-08 Listed $57,000 IRMLS
Property tax history
+15.2%/yrLatest (2025): $1,965 · +13.1% YoY. Source: county tax records.
Cash-flow waterfall
monthlySold comps — $/sqft
last 12 mo · ≤1 miLoading sold comps…