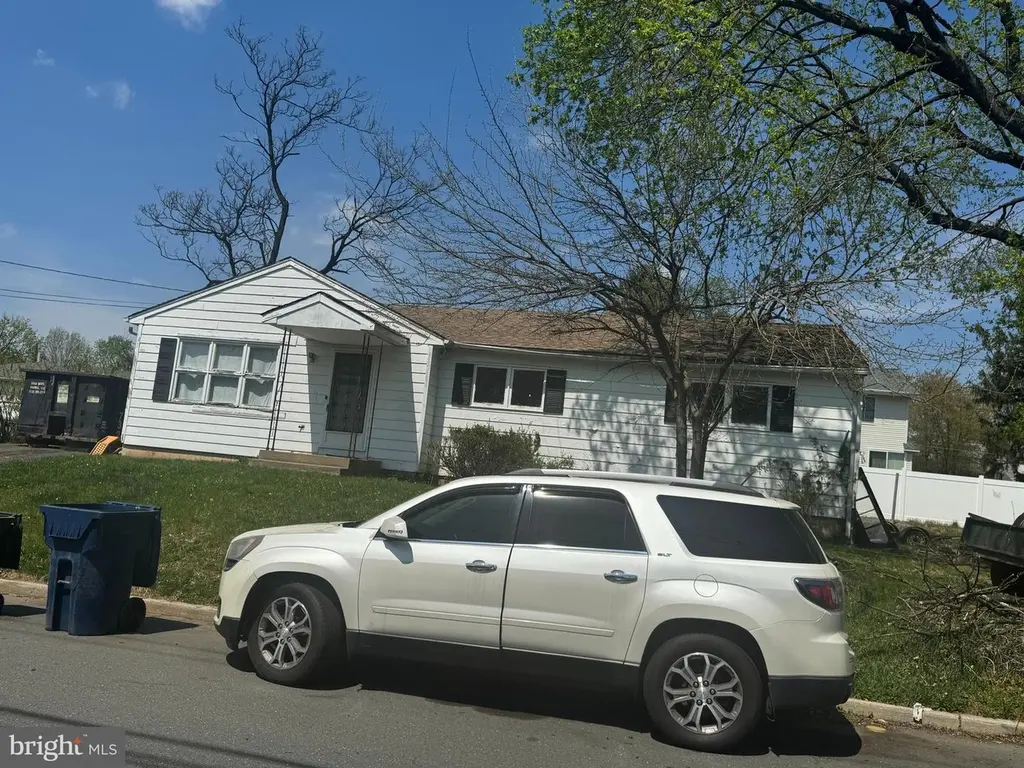
120 Meriline · Trenton, NJ
Flood risk 1/10 · Minimal
- FEMA flood zone
- X (unshaded)
- Chance of flooding over 30 yrs
- 0.0%
- Est. flood insurance / yr
- $507 – $1,088
Fire risk 1/10 · Minimal
- Est. fire insurance / yr
- $526 – $976
Heat risk 6/10 · Moderate
- Hot days now (above 101°F)
- 7 days/yr
- Hot days in 30 yrs
- 15 days/yr
Wind risk 6/10 · Moderate
- Chance of severe wind over 30 yrs
- 27.0%
Air-quality risk 4/10 · Minor
- Unhealthy air days now
- 6 days/yr
- Unhealthy air days in 30 yrs
- 7 days/yr
Risk factors via First Street. Map © Google.
Why this score? — see what drove the C+ grade
The composite is a weighted blend of 9 inputs, each scored 0–100. Each bar is that input's sub-score; the figure is the points it added to the 100-point composite (weight × sub-score).
- Cash flow +21.0/30.0
- ARV discount +15.0/15.0
- DSCR +6.7/10.0
- 1% rule +6.2/10.0
- Livability +3.8/5.0
- Schools +3.6/10.0
- Rent growth +2.5/5.0
- Condition / age +2.5/5.0
- Appreciation +0.0/10.0
$250,000
🖨 Deal sheet (PDF) 📄 Offer letter ✓ Due diligence
Listing remarks
Set on a residential street in Lawrence Township, 120 Meriline Ave offers a fabulous opportunity to reimagine a single-family home with some fundamentals already in place. The layout includes 3 bedrooms, hardwood floors, and a full unfinished basement with added storage and future-use potential. 1,244 square feet of interior space provides a solid canvas for updates, redesign, or restoration, offering flexibility for buyers looking to bring new life to a home in an established neighborhood.
Key facts
- 5,602 sq ft lot
- Built 1960
- Listed 13 days
Property features AI
Finance
- Other: Kick-out clause applies (5 days)
- Financial info: Ownership is fee simple
Exterior
- Parking: Driveway
- Utilities: Public water; Public sewer
- Home design: Detached home
- Construction: Wood siding; Block foundation; Year built per assessor
- Exterior features: Lot dimensions approximately 80' x 70'; Not in a federal flood zone; Above-grade and below-grade structures noted; Pets allowed with no pet restrictions
Interior
- Bedrooms: 3 bedrooms on the main level
- Bathrooms: 1 full bathroom on the main level
- Heating & cooling: Forced-air heating; Oil-fired heat; Electric hot water
- Interior features: Full basement
Neighborhood map
What this means for you Summary
Snapshot
- This is a 3-bed/1.0-bath single-family listed at $250k.
Deal economics
- At list price, monthly cash flow is $354 ($4k/yr) — positive.
- The deal already cash-flows at list — no discount required.
- Meets the 1% rule at list price ($3k rent vs $250k).
- Cap rate 8.0% vs local median 6.3% in Trenton — meaningfully above typical; check what's discounted (condition, days-on-market, listing class) to confirm the premium yield is real.
Location & tenants
- Location reads 76/100 on livability (#133 in NJ, #3,533 nationally) — a middle-class / working-renter tenant base. Strengths: amenities A+, commute A+, health & safety A+; Watch: schools F, crime F, employment F.
- Lawrence Township Public School District (suburban): math 24% / reading 52% proficiency, ranked #217 of 472 in NJ (top 46%) — families likely to look elsewhere, expect single-tenant / working-renter base with shorter leases; only 17% free/reduced lunch — higher-income household profile.
- Market conditions: Rents soft (-0.0%/yr); 119 active listings in the ZIP; 7 comparable units currently listed for rent nearby; rentals at typical pace (median 15d on market — plan ~3-4 weeks tenant-placement turnaround); high-income renter base; 2,256 units permitted in Mercer County in 2024 (1,303 in 5+ unit buildings).
Forward outlook
- Local home prices are declining (-3.0%/yr); year-one equity from $2k of loan paydown is wiped out by about $8k of value loss. Plan a longer hold.
- Mercer County population projected at +4% by 2050 — modest demand growth; plan on rents tracking national, not racing it.
Negotiation context
- Only 13 days on market — expect competitive offers; lowballing is unlikely to land.
Risks & watch-outs
- Climate carrying-cost: major wind risk, 27% chance of damaging wind over 30y; extreme-heat days projected 7→15/yr by 2055 (HVAC capex compounding) — expect insurance premiums to compound above CPI over the hold.
Questions for the listing agent
- Built in 1960 — when were the roof, HVAC, electrical panel, plumbing, and water heater last replaced?
- Is there a deadline driving the sale (1031 exchange, divorce, estate, relocation)? That informs how much negotiation room exists.
- Schools are F-rated, which usually means shorter tenancies and higher turnover. Who's the typical renter profile here, and what's been the actual vacancy rate?
- Crime grade is F in this area — have there been break-ins, vandalism, or insurance claims at this property in the last 3 years? What carrier currently insures it and at what premium?
- What's the average days-on-market for RENTAL listings here right now (not sales)? A rising rental-DOM trend means longer vacancies and softer asking-rent achievability than the comps imply.
- What's the recent tenant-quality profile in this submarket — average credit score on applications, eviction rate, late-payment / NSF rate, and stable-employment percentage? A property-management company in the area should have these aggregated.
- How much new for-sale + rental construction is in the pipeline within 1–3 miles? Heavy new supply typically softens prices + rents 12–24 months out; constrained supply supports both.
Investment metrics
- 1% rule
- 1.12% ✓
- Cap rate
- 7.99%
- Cash-on-cash
- 6.07%
- DSCR
- 1.27
- GRM
- 7.5
CMA / ARV
- ARV (on-the-fly)
- $380,664
- Comps found
- 12
Show comp detail 12 sales within ~0.75 mi
| Address | Dist | Beds/Ba | Sqft | Sold | Price | $/sf | Match |
|---|---|---|---|---|---|---|---|
| 54 Meriline | 0.16mi | 3/1.0 | 1,230 (-1%) | 10mo | $330,000 | $268 | 82 |
| 31 Gainsboro | 0.54mi | 3/1.5 | 1,232 (-1%) | 1mo | $475,000 | $386 | 70 |
| 50 Altamawr | 0.18mi | 3/1.0 | 1,370 (+10%) | 9mo | $455,000 | $332 | 67 |
| 13 Craigie Ave | 0.41mi | 3/1.0 | 1,348 (+8%) | 9mo | $173,900 | $129 | 59 |
| 140 Gainsboro | 0.40mi | 3/2.0 | 1,345 (+8%) | 6mo | $405,990 | $302 | 59 |
| 33 Sherbrooke Rd | 0.70mi | 3/1.0 | 1,336 (+7%) | 2mo | $325,000 | $243 | 53 |
| 62 Zoar Ave | 0.18mi | 3/2.0 | 1,104 (-11%) | 20mo | $395,000 | $358 | 52 |
| 15 Kilmer Dr | 0.65mi | 3/1.0 | 1,166 (-6%) | 9mo | $351,000 | $301 | 52 |
| 15 Renee | 0.58mi | 3/2.0 | 1,168 (-6%) | 11mo | $465,000 | $398 | 50 |
| 171 Drift Ave | 0.57mi | 2/1.0 (-1) | 1,142 (-8%) | 9mo | $350,000 | $306 | 47 |
| 106 Review Ave | 0.70mi | 3/2.0 | 1,092 (-12%) | 2mo | $460,000 | $421 | 41 |
| 39 Forrest | 0.31mi | 2/1.0 (-1) | 1,080 (-13%) | 22mo | $299,000 | $277 | 40 |
Match score weights: distance 35% · size 25% · config 20% · recency 20%. Top-matched comps best support the ARV.
Projected returns pro-forma
-3.0% appreciation · 0.0% rent growth · sell at horizon
- IRR
- -10.5%
- Equity multiple
- 0.63×
- Total profit
- $-26,010
- Equity at exit
- $37,276
- IRR
- -6.4%
- Equity multiple
- 0.65×
- Total profit
- $-24,712
- Equity at exit
- $21,615
Cash invested: $70,000 (down + closing). Projections, not guarantees.
Landlord ↔ Tenant lean methodology
- Overall (STATE)
- 21 Tenant-Leaning
- State New Jersey
- 21 Tenant-Leaning · D+6
- County
- — inherits STATE
- City
- — inherits STATE
ZIP-level market 08648
- Rents YoY
- -0.0%
- Active inventory
- 119
- Price-to-rent
- 7.5×
Monthly cashflow live
- Estimated rent
- $2,789 high interval (Pro) →
- Mortgage (P&I)
- −$1,311
- Tax from tax record
- −$434 /mo · $5,203/yr
- Insurance
- −$104
- HOA
- −$0
- Vacancy / Maint / Mgmt
- −$586
- Net cashflow
- $354
Break-even live
Sensitivity live
| Price | -10% $496 | -5% $425 | +0% $354 | +5% $283 | +10% $213 |
|---|---|---|---|---|---|
| Rent | -10% $134 | -5% $244 | +0% $354 | +5% $464 | +10% $574 |
| Rate | -1.0pp $480 | -0.5pp $418 | base $354 | +0.5pp $289 | +1.0pp $223 |
UW: 25.0% down · 7.5% · 30yr · 1.5% tax · 5.0% vac · 8.0% maint · 8.0% mgmt
Financing live
Cash to close
- Down payment
- $62,500
- Closing costs
- $7,500
- Reserves months
- —
- Total cash needed
- —
Loan-product check · same deal, 3 products live
Conventional
25% down · 7.5% · 30yr
- Down + closing
- —
- Monthly P&I
- —
- Monthly cashflow
- —
- DSCR
- —
- Eligible?
- —
Personal DTI + credit; lowest rate.
DSCR
20% down · 8.5% · 30yr
- Down + closing
- —
- Monthly P&I
- —
- Monthly cashflow
- —
- DSCR
- —
- Eligible?
- —
No personal income docs; deal must DSCR.
Hard money
10% down · 12.0% · 12mo
- Down + closing
- —
- Monthly P&I
- —
- Monthly cashflow
- —
- DSCR
- —
- Eligible?
- —
Short-term bridge; refi at stabilization.
Rent comps 7 comps
| Address | Beds | Baths | Sqft | Rent | $/sqft | DOM | Units | Dist |
|---|---|---|---|---|---|---|---|---|
| 550 Lawrenceville Rd Lawrence Township, NJ | 1.0–2.0 | 1.0 | 910 | $1,655 | $1.82 | 22d | 1 | 0.73mi |
| 2140 Princeton Pike Lawrenceville, NJ | 2.0 | 1.0 | 952 | $2,700 | $2.84 | 22d | 1 | 0.75mi |
| 11 Heath St Ewing, NJ | 3.0 | 1.0 | 1038 | $2,850 | $2.75 | 14d | 1 | 0.91mi |
| 756 Cherry Tree Ln Lawrence Township, NJ | 2.0 | 1.0 | 1207 | $2,200 | $1.82 | 14d | 1 | 1.06mi |
| 1000 Stewards Crossing Way Trenton, NJ | 1.0–3.0 | 1.0–2.0 | 973 | $3,193 | $3.28 | 14d | 10 | 1.17mi |
| 1208 Colts Cir Unit F Lawrence Township, NJ | 2.0 | 2.0 | 1133 | $2,300 | $2.03 | 22d | 1 | 1.46mi |
| 1040 Indiana Ave Trenton, NJ | 3.0 | 1.0 | 1232 | $2,950 | $2.39 | 14d | 1 | 1.47mi |
Listing history 4 events
-
2026-06-03status $250,000 Pending 13 DOM
-
2026-04-29historical Active Under Contract
-
2026-04-17$250,000 Active
-
2026-04-16historical $250,000
ⓘ Source: listings_history table (triggers on properties + properties_extension) + one-shot
backfill from property_details.listing_events for pre-trigger history.
Tax reassessment forecast NJ · Partial reset (capped growth)
- Current annual tax
- $5,203 · $434/mo
- Projected year-2 tax
- $5,714 · $476/mo
- Expected delta
- +$511/yr (+$43/mo · 9.8%)
ⓘ Screening estimate from a state-policy table — verify with the county assessor before closing.
Climate risk First Street
- Flood 1/10 Low FEMA zone X (unshaded) · 0% chance over 30 yrs
- Wildfire 1/10 Low
- Heat 6/10 Major 7 d/yr ≥101°F today · 15 d/yr by 30 yrs out
- Wind 6/10 Major 27% chance of damaging wind over 30 yrs
- Air quality 4/10 Moderate 6 unhealthy d/yr today · 7 by 30 yrs out
Nearby sold comps map
Loading sold comps map…
Walkable amenities ~0.75 mi
Loading nearby amenities…
Taxation est. · year 1
- Rental income
- $33,463
- − Mortgage interest
- −$14,004
- − Property taxes
- −$5,203
- − Insurance
- −$1,250
- − Repairs & maintenance
- −$2,677
- − Management
- −$2,677
- − Depreciation
- −$7,273
- Taxable income
- $379
- Est. tax owed @ 24.0%
- −$91
- After-tax cash flow
- $4,159/yr
For passive investors: Depreciation is non-cash, so a rental often shows a tax loss while cash-flowing — sheltering income. Rental losses are passive: they offset passive income freely, and up to $25,000/yr can offset ordinary (W-2) income if you actively participate and your MAGI is under $100k (phasing out to $0 by $150k); unused losses carry forward. On sale, claimed depreciation is recaptured at up to 25%, and gains may owe capital-gains tax (a 1031 exchange can defer both). Figures are a year-1 estimate at your 24.0% rate — not tax advice; consult a CPA.
Schools (NCES district)
- District
- Lawrence Township Public School District
- NCES district ID
- 3408400
- Math proficiency
- 24% ▼ -20.00%
- Reading proficiency
- 52% ▼ -7.00%
- Median HH income
- $89,210
- Composite
- 36.47/100
- National rank
- #4661
- State rank
- #217 of 472 in NJ
Livability — Trenton
- Score
- 76/100
- State rank
- #133
- US rank
- #3533
Category grades
Schools grade is shown separately in the Schools card above.
Census & demographics
- County
- Mercer County · 327,655 people
- City population
- 177,819
- Metro
- Trenton-Princeton, NJ
- Population (ZIP)
- 31,323
- Household income
- $125,514
- Rent vs Own
- Severe rent burden
- 724.0
Population outlook (Mercer County) Hauer SSP2
- Today (2025)
- 381,395 people
- By 2030
- 384,640 · +0.9%
- By 2040
- 391,431 · +2.6%
- By 2050
- 397,845 · +4.3%
- By 2075
- 417,281 · +9.4%
- By 2100
- 420,327 · +10.2%
Race, ethnicity, and origin ACS 2023
- Neighborhood character
- Diverse neighborhood (Simpson 0.63)
- Race & ethnicity
- White 56% Hispanic / Latino 16% Asian 14% Black 12% Two or more races 9%
- Hispanic origin (detail)
- Mexican 2% Puerto Rican 1% Dominican 1%
- Common ancestry
- Romanian 10% Scotch-Irish 2% Italian 1%
- Foreign-born
- 26% · Canada, China, South Korea
- Languages at home
- 66% English-only · Spanish 12% Other Indo-European 6% Russian/Polish/Slavic 6%
Political lean MEDSL · Mercer
- 2024 margin
- Solid D (+33.9) · D 65.9% · R 32.0% · Other 2.1%
- 2008→2024 swing
- -2.2pp toward R · 2008: 36.1pp · 2024: 33.9pp
- All cycles
- 2024: D+33.9 2020: D+40.0 2016: D+36.2 2012: D+36.8 2008: D+36.1
Not yet ingested
- Civics
- —
Market trends
- HPI YoY
- ▼ -323.66%
- Current HPI
- 260.9615
- Rent YoY
- ▬ -0.01%
- Metro
- Trenton-Princeton, NJ
- State GDP YoY
- ▲ 2.05%
- F500 in state
- 34
Industry mix (Fortune 500 HQ in NJ)
| Industry | F500 HQs | Revenue |
|---|---|---|
| Consumer Goods | 3 | $31B |
|
||
| Pharmaceuticals | 2 | $153B |
|
||
| Technology | 2 | $21B |
|
||
| Insurance | 2 | $20B |
|
||
| Healthcare | 2 | $19B |
|
||
| Financial Services | 1 | $70B |
|
||
Price history
+0.0% since first listed3 events — show timeline
- 2026-04-29 Contingent — BRIGHT MLS
- 2026-04-17 Listed $250,000 BRIGHT MLS
- 2026-04-16 Coming Soon $250,000 BRIGHT MLS
Property tax history
+1.3%/yrLatest (2025): $5,203 · +2.2% YoY. Source: county tax records.
Cash-flow waterfall
monthlySold comps — $/sqft
last 12 mo · ≤1 miLoading sold comps…