 🏗️ New Construction
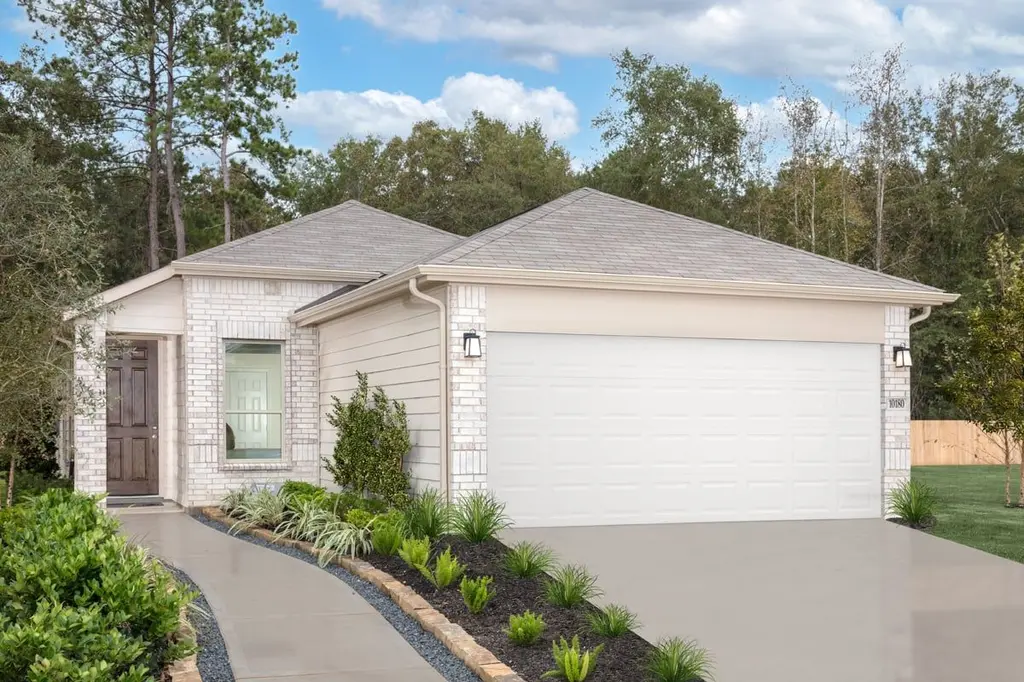
Plan 1242 Plan · Conroe, TX
Flood risk No data
- FEMA flood zone
- —
- Chance of flooding over 30 yrs
- —
- Est. flood insurance / yr
- —
Fire risk No data
- Est. fire insurance / yr
- —
Heat risk No data
- Hot days now (above threshold)
- —
- Hot days in 30 yrs
- —
Wind risk No data
- Chance of severe wind over 30 yrs
- —
Air-quality risk No data
- Unhealthy air days now
- —
- Unhealthy air days in 30 yrs
- —
Risk factors via First Street. Map © Google.
Why this score? — see what drove the F grade
The composite is a weighted blend of 9 inputs, each scored 0–100. Each bar is that input's sub-score; the figure is the points it added to the 100-point composite (weight × sub-score).
- ARV discount +7.5/15.0
- Cash flow +7.4/30.0
- Condition / age +4.0/5.0
- Livability +3.7/5.0
- Schools +3.2/10.0
- 1% rule +2.1/10.0
- Rent growth +2.1/5.0
- DSCR +1.6/10.0
- Appreciation +0.0/10.0
$198,995
🖨 Deal sheet (PDF) 📄 Offer letter ✓ Due diligence
Listing remarks MLS
* Stainless steel appliances with 2-yr. warranty * Gas range * Tile flooring at wet areas * Open floor plan * Large closets throughout * Water-conserving front and rear yard sod to fence * Granite kitchen countertops * Kitchen tile backsplash * Kitchen USB charging port * Smart thermostat * WaterSense® labeled faucets * ENERGY STAR® certified home * Playground * Parks * Near local schools * Commuter-friendly location * Great shopping nearby * Outdoor recreation nearby
Key facts
- 2 garage spots
- Listed 86 days
Neighborhood map
What this means for you Summary
Snapshot
- This is a 3-bed/2.0-bath single-family listed at $199k. Condition is rated good.
Deal economics
- At list price, monthly cash flow is $-328 ($-4k/yr) — negative.
- The deal already cash-flows at list — no discount required.
- To meet the 1% rule (rent ≥ 1% of price), the offer needs to be $184k (7.6% below list).
- Recommended offer: $184k (7.6% below list) — sets the bar for 1% rule.
- Cap rate 4.8% vs local median 3.1% in Conroe — top-decile yield for the area; either an underpriced asset or a hidden risk that comps aren't pricing in. Stress-test before assuming the spread holds.
Location & tenants
- Location reads 74/100 on livability (#169 in TX, #4,447 nationally) — a middle-class / working-renter tenant base. Strengths: cost of living A+, housing A+, amenities B; Watch: commute F, health & safety F.
- Willis ISD (rural): math 33% / reading 40% proficiency, ranked #458 of 826 in TX (top 55%) — families likely to look elsewhere, expect single-tenant / working-renter base with shorter leases.
- Zoned schools: Turner El (math 55% / reading 53%, grade C, #664 of 4,322 statewide, top 16%, 424 students, 66% FRL); Robert P Brabham Middle (math 33% / reading 41%, grade F, #756 of 1,662 statewide, top 47%, 1,117 students, 52% FRL); Willis H S (math 19% / reading 46%, grade F, #1,029 of 1,632 statewide, top 64%, 2,521 students, 57% FRL) — zoned schools at 58% FRL track the district average.
- Market conditions: Rents soft (-1.6%/yr); 756 active listings in the ZIP; 23 comparable units currently listed for rent nearby; rentals leasing fast (median 12d on market — plan ~1-2 weeks tenant-placement turnaround); solid renter incomes; 13,259 units permitted in Montgomery County in 2024 (1,402 in 5+ unit buildings).
Forward outlook
- Local home prices are declining (-3.0%/yr); year-one equity from $2k of loan paydown is wiped out by about $8k of value loss. Plan a longer hold.
- Montgomery County population projected at +65% by 2050 — long-run rental-demand tailwind backs the buy-and-hold thesis.
Negotiation context
- It's been on market 87 days — a 6% lower offer ($187k) is reasonable based on typical stale-listing flexibility.
Questions for the listing agent
- What do current leases actually rent for vs. the listed asking? Can we see a recent rent roll and the last 12 months of T-12 income?
- It's been on market 87 days. Have you received any prior offers? Is the seller open to a 8% concession, seller financing, or rate buy-down credit?
- Why hasn't it sold? Are there any deal-killer items the seller is aware of (foundation, flood, title, zoning, code violations)?
- Is there a deadline driving the sale (1031 exchange, divorce, estate, relocation)? That informs how much negotiation room exists.
- Schools are D-rated, which usually means shorter tenancies and higher turnover. Who's the typical renter profile here, and what's been the actual vacancy rate?
- The area grade is low — what's the realistic commute time and amenity access for the typical tenant pool here? Any planned neighborhood developments (good or bad) we should know about?
- What's the average days-on-market for RENTAL listings here right now (not sales)? A rising rental-DOM trend means longer vacancies and softer asking-rent achievability than the comps imply.
- What's the recent tenant-quality profile in this submarket — average credit score on applications, eviction rate, late-payment / NSF rate, and stable-employment percentage? A property-management company in the area should have these aggregated.
- How much new for-sale + rental construction is in the pipeline within 1–3 miles? Heavy new supply typically softens prices + rents 12–24 months out; constrained supply supports both.
Investment metrics
- 1% rule
- 0.71% ✗
- Cap rate
- 4.77%
- Cash-on-cash
- -5.46%
- DSCR
- 0.76
- GRM
- 11.7
CMA / ARV
- ARV (median comp)
- $257,581
- List price
- $198,995
- Delta
- -22.74%
- Verdict
- UNDERPRICED
- Comps
- 20 within 1.0 mi
Show comp detail 12 sales within ~0.75 mi
| Address | Dist | Beds/Ba | Sqft | Sold | Price | $/sf | Match |
|---|---|---|---|---|---|---|---|
| 6642 Lahna Oak | 0.47mi | 3/2.0 | 1,287 (+4%) | 1mo | $237,690 | $185 | 71 |
| 6813 Hart Oak Ct | 0.51mi | 3/2.0 | 1,287 (+4%) | 3mo | $225,440 | $175 | 68 |
| 1663 Shae Oak Ln | 0.63mi | 3/2.0 | 1,287 (+4%) | 6mo | $229,690 | $178 | 60 |
| 6634 Lahna Oak | 0.47mi | 3/2.0 | 1,414 (+14%) | 0mo | $254,690 | $180 | 55 |
| 6654 Lahna Oak Dr | 0.47mi | 3/2.0 | 1,414 (+14%) | 1mo | $264,540 | $187 | 54 |
| 6662 Lahna Oak Dr | 0.48mi | 3/2.0 | 1,414 (+14%) | 1mo | $279,490 | $198 | 54 |
| 6626 Lahna Oak | 0.47mi | 3/2.0 | 1,414 (+14%) | 3mo | $259,540 | $184 | 53 |
| 6801 Hart Oak Ct | 0.49mi | 3/2.0 | 1,414 (+14%) | 4mo | $249,090 | $176 | 51 |
| 1662 Shae Oak Ln | 0.63mi | 3/2.0 | 1,414 (+14%) | 2mo | $229,670 | $162 | 46 |
| 6717 Chinapkin Oak Ln | 0.55mi | 3/2.0 | 1,414 (+14%) | 7mo | $245,495 | $174 | 46 |
| 1639 Shae Oak Ln | 0.59mi | 3/2.0 | 1,414 (+14%) | 7mo | $260,540 | $184 | 44 |
| 1928 Velvet Oak Ln | 0.66mi | 3/2.0 | 1,414 (+14%) | 5mo | $263,145 | $186 | 42 |
Match score weights: distance 35% · size 25% · config 20% · recency 20%. Top-matched comps best support the ARV.
Projected returns pro-forma
-3.0% appreciation · 0.0% rent growth · sell at horizon
- IRR
- -29.0%
- Equity multiple
- 0.06×
- Total profit
- $-67,985
- Equity at exit
- $38,406
- IRR
- -46.9%
- Equity multiple
- -0.48×
- Total profit
- $-106,801
- Equity at exit
- $22,271
Cash invested: $72,123 (down + closing). Projections, not guarantees.
Landlord ↔ Tenant lean methodology
- Overall (STATE)
- 87 Strongly Landlord-Friendly
- State Texas
- 87 Strongly Landlord-Friendly · R+5
- County
- — inherits STATE
- City
- — inherits STATE
ZIP-level market 77304
- Home prices YoY
- -29.3%
- Rents YoY
- -1.6%
- Active inventory
- 756
- Price-to-rent
- 9.0×
Monthly cashflow live
- Estimated rent
- $1,838 high interval (Pro) →
- Mortgage (P&I)
- −$1,351
- Tax est. 1.5%
- −$322 /mo · $3,864/yr
- Insurance
- −$107
- HOA
- −$0
- Vacancy / Maint / Mgmt
- −$386
- Net cashflow
- $-328
Break-even live
Sensitivity live
| Price | -10% $-150 | -5% $-239 | +0% $-328 | +5% $-417 | +10% $-506 |
|---|---|---|---|---|---|
| Rent | -10% $-473 | -5% $-401 | +0% $-328 | +5% $-255 | +10% $-183 |
| Rate | -1.0pp $-198 | -0.5pp $-262 | base $-328 | +0.5pp $-395 | +1.0pp $-463 |
UW: 25.0% down · 7.5% · 30yr · 1.5% tax · 5.0% vac · 8.0% maint · 8.0% mgmt
Financing live
Cash to close
- Down payment
- $64,395
- Closing costs
- $7,727
- Reserves months
- —
- Total cash needed
- —
Loan-product check · same deal, 3 products live
Conventional
25% down · 7.5% · 30yr
- Down + closing
- —
- Monthly P&I
- —
- Monthly cashflow
- —
- DSCR
- —
- Eligible?
- —
Personal DTI + credit; lowest rate.
DSCR
20% down · 8.5% · 30yr
- Down + closing
- —
- Monthly P&I
- —
- Monthly cashflow
- —
- DSCR
- —
- Eligible?
- —
No personal income docs; deal must DSCR.
Hard money
10% down · 12.0% · 12mo
- Down + closing
- —
- Monthly P&I
- —
- Monthly cashflow
- —
- DSCR
- —
- Eligible?
- —
Short-term bridge; refi at stabilization.
Rent comps 23 comps
| Address | Beds | Baths | Sqft | Rent | $/sqft | DOM | Units | Dist |
|---|---|---|---|---|---|---|---|---|
| 1575 League Line Rd Conroe, TX | 1.0–2.0 | 1.0–2.0 | 935 | $1,786 | $1.91 | 0d | 16 | 0.63mi |
| 1510 League Line Rd Conroe, TX | 1.0–3.0 | 1.0–2.0 | 1089 | $2,248 | $2.06 | 0d | 16 | 0.69mi |
| 1560 League Line Rd Unit 1617 Conroe, TX | 2.0 | 2.0 | 1060 | $1,554 | $1.47 | 12d | 1 | 0.78mi |
| 1560 League Line Rd Unit 1583 Conroe, TX | 2.0 | 2.0 | 1123 | $2,014 | $1.79 | 14d | 1 | 0.78mi |
| 1560 League Line Rd Unit 3174 Conroe, TX | 3.0 | 2.0 | 1442 | $2,145 | $1.49 | 12d | 1 | 0.78mi |
| 1560 League Line Rd Unit 2174 Conroe, TX | 2.0 | 2.0 | 1123 | $1,981 | $1.76 | 18d | 1 | 0.78mi |
| 1560 League Line Rd Unit 1593 Conroe, TX | 3.0 | 2.0 | 1313 | $2,250 | $1.71 | 45d | 1 | 0.78mi |
| 1560 League Line Rd Unit 2228 Conroe, TX | 2.0 | 2.0 | 1060 | $1,514 | $1.43 | 0d | 1 | 0.78mi |
| 1560 League Line Rd Unit 1597 Conroe, TX | 2.0 | 2.0 | 1123 | $2,014 | $1.79 | 45d | 1 | 0.78mi |
| 1560 League Line Rd Unit 3228 Conroe, TX | 3.0 | 2.0 | 1442 | $2,105 | $1.46 | 0d | 1 | 0.78mi |
| 1560 League Line Rd Conroe, TX | 1.0–2.0 | 1.0–2.0 | 869 | $2,045 | $2.35 | 22d | 5 | 0.82mi |
| 800 N Farm to Market 3083 Rd W Unit 2047 Conroe, TX | 2.0 | 2.0 | 1151 | $1,550 | $1.35 | 12d | 1 | 0.90mi |
| 800 N Farm to Market 3083 Rd W Unit 837 Conroe, TX | 2.0 | 2.0 | 1151 | $1,539 | $1.34 | 12d | 1 | 0.96mi |
| 800 N Farm to Market 3083 Rd W Unit 857 Conroe, TX | 2.0 | 2.0 | 1078 | $1,494 | $1.39 | 45d | 1 | 0.96mi |
| 800 N Farm to Market 3083 Rd W Unit 3174 Conroe, TX | 3.0 | 2.0 | 1281 | $1,975 | $1.54 | 12d | 1 | 0.96mi |
| 800 N Farm to Market 3083 Rd W Unit 3228 Conroe, TX | 3.0 | 2.0 | 1281 | $1,935 | $1.51 | 0d | 1 | 0.96mi |
| 800 N Farm to Market 3083 Rd W Unit 2162 Conroe, TX | 2.0 | 2.0 | 1151 | $1,515 | $1.32 | 9d | 1 | 0.96mi |
| 800 N Farm to Market 3083 Rd W Unit 2228 Conroe, TX | 2.0 | 2.0 | 1151 | $1,499 | $1.30 | 0d | 1 | 0.96mi |
| 800 N Farm to Market 3083 Rd W Unit 2174 Conroe, TX | 2.0 | 2.0 | 1151 | $1,540 | $1.34 | 0d | 1 | 0.96mi |
| 800 N Farm to Market 3083 Rd W Unit 833 Conroe, TX | 3.0 | 2.0 | 1281 | $2,197 | $1.72 | 45d | 1 | 0.96mi |
| 2507 N Frazier St Unit 122528 Conroe, TX | 2.0 | 2.0 | 1326 | $1,252 | $0.94 | 45d | 1 | 1.08mi |
| 309 Woodland Hills Dr Conroe, TX | 3.0 | 2.0 | 1248 | $1,549 | $1.24 | 45d | 1 | 1.13mi |
| 2400 Montgomery Park Blvd Conroe, TX | 1.0–3.0 | 1.0–2.0 | 1265 | $2,784 | $2.20 | 0d | 47 | 1.37mi |
Listing history 17 events
-
2026-06-21days on market $198,995 Active 87 DOM
-
2026-06-18days on market $198,995 Active 84 DOM
-
2026-06-17days on market $198,995 Active 83 DOM
-
2026-06-16days on market $198,995 Active 82 DOM
-
2026-06-15days on market $198,995 Active 81 DOM
-
2026-06-13days on market $198,995 Active 79 DOM
-
2026-06-09days on market $198,995 Active 75 DOM
-
2026-06-08days on market $198,995 Active 74 DOM
-
2026-06-07days on market $198,995 Active 73 DOM
-
2026-06-04days on market $198,995 Active 70 DOM
-
2026-06-03days on market $198,995 Active 69 DOM
-
2026-06-02days on market $198,995 Active 68 DOM
-
2026-06-01days on market $198,995 Active 67 DOM
-
2026-05-31pricedays on market $198,995 Active 66 DOM
-
2026-05-01price $207,995 515-char remark
Show marketing remark (515 chars)
* Stainless steel appliances with 2-yr. warranty * Gas range * Tile flooring at wet areas * Open floor plan * Large closets throughout * Water-conserving front and rear yard sod to fence * Granite kitchen countertops * Kitchen tile backsplash * Kitchen USB charging port * Smart thermostat * WaterSense® labeled faucets * ENERGY STAR® certified home * Playground * Parks * Near local schools * Commuter-friendly location * Great shopping nearby * Outdoor recreation nearby
-
2026-04-07price $217,995 515-char remark
Show marketing remark (515 chars)
* Stainless steel appliances with 2-yr. warranty * Gas range * Tile flooring at wet areas * Open floor plan * Large closets throughout * Water-conserving front and rear yard sod to fence * Granite kitchen countertops * Kitchen tile backsplash * Kitchen USB charging port * Smart thermostat * WaterSense® labeled faucets * ENERGY STAR® certified home * Playground * Parks * Near local schools * Commuter-friendly location * Great shopping nearby * Outdoor recreation nearby
-
2026-03-27$227,995 Active 515-char remark
Show marketing remark (515 chars)
* Stainless steel appliances with 2-yr. warranty * Gas range * Tile flooring at wet areas * Open floor plan * Large closets throughout * Water-conserving front and rear yard sod to fence * Granite kitchen countertops * Kitchen tile backsplash * Kitchen USB charging port * Smart thermostat * WaterSense® labeled faucets * ENERGY STAR® certified home * Playground * Parks * Near local schools * Commuter-friendly location * Great shopping nearby * Outdoor recreation nearby
ⓘ Source: listings_history table (triggers on properties + properties_extension) + one-shot
backfill from property_details.listing_events for pre-trigger history.
Nearby sold comps map
Loading sold comps map…
Walkable amenities ~0.75 mi
Loading nearby amenities…
Taxation est. · year 1
- Rental income
- $22,058
- − Mortgage interest
- −$14,429
- − Property taxes
- −$3,864
- − Insurance
- −$1,288
- − Repairs & maintenance
- −$1,765
- − Management
- −$1,765
- − Depreciation
- −$7,493
- Taxable loss
- −$8,545
- Est. tax savings @ 24.0%
- +$2,051
- After-tax cash flow
- $-1,885/yr
For passive investors: Depreciation is non-cash, so a rental often shows a tax loss while cash-flowing — sheltering income. Rental losses are passive: they offset passive income freely, and up to $25,000/yr can offset ordinary (W-2) income if you actively participate and your MAGI is under $100k (phasing out to $0 by $150k); unused losses carry forward. On sale, claimed depreciation is recaptured at up to 25%, and gains may owe capital-gains tax (a 1031 exchange can defer both). Figures are a year-1 estimate at your 24.0% rate — not tax advice; consult a CPA.
Condition & rehab AI · 12 photos
This home is in excellent condition with modern amenities and a well-maintained exterior. It offers a great location with nearby playgrounds and parks, making it an attractive option for families and investors.
Value-add opportunities
- Both Playground and parks — Improves quality of life and adds value for families.
- Both Smart thermostat — Enhances comfort and energy efficiency, attracting buyers and renters.
- Both Smart home features — Attracts tech-savvy buyers and renters, increasing desirability and value.
- Both Landscaping improvements — Enhances curb appeal and adds value for both resale and rental markets.
Renovation cost estimate screening
Value-add ROI direction
- Both Playground and parks — Improves quality of life and adds value for families. ↑
- Both Smart thermostat — Enhances comfort and energy efficiency, attracting buyers and renters. ↑
- Both Smart home features — Attracts tech-savvy buyers and renters, increasing desirability and value. ↑
- Both Landscaping improvements — Enhances curb appeal and adds value for both resale and rental markets. ↑
ⓘ Cost ranges are severity-bucket heuristics (US national rule-of-thumb). Get contractor quotes + a written scope before underwriting a rehab budget.
Schools (NCES district)
- District
- Willis ISD
- NCES district ID
- 4845900
- Math proficiency
- 33% ▼ -15.00%
- Reading proficiency
- 40% ▼ -2.00%
- Median HH income
- $57,828
- Composite
- 32.32/100
- National rank
- #5746
- State rank
- #458 of 826 in TX
Livability — Conroe
- Score
- 74/100
- State rank
- #169
- US rank
- #4447
Category grades
Schools grade is shown separately in the Schools card above.
Census & demographics
- Census place
- Conroe, TX
- County
- Montgomery County · 663,713 people
- City population
- 205,417
- Metro
- Houston-The Woodlands-Sugar Land, TX
- Population (ZIP)
- 44,225
- Household income
- $80,425
- Rent vs Own
- Severe rent burden
- 2233.0
Population outlook (Montgomery County) Hauer SSP2
- Today (2025)
- 713,896 people
- By 2030
- 805,263 · +12.8%
- By 2040
- 992,708 · +39.1%
- By 2050
- 1,179,590 · +65.2%
- By 2075
- 1,628,084 · +128.1%
- By 2100
- 1,937,880 · +171.5%
Race, ethnicity, and origin ACS 2023
- Neighborhood character
- Predominantly White (67%)
- Race & ethnicity
- White 67% Hispanic / Latino 16% Black 11% Two or more races 8% Asian 4%
- Hispanic origin (detail)
- Mexican 12%
- Common ancestry
- Lithuanian 4% Italian 2% Romanian 2%
- Foreign-born
- 10% · Canada, Vietnam
- Languages at home
- 85% English-only · Spanish 10% Other Indo-European 1% Tagalog/Filipino 1%
Political lean MEDSL · Montgomery
- 2024 margin
- Solid R (+45.5) · D 26.8% · R 72.3%
- 2008→2024 swing
- +7.2pp toward D · 2008: -52.7pp · 2024: -45.5pp
- All cycles
- 2024: R+45.5 2020: R+43.8 2016: R+51.4 2012: R+60.7 2008: R+52.7
Not yet ingested
- Civics
- —
Market trends
- HPI YoY
- ▼ -87.02%
- Current HPI
- 209.516
- Rent YoY
- ▼ -1.65%
- Metro
- Houston-The Woodlands-Sugar Land, TX
- State GDP YoY
- ▲ 3.95%
- F500 in state
- 110
Industry mix (Fortune 500 HQ in TX)
| Industry | F500 HQs | Revenue |
|---|---|---|
| Energy | 16 | $1,198B |
|
||
| Technology | 5 | $198B |
|
||
| Engineering / Construction | 4 | $72B |
|
||
| Energy Services | 3 | $60B |
|
||
| Utilities | 3 | $41B |
|
||
| Healthcare | 2 | $330B |
|
||
Price history
-8.8% since first listed3 events — show timeline
- 2026-05-01 Price Changed $207,995 Zillow
- 2026-04-07 Price Changed $217,995 Zillow
- 2026-03-27 Listed $227,995 Zillow
Cash-flow waterfall
monthlySold comps — $/sqft
last 12 mo · ≤1 miLoading sold comps…