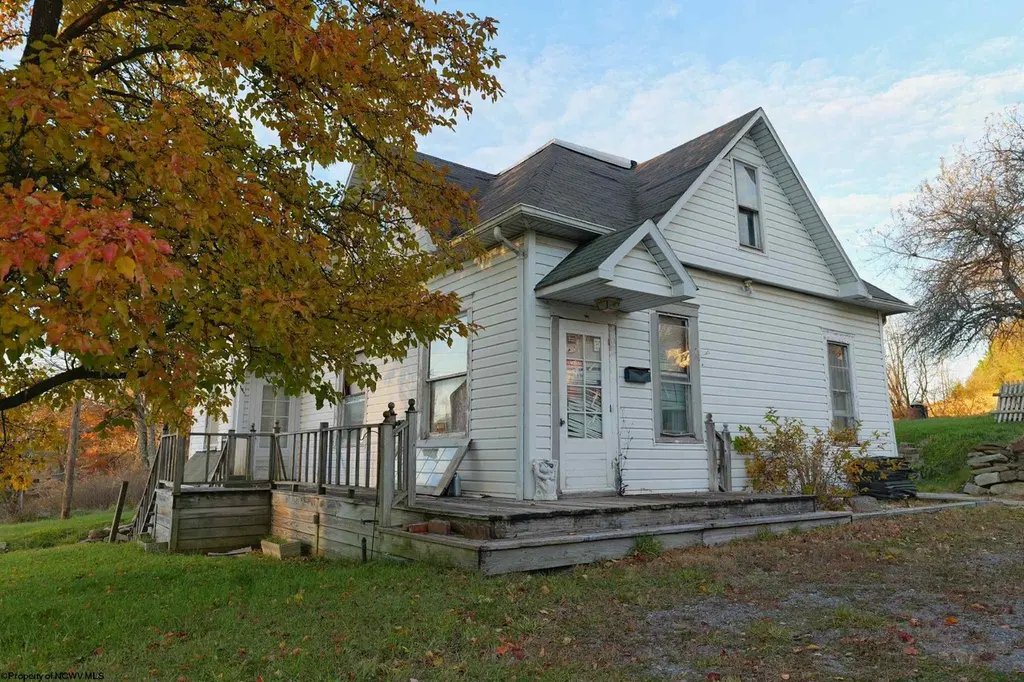
603 W State Ave · Terra Alta, WV
Flood risk No data
- FEMA flood zone
- —
- Chance of flooding over 30 yrs
- —
- Est. flood insurance / yr
- —
Fire risk No data
- Est. fire insurance / yr
- —
Heat risk No data
- Hot days now (above threshold)
- —
- Hot days in 30 yrs
- —
Wind risk No data
- Chance of severe wind over 30 yrs
- —
Air-quality risk No data
- Unhealthy air days now
- —
- Unhealthy air days in 30 yrs
- —
Risk factors via First Street. Map © Google.
Why this score? — see what drove the A- grade
The composite is a weighted blend of 9 inputs, each scored 0–100. Each bar is that input's sub-score; the figure is the points it added to the 100-point composite (weight × sub-score).
- Cash flow +30.0/30.0
- ARV discount +15.0/15.0
- 1% rule +10.0/10.0
- DSCR +10.0/10.0
- Appreciation +5.9/10.0
- Livability +3.1/5.0
- Rent growth +2.5/5.0
- Condition / age +2.5/5.0
- Schools +2.4/10.0
$89,000
🖨 Deal sheet 📄 Offer letter ✓ Due diligence
Listing remarks
No zoning—flexible for residential, commercial, or mixed-use potential. Located along Route 7 in Terra Alta, this property includes two parcels within town limits, each with public water, sewer, and electric available. One parcel features a home built in the early 1980s, being sold as-is to cash buyers only. The home offers large rooms, a solid structure, and attractive wood accents, but will require significant renovation. With good visibility and convenient access along Route 7, the setting supports a variety of possible uses depending on buyer needs and town requirements. A versatile opportunity in a convenient location.
Key facts
- Easy access
- Public sewer
- Excellent visibility
Tags
Property features AI
Exterior
- Parking: Off-street parking; On-street parking
- Utilities: Public water; Public sewer
- Home design: Detached single-family residence; 2 stories
- Construction: Below-grade finished area present
- Exterior features: Corner lot; Sloped lot; Shingle roof
Interior
- Flooring: Wood
- Bathrooms: 1 full bathroom
- Heating & cooling: No heating system listed
- Interior features: Wood flooring; Unfinished walk-out basement
Neighborhood map
What this means for you Summary
Snapshot
- This is a 3-bed/1.0-bath single-family listed at $89k.
Deal economics
- At list price, monthly cash flow is $1k ($14k/yr) — positive.
- The deal already cash-flows at list — no discount required.
- Meets the 1% rule at list price ($2k rent vs $89k).
- Recommended offer: $78k (12.0% below list) — sets the bar for market timing.
- Cap rate 22.0% vs local median 5.7% in Terra Alta — top-decile yield for the area; either an underpriced asset or a hidden risk that comps aren't pricing in. Stress-test before assuming the spread holds.
Location & tenants
- Location reads 61/100 on livability (#196 in WV) — a middle-class / working-renter tenant base. Strengths: crime A+, cost of living A+, housing A+; Watch: amenities F, commute F, employment F.
- Preston County Schools (rural): math 22% / reading 33% proficiency, ranked #39 of 55 in WV (top 71%) — low school quality limits family demand, transient renter base, plan for 1-2y turnover.
- Zoned schools: Terra Alta/East Preston School (math 20% / reading 29%, grade F, #287 of 377 statewide, top 85%, 310 students, 0% FRL); Preston High School (math 10% / reading 32%, grade F, #100 of 110 statewide, top 91%, 1,178 students, 0% FRL) — zoned schools average 0% FRL vs 43% district-wide (43 pts lower); this property's tenant base skews higher-income than the district average.
- Market conditions: 97 active listings in the ZIP; 2 units permitted in Preston County in 2024 (0 in 5+ unit buildings).
Forward outlook
- In year one you build about $2k of equity ($615 loan paydown + $2k appreciation (1.7% local appreciation)).
- Preston County population projected to shrink 5% by 2050 — rents likely to lag national; underwrite the cash flow, not the appreciation.
- At projected returns (1.7% appreciation + 3.0% rent growth), your $25k cash investment doubles in ~2 years — after that, you're playing with house money.
Negotiation context
- It's been on market 213 days — a 12% lower offer ($78k) is reasonable based on typical stale-listing flexibility.
- Current owner paid $28k; list at $89k implies a 218% gain — meaningful room to come down on a strong offer.
Questions for the listing agent
- It's been on market 213 days. Have you received any prior offers? Is the seller open to a 12% concession, seller financing, or rate buy-down credit?
- Why hasn't it sold? Are there any deal-killer items the seller is aware of (foundation, flood, title, zoning, code violations)?
- Is there a deadline driving the sale (1031 exchange, divorce, estate, relocation)? That informs how much negotiation room exists.
- Schools are F-rated, which usually means shorter tenancies and higher turnover. Who's the typical renter profile here, and what's been the actual vacancy rate?
- What's the average days-on-market for RENTAL listings here right now (not sales)? A rising rental-DOM trend means longer vacancies and softer asking-rent achievability than the comps imply.
- What's the recent tenant-quality profile in this submarket — average credit score on applications, eviction rate, late-payment / NSF rate, and stable-employment percentage? A property-management company in the area should have these aggregated.
- How much new for-sale + rental construction is in the pipeline within 1–3 miles? Heavy new supply typically softens prices + rents 12–24 months out; constrained supply supports both.
Investment metrics
- 1% rule
- 2.42% ✓
- Cap rate
- 22.04%
- Cash-on-cash
- 56.23%
- DSCR
- 3.50
- GRM
- 3.4
CMA / ARV
- ARV (on-the-fly)
- $161,616
- Comps found
- 4
Show comp detail 4 sales within ~0.75 mi
| Address | Dist | Beds/Ba | Sqft | Sold | Price | $/sf | Match |
|---|---|---|---|---|---|---|---|
| 303 E State Ave | 0.59mi | 2/1.0 (-1) | 1,449 (-0%) | 0mo | $162,900 | $112 | 66 |
| 111 Mayer | 0.18mi | 3/2.0 | 1,300 (-11%) | 19mo | $85,000 | $65 | 54 |
| 101 Richfield Ln | 0.66mi | 3/1.5 | 1,408 (-3%) | 20mo | $150,000 | $107 | 45 |
| 117 Sanders St | 0.61mi | 3/1.5 | 1,238 (-15%) | 14mo | $138,000 | $111 | 33 |
Match score weights: distance 35% · size 25% · config 20% · recency 20%. Top-matched comps best support the ARV.
Projected returns pro-forma
1.7% appreciation · 3.0% rent growth · sell at horizon
- IRR
- 59.8%
- Equity multiple
- 4.17×
- Total profit
- $79,112
- Equity at exit
- $33,674
- IRR
- 60.5%
- Equity multiple
- 8.43×
- Total profit
- $185,225
- Equity at exit
- $47,415
Cash invested: $24,920 (down + closing). Projections, not guarantees.
Landlord ↔ Tenant lean methodology
- Overall (STATE)
- 83 Strongly Landlord-Friendly
- State West Virginia
- 83 Strongly Landlord-Friendly · R+22
- County
- — inherits STATE
- City
- — inherits STATE
ZIP-level market 26764
- Home prices YoY
- 0.6%
- Active inventory
- 97
- Price-to-rent
- 3.4×
Monthly cashflow live
- Estimated rent
- $2,158 medium interval (Pro) →
- Mortgage (P&I)
- −$467
- Tax from tax record
- −$33 /mo · $397/yr
- Insurance
- −$37
- HOA
- −$0
- Vacancy / Maint / Mgmt
- −$453
- Net cashflow
- $1,168
Break-even live
UW: 25.0% down · 7.5% · 30yr · 1.5% tax · 5.0% vac · 8.0% maint · 8.0% mgmt
Financing live
Cash to close
- Down payment
- $22,250
- Closing costs
- $2,670
- Reserves months
- —
- Total cash needed
- —
Loan-product check · same deal, 3 products live
Conventional
25% down · 7.5% · 30yr
- Down + closing
- —
- Monthly P&I
- —
- Monthly cashflow
- —
- DSCR
- —
- Eligible?
- —
Personal DTI + credit; lowest rate.
DSCR
20% down · 8.5% · 30yr
- Down + closing
- —
- Monthly P&I
- —
- Monthly cashflow
- —
- DSCR
- —
- Eligible?
- —
No personal income docs; deal must DSCR.
Hard money
10% down · 12.0% · 12mo
- Down + closing
- —
- Monthly P&I
- —
- Monthly cashflow
- —
- DSCR
- —
- Eligible?
- —
Short-term bridge; refi at stabilization.
Listing history 19 events
-
2026-06-19days on market $89,000 Active 213 DOM
-
2026-06-18days on market $89,000 Active 212 DOM
-
2026-06-17days on market $89,000 Active 211 DOM
-
2026-06-16days on market $89,000 Active 210 DOM
-
2026-06-15days on market $89,000 Active 209 DOM
-
2026-06-14days on market $89,000 Active 207 DOM
-
2026-06-13days on market $89,000 Active 206 DOM
-
2026-06-10days on market $89,000 Active 204 DOM
-
2026-06-09days on market $89,000 Active 203 DOM
-
2026-06-08days on market $89,000 Active 202 DOM
-
2026-06-07days on market $89,000 Active 201 DOM
-
2026-06-03days on market $89,000 Active 197 DOM
-
2026-06-02days on market $89,000 Active 196 DOM
-
2026-06-01days on market $89,000 Active 195 DOM
-
2026-05-31days on market $89,000 Active 194 DOM
-
2026-05-30days on market $89,000 Active 193 DOM
-
2026-02-19price $89,000
-
2025-11-18$99,000 Active
-
1999-12-27soldstatus $28,000
ⓘ Source: listings_history table (triggers on properties + properties_extension) + one-shot
backfill from property_details.listing_events for pre-trigger history.
Tax reassessment forecast WV · Resets to sale price
- Current annual tax
- $397 · $33/mo
- Projected year-2 tax
- $525 · $44/mo
- Expected delta
- +$128/yr (+$11/mo · 32.3%)
ⓘ Screening estimate from a state-policy table — verify with the county assessor before closing.
Nearby sold comps map
Loading sold comps map…
Walkable amenities ~0.75 mi
Loading nearby amenities…
Taxation est. · year 1
- Rental income
- $25,892
- − Mortgage interest
- −$4,985
- − Property taxes
- −$397
- − Insurance
- −$445
- − Repairs & maintenance
- −$2,071
- − Management
- −$2,071
- − Depreciation
- −$2,589
- Taxable income
- $13,333
- Est. tax owed @ 24.0%
- −$3,200
- After-tax cash flow
- $10,812/yr
For passive investors: Depreciation is non-cash, so a rental often shows a tax loss while cash-flowing — sheltering income. Rental losses are passive: they offset passive income freely, and up to $25,000/yr can offset ordinary (W-2) income if you actively participate and your MAGI is under $100k (phasing out to $0 by $150k); unused losses carry forward. On sale, claimed depreciation is recaptured at up to 25%, and gains may owe capital-gains tax (a 1031 exchange can defer both). Figures are a year-1 estimate at your 24.0% rate — not tax advice; consult a CPA.
Schools (NCES district)
- District
- Preston County Schools
- NCES district ID
- 5401170
- Math proficiency
- 22% ▼ -8.00%
- Reading proficiency
- 33% ▼ -6.00%
- Median HH income
- $43,997
- Composite
- 23.51/100
- National rank
- #7869
- State rank
- #39 of 55 in WV
Livability — Terra Alta
- Score
- 61/100
- State rank
- #196
- US rank
- #17622
Category grades
Schools grade is shown separately in the Schools card above.
Census & demographics
- Census place
- Terra Alta, WV
- Population (ZIP)
- 4,349
Population outlook (Preston County) Hauer SSP2
- Today (2025)
- 33,786 people
- By 2030
- 33,618 · -0.5%
- By 2040
- 32,953 · -2.5%
- By 2050
- 32,131 · -4.9%
- By 2075
- 30,774 · -8.9%
- By 2100
- 27,037 · -20.0%
Race, ethnicity, and origin ACS 2023
- Neighborhood character
- Predominantly White (92%)
- Race & ethnicity
- White 92% Two or more races 7%
- Common ancestry
- Slovak 4% Italian 2% Lithuanian 2%
- Foreign-born
- 0%
Political lean MEDSL · Preston
- 2024 margin
- Solid R (+57.0) · D 20.5% · R 77.5% · Other 2.1%
- 2008→2024 swing
- -30.5pp toward R · 2008: -26.5pp · 2024: -57.0pp
- All cycles
- 2024: R+57.0 2020: R+55.1 2016: R+55.8 2012: R+44.4 2008: R+26.5
Not yet ingested
- Civics
- —
Market trends
- HPI YoY
- ▲ 1.70%
- Current HPI
- 294.2344
- Rent YoY
- —
- Metro
- —
- State GDP YoY
- —
- F500 in state
- 0
Price history
+217.9% since first listed3 events — show timeline
- 2026-02-19 Price Changed $89,000 NCWVREIN
- 2025-11-18 Listed $99,000 NCWVREIN
- 1999-12-27 Sold (Public Records) $28,000 Public Records
Property tax history
-2.1%/yrLatest (2025): $397 · -32.6% YoY. Source: county tax records.
Cash-flow waterfall
monthlySold comps — $/sqft
last 12 mo · ≤1 miLoading sold comps…