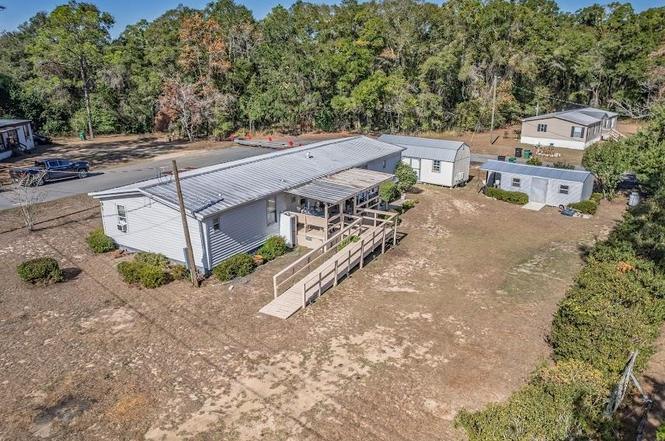
2540 Windy Pine Way · Tallahassee, FL
Flood risk 1/10 · Minimal
- FEMA flood zone
- X (unshaded)
- Chance of flooding over 30 yrs
- 0.0%
- Est. flood insurance / yr
- $507 – $1,088
Fire risk 5/10 · Moderate
- Est. fire insurance / yr
- $947 – $1,759
Heat risk 8/10 · Major
- Hot days now (above 108°F)
- 7 days/yr
- Hot days in 30 yrs
- 20 days/yr
Wind risk 9/10 · Severe
- Chance of severe wind over 30 yrs
- 99.0%
Air-quality risk 4/10 · Minor
- Unhealthy air days now
- 5 days/yr
- Unhealthy air days in 30 yrs
- 6 days/yr
Risk factors via First Street. Map © Google.
Why this score? — see what drove the B grade
The composite is a weighted blend of 9 inputs, each scored 0–100. Each bar is that input's sub-score; the figure is the points it added to the 100-point composite (weight × sub-score).
- Cash flow +30.0/30.0
- 1% rule +10.0/10.0
- DSCR +10.0/10.0
- ARV discount +7.5/15.0
- Schools +4.3/10.0
- Livability +4.3/5.0
- Rent growth +2.5/5.0
- Condition / age +2.5/5.0
- Appreciation +0.0/10.0
$120,000
🖨 Deal sheet (PDF) 📄 Offer letter ✓ Due diligence
Listing remarks
Make an offer! This property presents an excellent opportunity as a primary residence, rental, or flip. The home is structurally sound and ready for updating and repairs to unlock its full potential. Features include a small storage shed, a new gas range/oven, a new water heater in the primary bathroom, and a possible fourth bedroom offering flexible living space. Situated on private property, this home invites you to bring your vision and explore all the possibilities. Schedule a showing and see the potential for yourself.
Key facts
- Metal roof
- Central heat and air
- Ramp entrance
Tags
Property features AI
Finance
- Other: Property listed for sale
Exterior
- Parking: Driveway
- Home design: Double wide mobile home
- Construction: Vinyl siding
- Exterior features: Covered patio/porch; Deck; Porch; Public maintained paved road
Interior
- Kitchen: Cooktop; Oven; Range; Refrigerator; Icemaker
- Bedrooms: Bedroom 2 (15 x 15); Bedroom 3 (20 x 15)
- Flooring: Carpet; Laminate
- Bathrooms: 3 full bathrooms
- Heating & cooling: Central heating; Central air; Wall/window unit(s)
- Interior features: Handicap access; Split bedroom floor plan; Walk-in closet(s)
- Laundry & utility: Washer; Dryer; Utility room
Neighborhood map
What this means for you Summary
Snapshot
- This is a 3-bed/2.0-bath manufactured listed at $120k.
Deal economics
- At list price, monthly cash flow is $1k ($13k/yr) — positive.
- The deal already cash-flows at list — no discount required.
- Meets the 1% rule at list price ($2k rent vs $120k).
- Recommended offer: $106k (12.0% below list) — sets the bar for market timing.
- Cap rate 17.4% vs local median 4.2% in Tallahassee — top-decile yield for the area; either an underpriced asset or a hidden risk that comps aren't pricing in. Stress-test before assuming the spread holds.
Location & tenants
- Location reads 86/100 on livability (#19 in FL, #429 nationally) — a professional / high-income tenant draw. Strengths: amenities A+, commute A+, health & safety A+; Watch: employment D.
- Leon (urban): math 48% / reading 53% proficiency, ranked #33 of 73 in FL (top 45%) — acceptable for families but not a draw, mixed tenant base, ~2y average lease.
- Market conditions: 105 active listings in the ZIP; 2 comparable units currently listed for rent nearby; 1,765 units permitted in Leon County in 2024 (975 in 5+ unit buildings).
- At $2,303/mo this rent would consume 58% of the median local household income ($48k/yr) (locally 654% of renters already pay >50% of income on rent) — very limited rent-growth headroom before tenants either downsize or default.
Forward outlook
- Local home prices are declining (-3.0%/yr); year-one equity from $830 of loan paydown is wiped out by about $4k of value loss. Plan a longer hold.
- Leon County population projected at +23% by 2050 — long-run rental-demand tailwind backs the buy-and-hold thesis.
- At projected returns (-3.0% appreciation + 3.0% rent growth), your $34k cash investment doubles in ~3 years — after that, you're playing with house money.
Negotiation context
- It's been on market 212 days — a 12% lower offer ($106k) is reasonable based on typical stale-listing flexibility.
- 2 sale attempts; this cycle's ask has dropped $40k (25%) from the opening price — seller is motivated, your offer sets the floor, not the list.
- Current owner paid $47k; list at $120k implies a 155% gain — meaningful room to come down on a strong offer.
Risks & watch-outs
- Climate carrying-cost: severe wind risk, 99% chance of damaging wind over 30y; moderate wildfire risk; extreme-heat days projected 7→20/yr by 2055 (HVAC capex compounding) — expect insurance premiums to compound above CPI over the hold.
Questions for the listing agent
- It's been on market 212 days. Have you received any prior offers? Is the seller open to a 12% concession, seller financing, or rate buy-down credit?
- Why hasn't it sold? Are there any deal-killer items the seller is aware of (foundation, flood, title, zoning, code violations)?
- Is there a deadline driving the sale (1031 exchange, divorce, estate, relocation)? That informs how much negotiation room exists.
- Schools are B-rated — typically a magnet for longer-tenancy family renters. What's the average tenant stay here, and is there a school-zone premium baked into asking?
- What's the average days-on-market for RENTAL listings here right now (not sales)? A rising rental-DOM trend means longer vacancies and softer asking-rent achievability than the comps imply.
- What's the recent tenant-quality profile in this submarket — average credit score on applications, eviction rate, late-payment / NSF rate, and stable-employment percentage? A property-management company in the area should have these aggregated.
- How much new for-sale + rental construction is in the pipeline within 1–3 miles? Heavy new supply typically softens prices + rents 12–24 months out; constrained supply supports both.
Investment metrics
- 1% rule
- 1.92% ✓
- Cap rate
- 17.41%
- Cash-on-cash
- 39.71%
- DSCR
- 2.77
- GRM
- 4.3
CMA / ARV
No comps found within radius.
Projected returns pro-forma
-3.0% appreciation · 3.0% rent growth · sell at horizon
- IRR
- 36.0%
- Equity multiple
- 2.53×
- Total profit
- $51,337
- Equity at exit
- $17,892
- IRR
- 42.7%
- Equity multiple
- 5.04×
- Total profit
- $135,735
- Equity at exit
- $10,375
Cash invested: $33,600 (down + closing). Projections, not guarantees.
Landlord ↔ Tenant lean methodology
- Overall (STATE)
- 87 Strongly Landlord-Friendly
- State Florida
- 87 Strongly Landlord-Friendly · R+3
- County
- — inherits STATE
- City
- — inherits STATE
ZIP-level market 32305
- Home prices YoY
- -22.5%
- Active inventory
- 105
- Price-to-rent
- 4.3×
Monthly cashflow live
- Estimated rent
- $2,303 medium interval (Pro) →
- Mortgage (P&I)
- −$629
- Tax from tax record
- −$28 /mo · $336/yr
- Insurance
- −$50
- HOA
- −$0
- Vacancy / Maint / Mgmt
- −$484
- Net cashflow
- $1,112
Break-even live
Sensitivity live
| Price | -10% $1,180 | -5% $1,146 | +0% $1,112 | +5% $1,078 | +10% $1,044 |
|---|---|---|---|---|---|
| Rent | -10% $930 | -5% $1,021 | +0% $1,112 | +5% $1,203 | +10% $1,294 |
| Rate | -1.0pp $1,172 | -0.5pp $1,142 | base $1,112 | +0.5pp $1,081 | +1.0pp $1,049 |
UW: 25.0% down · 7.5% · 30yr · 1.5% tax · 5.0% vac · 8.0% maint · 8.0% mgmt
Financing live
Cash to close
- Down payment
- $30,000
- Closing costs
- $3,600
- Reserves months
- —
- Total cash needed
- —
Loan-product check · same deal, 3 products live
Conventional
25% down · 7.5% · 30yr
- Down + closing
- —
- Monthly P&I
- —
- Monthly cashflow
- —
- DSCR
- —
- Eligible?
- —
Personal DTI + credit; lowest rate.
DSCR
20% down · 8.5% · 30yr
- Down + closing
- —
- Monthly P&I
- —
- Monthly cashflow
- —
- DSCR
- —
- Eligible?
- —
No personal income docs; deal must DSCR.
Hard money
10% down · 12.0% · 12mo
- Down + closing
- —
- Monthly P&I
- —
- Monthly cashflow
- —
- DSCR
- —
- Eligible?
- —
Short-term bridge; refi at stabilization.
Rent comps 2 comps
| Address | Beds | Baths | Sqft | Rent | $/sqft | DOM | Units | Dist |
|---|---|---|---|---|---|---|---|---|
| 2506 Sir Williams St Tallahassee, FL | 3.0 | 2.0 | 1662 | $2,050 | $1.23 | 21d | 1 | 1.09mi |
| 3111 Rackley Dr Tallahassee, FL | 4.0 | 2.5 | 1802 | $3,800 | $2.11 | 21d | 1 | 1.38mi |
Listing history 21 events
-
2026-06-18days on market $120,000 Active 212 DOM
-
2026-06-17days on market $120,000 Active 211 DOM
-
2026-06-16days on market $120,000 Active 210 DOM
-
2026-06-15days on market $120,000 Active 209 DOM
-
2026-06-14days on market $120,000 Active 207 DOM
-
2026-06-10days on market $120,000 Active 204 DOM
-
2026-06-09days on market $120,000 Active 203 DOM
-
2026-06-08days on market $120,000 Active 202 DOM
-
2026-06-07days on market $120,000 Active 201 DOM
-
2026-06-05days on market $120,000 Active 198 DOM
-
2026-06-03days on market $120,000 Active 197 DOM
-
2026-06-02days on market $120,000 Active 196 DOM
-
2026-06-01days on market $120,000 Active 195 DOM
-
2026-05-31days on market $120,000 Active 194 DOM
-
2026-05-30days on market $120,000 Active 193 DOM
-
2026-04-28price $120,000
-
2026-01-02status Active
-
2026-01-02price $125,000
-
2025-12-27historical Active Under Contract
-
2025-11-16$160,000 Active
-
2002-10-10soldstatus $47,000
ⓘ Source: listings_history table (triggers on properties + properties_extension) + one-shot
backfill from property_details.listing_events for pre-trigger history.
Tax reassessment forecast FL · Resets to sale price
- Current annual tax
- $336 · $28/mo
- Projected year-2 tax
- $996 · $83/mo
- Expected delta
- +$660/yr (+$55/mo · 196.1%)
ⓘ Screening estimate from a state-policy table — verify with the county assessor before closing.
Climate risk First Street
- Flood 1/10 Low FEMA zone X (unshaded) · 0% chance over 30 yrs
- Wildfire 5/10 Major
- Heat 8/10 Severe 7 d/yr ≥108°F today · 20 d/yr by 30 yrs out
- Wind 9/10 Extreme 99% chance of damaging wind over 30 yrs
- Air quality 4/10 Moderate 5 unhealthy d/yr today · 6 by 30 yrs out
Nearby sold comps map
Loading sold comps map…
Walkable amenities ~0.75 mi
Loading nearby amenities…
Taxation est. · year 1
- Rental income
- $27,635
- − Mortgage interest
- −$6,722
- − Property taxes
- −$336
- − Insurance
- −$600
- − Repairs & maintenance
- −$2,211
- − Management
- −$2,211
- − Depreciation
- −$3,491
- Taxable income
- $12,064
- Est. tax owed @ 24.0%
- −$2,895
- After-tax cash flow
- $10,448/yr
For passive investors: Depreciation is non-cash, so a rental often shows a tax loss while cash-flowing — sheltering income. Rental losses are passive: they offset passive income freely, and up to $25,000/yr can offset ordinary (W-2) income if you actively participate and your MAGI is under $100k (phasing out to $0 by $150k); unused losses carry forward. On sale, claimed depreciation is recaptured at up to 25%, and gains may owe capital-gains tax (a 1031 exchange can defer both). Figures are a year-1 estimate at your 24.0% rate — not tax advice; consult a CPA.
Schools (NCES district)
- District
- Leon
- NCES district ID
- 1201110
- Math proficiency
- 48% ▼ -13.00%
- Reading proficiency
- 53% ▼ -5.00%
- Median HH income
- $46,339
- Composite
- 42.84/100
- National rank
- #3131
- State rank
- #33 of 73 in FL
Livability — Tallahassee
- Score
- 86/100
- State rank
- #19
- US rank
- #429
Category grades
Schools grade is shown separately in the Schools card above.
Census & demographics
- County
- Leon County · 294,472 people
- City population
- 294,472
- Metro
- Tallahassee, FL
- Population (ZIP)
- 19,384
- Household income
- $48,045
- Rent vs Own
- Severe rent burden
- 654.0
Population outlook (Leon County) Hauer SSP2
- Today (2025)
- 315,507 people
- By 2030
- 330,677 · +4.8%
- By 2040
- 358,465 · +13.6%
- By 2050
- 386,804 · +22.6%
- By 2075
- 465,480 · +47.5%
- By 2100
- 519,959 · +64.8%
Race, ethnicity, and origin ACS 2023
- Neighborhood character
- Diverse neighborhood (Simpson 0.57)
- Race & ethnicity
- Black 57% White 33% Two or more races 5% Hispanic / Latino 5% Asian 1%
- Common ancestry
- Serbian 1% Hispanic 1% Iranian 1%
- Foreign-born
- 3% · Canada
- Languages at home
- 94% English-only · Spanish 5% Other Indo-European 1%
Political lean MEDSL · Leon
- 2024 margin
- Strong D (+21.8) · D 60.3% · R 38.5% · Other 1.2%
- 2008→2024 swing
- -2.5pp toward R · 2008: 24.3pp · 2024: 21.8pp
- All cycles
- 2024: D+21.8 2020: D+28.3 2016: D+25.1 2012: D+23.6 2008: D+24.3
Not yet ingested
- Civics
- —
Market trends
- HPI YoY
- ▼ -63.40%
- Current HPI
- 218.4834
- Rent YoY
- —
- Metro
- Tallahassee, FL
- State GDP YoY
- ▲ 3.28%
- F500 in state
- 36
Industry mix (Fortune 500 HQ in FL)
| Industry | F500 HQs | Revenue |
|---|---|---|
| Industrial Technology | 2 | $29B |
|
||
| Insurance | 2 | $17B |
|
||
| Retail | 1 | $60B |
|
||
| Technology Distribution | 1 | $58B |
|
||
| Homebuilding | 1 | $35B |
|
||
| Technology Manufacturing | 1 | $35B |
|
||
Price history
+155.3% since first listed6 events — show timeline
- 2026-04-28 Price Changed $120,000 CATRS
- 2026-01-02 Relisted — CATRS
- 2026-01-02 Price Changed $125,000 CATRS
- 2025-12-27 Contingent — CATRS
- 2025-11-16 Listed $160,000 CATRS
- 2002-10-10 Sold (Public Records) $47,000 Public Records
Property tax history
+12.6%/yrLatest (2025): $336 · +269.7% YoY. Source: county tax records.
Cash-flow waterfall
monthlySold comps — $/sqft
last 12 mo · ≤1 miLoading sold comps…