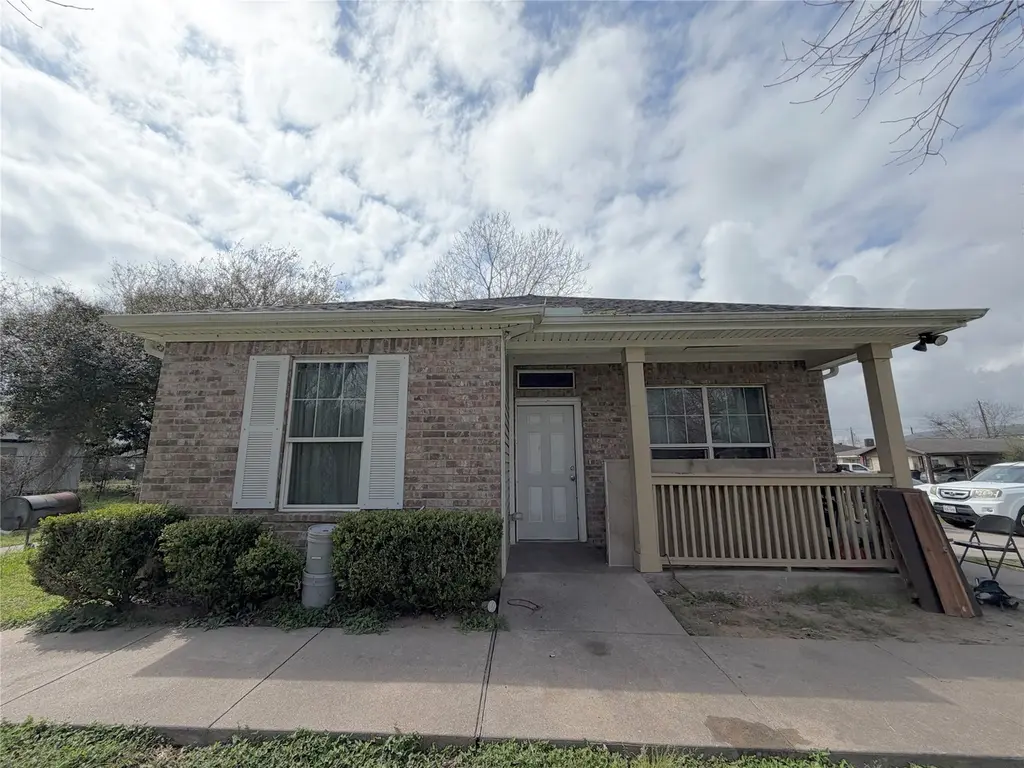
6713 Woodrow St · Texas City, TX
Flood risk 6/10 · Moderate
- FEMA flood zone
- X (shaded)
- Chance of flooding over 30 yrs
- 0.55%
- Est. flood insurance / yr
- $507 – $1,088
Fire risk 1/10 · Minimal
- Est. fire insurance / yr
- $1,222 – $2,270
Heat risk 10/10 · Severe
- Hot days now (above 110°F)
- 7 days/yr
- Hot days in 30 yrs
- 27 days/yr
Wind risk 10/10 · Severe
- Chance of severe wind over 30 yrs
- 99.0%
Air-quality risk 3/10 · Minor
- Unhealthy air days now
- 2 days/yr
- Unhealthy air days in 30 yrs
- 2 days/yr
Risk factors via First Street. Map © Google.
Why this score? — see what drove the C grade
The composite is a weighted blend of 9 inputs, each scored 0–100. Each bar is that input's sub-score; the figure is the points it added to the 100-point composite (weight × sub-score).
- Cash flow +21.2/30.0
- ARV discount +9.6/15.0
- DSCR +6.8/10.0
- 1% rule +6.7/10.0
- Rent growth +3.7/5.0
- Livability +3.1/5.0
- Condition / age +2.5/5.0
- Schools +2.4/10.0
- Appreciation +0.0/10.0
$170,000
🖨 Deal sheet 📄 Offer letter ✓ Due diligence
Listing remarks MLS
4-bedroom, 2-bath home in Texas City offering a functional layout and spacious backyard. Tile flooring throughout and a large living area provide a solid foundation for customization. Conveniently located near schools, shopping, and major roadways for easy commuting. Investor-friendly opportunity with potential for renovation, rental income, or redevelopment.
Key facts
- Large living area
- Spacious backyard
- Tile flooring
Tags
Neighborhood map
What this means for you Summary
Snapshot
- This is a 4-bed/2.0-bath single-family listed at $170k.
Deal economics
- At list price, monthly cash flow is $246 ($3k/yr) — positive.
- The deal already cash-flows at list — no discount required.
- Meets the 1% rule at list price ($2k rent vs $170k).
- Recommended offer: $155k (9.0% below list) — sets the bar for market timing.
- Cap rate 8.0% vs local median 4.3% in Texas City — top-decile yield for the area; either an underpriced asset or a hidden risk that comps aren't pricing in. Stress-test before assuming the spread holds.
Location & tenants
- Location reads 62/100 on livability (#907 in TX) — a middle-class / working-renter tenant base. Strengths: cost of living A+, housing A+; Watch: crime D+, schools F, amenities F.
- Texas City ISD (suburban): math 28% / reading 29% proficiency, ranked #655 of 826 in TX (top 79%) — low school quality limits family demand, transient renter base, plan for 1-2y turnover; 66% free/reduced lunch — lower-income household profile, screen leases tightly.
- Market conditions: Rents rising fast (+4.7%/yr); 240 active listings in the ZIP; 9 comparable units currently listed for rent nearby; rentals at typical pace (median 25d on market — plan ~3-4 weeks tenant-placement turnaround); 3,258 units permitted in Galveston County in 2024 (0 in 5+ unit buildings).
- This rent runs 35% of the median local income ($69k/yr) — at the standard rent-burdened threshold; future hikes will face affordability resistance.
Forward outlook
- Local home prices are declining (-3.0%/yr); year-one equity from $1k of loan paydown is wiped out by about $5k of value loss. Plan a longer hold.
- Galveston County population projected at +43% by 2050 — long-run rental-demand tailwind backs the buy-and-hold thesis.
Negotiation context
- It's been on market 105 days — a 9% lower offer ($155k) is reasonable based on typical stale-listing flexibility.
Risks & watch-outs
- Watch-outs: property tax is 2.6% of price.
- Climate carrying-cost: major flood risk; severe wind risk, 99% chance of damaging wind over 30y; extreme-heat days projected 7→27/yr by 2055 (HVAC capex compounding) — expect insurance premiums to compound above CPI over the hold.
Questions for the listing agent
- It's been on market 105 days. Have you received any prior offers? Is the seller open to a 9% concession, seller financing, or rate buy-down credit?
- Property tax is high relative to price — has the assessment been appealed recently, and will the sale trigger a re-assessment?
- Why hasn't it sold? Are there any deal-killer items the seller is aware of (foundation, flood, title, zoning, code violations)?
- Is there a deadline driving the sale (1031 exchange, divorce, estate, relocation)? That informs how much negotiation room exists.
- Schools are F-rated, which usually means shorter tenancies and higher turnover. Who's the typical renter profile here, and what's been the actual vacancy rate?
- Crime grade is D in this area — have there been break-ins, vandalism, or insurance claims at this property in the last 3 years? What carrier currently insures it and at what premium?
- What's the average days-on-market for RENTAL listings here right now (not sales)? A rising rental-DOM trend means longer vacancies and softer asking-rent achievability than the comps imply.
- What's the recent tenant-quality profile in this submarket — average credit score on applications, eviction rate, late-payment / NSF rate, and stable-employment percentage? A property-management company in the area should have these aggregated.
- How much new for-sale + rental construction is in the pipeline within 1–3 miles? Heavy new supply typically softens prices + rents 12–24 months out; constrained supply supports both.
Investment metrics
- 1% rule
- 1.17% ✓
- Cap rate
- 8.03%
- Cash-on-cash
- 6.20%
- DSCR
- 1.28
- GRM
- 7.1
CMA / ARV
- ARV (median comp)
- $178,304
- List price
- $170,000
- Delta
- -4.66%
- Verdict
- FAIR
- Comps
- 20 within 1.0 mi
Show comp detail 12 sales within ~0.75 mi
| Address | Dist | Beds/Ba | Sqft | Sold | Price | $/sf | Match |
|---|---|---|---|---|---|---|---|
| 6618 Park Ave | 0.09mi | 3/2.5 (-1) | 1,362 (+4%) | 5mo | $204,900 | $150 | 79 |
| 7214 Whippoorwill Ln | 0.38mi | 4/2.0 | 1,292 (-2%) | 2mo | $128,000 | $99 | 77 |
| 7211 Mockingbird Ln | 0.29mi | 3/1.5 (-1) | 1,300 (-1%) | 2mo | $187,600 | $144 | 76 |
| 6519 Anderson St | 0.09mi | 3/2.0 (-1) | 1,490 (+13%) | 4mo | $210,000 | $141 | 65 |
| 7011 Anderson St | 0.17mi | 3/1.0 (-1) | 1,176 (-11%) | 1mo | $80,000 | $68 | 65 |
| 7306 Nightingale Cir | 0.34mi | 4/2.0 | 1,502 (+14%) | 6mo | $230,000 | $153 | 56 |
| 208 Preston St | 0.64mi | 3/1.0 (-1) | 1,364 (+4%) | 0mo | $157,999 | $116 | 55 |
| 118 Brown St | 0.67mi | 3/1.0 (-1) | 1,275 (-3%) | 1mo | $205,000 | $161 | 54 |
| 229 S Fulton St S | 0.46mi | 3/1.5 (-1) | 1,474 (+12%) | 1mo | $159,900 | $108 | 51 |
| 26 W Red Oak Ln | 0.71mi | 4/2.0 | 1,463 (+11%) | 4mo | $219,900 | $150 | 45 |
| 5717 Eunice St | 0.69mi | 3/1.5 (-1) | 1,433 (+9%) | 2mo | $110,000 | $77 | 44 |
| 7806 Jonquil Dr | 0.72mi | 3/2.0 (-1) | 1,512 (+15%) | 3mo | $229,900 | $152 | 34 |
Match score weights: distance 35% · size 25% · config 20% · recency 20%. Top-matched comps best support the ARV.
Projected returns pro-forma
-3.0% appreciation · 4.67% rent growth · sell at horizon
- IRR
- -4.6%
- Equity multiple
- 0.82×
- Total profit
- $-8,343
- Equity at exit
- $25,348
- IRR
- 7.2%
- Equity multiple
- 1.59×
- Total profit
- $27,886
- Equity at exit
- $14,698
Cash invested: $47,600 (down + closing). Projections, not guarantees.
Landlord ↔ Tenant lean methodology
- Overall (STATE)
- 87 Strongly Landlord-Friendly
- State Texas
- 87 Strongly Landlord-Friendly · R+5
- County
- — inherits STATE
- City
- — inherits STATE
ZIP-level market 77591
- Home prices YoY
- -5.6%
- Rents YoY
- 4.7%
- Active inventory
- 240
- Price-to-rent
- 7.1×
Monthly cashflow live
- Estimated rent
- $1,994 high interval (Pro) →
- Mortgage (P&I)
- −$891
- Tax from tax record
- −$367 /mo · $4,400/yr
- Insurance
- −$71
- HOA
- −$0
- Vacancy / Maint / Mgmt
- −$419
- Net cashflow
- $246
Break-even live
UW: 25.0% down · 7.5% · 30yr · 1.5% tax · 5.0% vac · 8.0% maint · 8.0% mgmt
Financing live
Cash to close
- Down payment
- $42,500
- Closing costs
- $5,100
- Reserves months
- —
- Total cash needed
- —
Loan-product check · same deal, 3 products live
Conventional
25% down · 7.5% · 30yr
- Down + closing
- —
- Monthly P&I
- —
- Monthly cashflow
- —
- DSCR
- —
- Eligible?
- —
Personal DTI + credit; lowest rate.
DSCR
20% down · 8.5% · 30yr
- Down + closing
- —
- Monthly P&I
- —
- Monthly cashflow
- —
- DSCR
- —
- Eligible?
- —
No personal income docs; deal must DSCR.
Hard money
10% down · 12.0% · 12mo
- Down + closing
- —
- Monthly P&I
- —
- Monthly cashflow
- —
- DSCR
- —
- Eligible?
- —
Short-term bridge; refi at stabilization.
Rent comps 9 comps
| Address | Beds | Baths | Sqft | Rent | $/sqft | DOM | Units | Dist |
|---|---|---|---|---|---|---|---|---|
| 7510 Hummingbird Ln Texas City, TX | 3.0 | 1.5 | 1200 | $1,550 | $1.29 | 3d | 1 | 0.56mi |
| 619 N Vionett Ln Texas City, TX | 3.0 | 2.0 | 1204 | $1,550 | $1.29 | 5d | 1 | 0.63mi |
| 8208 Ash Rd Texas City, TX | 4.0 | 2.0 | 1701 | $1,795 | $1.06 | 44d | 1 | 0.99mi |
| 203 Beatrice St La Marque, TX | 3.0 | 1.0 | 1304 | $1,395 | $1.07 | 24d | 1 | 1.11mi |
| 1006 E Camp Cir La Marque, TX | 3.0 | 1.0 | 1230 | $1,500 | $1.22 | 24d | 1 | 1.22mi |
| 14403 Daniel Shores Dr La Marque, TX | 4.0 | 3.0–3.5 | 1872 | $2,600 | $1.39 | 1d | 12 | 1.24mi |
| 1013 Margot St La Marque, TX | 3.0 | 2.0 | 1099 | $1,500 | $1.36 | 19d | 1 | 1.28mi |
| 113 N Pecan Dr Texas City, TX | 4.0 | 2.0 | 1468 | $3,000 | $2.04 | 44d | 1 | 1.44mi |
| 1401 Austin St La Marque, TX | 4.0 | 3.0 | 1542 | $2,400 | $1.56 | 44d | 1 | 1.47mi |
Listing history 14 events
-
2026-06-18days on market $170,000 Active 105 DOM
-
2026-06-17days on market $170,000 Active 104 DOM
-
2026-06-16days on market $170,000 Active 103 DOM
-
2026-06-15days on market $170,000 Active 102 DOM
-
2026-06-13days on market $170,000 Active 100 DOM
-
2026-06-09days on market $170,000 Active 96 DOM
-
2026-06-08days on market $170,000 Active 95 DOM
-
2026-06-07pricedays on market $170,000 Active 94 DOM
-
2026-06-04days on market $189,900 Active 91 DOM
-
2026-06-03days on market $189,900 Active 90 DOM
-
2026-06-02days on market $189,900 Active 89 DOM
-
2026-06-01days on market $189,900 Active 88 DOM
-
2026-05-31days on market $189,900 Active 87 DOM
-
2026-03-05$189,900 Active 361-char remark
Show marketing remark (361 chars)
4-bedroom, 2-bath home in Texas City offering a functional layout and spacious backyard. Tile flooring throughout and a large living area provide a solid foundation for customization. Conveniently located near schools, shopping, and major roadways for easy commuting. Investor-friendly opportunity with potential for renovation, rental income, or redevelopment.
ⓘ Source: listings_history table (triggers on properties + properties_extension) + one-shot
backfill from property_details.listing_events for pre-trigger history.
Tax reassessment forecast TX · Resets to sale price
- Current annual tax
- $4,400 · $367/mo
- Projected year-2 tax
- $4,400 · $367/mo
- Expected delta
- $0/yr ($0/mo · 0.0%)
ⓘ Screening estimate from a state-policy table — verify with the county assessor before closing.
Climate risk First Street
- Flood 6/10 Major FEMA zone X (shaded) · 55% chance over 30 yrs
- Wildfire 1/10 Low
- Heat 10/10 Extreme 7 d/yr ≥110°F today · 27 d/yr by 30 yrs out
- Wind 10/10 Extreme 99% chance of damaging wind over 30 yrs
- Air quality 3/10 Moderate 2 unhealthy d/yr today · 2 by 30 yrs out
Nearby sold comps map
Loading sold comps map…
Walkable amenities ~0.75 mi
Loading nearby amenities…
Taxation est. · year 1
- Rental income
- $23,925
- − Mortgage interest
- −$9,523
- − Property taxes
- −$4,400
- − Insurance
- −$850
- − Repairs & maintenance
- −$1,914
- − Management
- −$1,914
- − Depreciation
- −$4,945
- Taxable income
- $379
- Est. tax owed @ 24.0%
- −$91
- After-tax cash flow
- $2,862/yr
For passive investors: Depreciation is non-cash, so a rental often shows a tax loss while cash-flowing — sheltering income. Rental losses are passive: they offset passive income freely, and up to $25,000/yr can offset ordinary (W-2) income if you actively participate and your MAGI is under $100k (phasing out to $0 by $150k); unused losses carry forward. On sale, claimed depreciation is recaptured at up to 25%, and gains may owe capital-gains tax (a 1031 exchange can defer both). Figures are a year-1 estimate at your 24.0% rate — not tax advice; consult a CPA.
Schools (NCES district)
- District
- Texas City ISD
- NCES district ID
- 4842510
- Math proficiency
- 28% ▼ -10.00%
- Reading proficiency
- 29% ▼ -4.00%
- Median HH income
- $44,875
- Composite
- 24.47/100
- National rank
- #7664
- State rank
- #655 of 826 in TX
Livability — Texas City
- Score
- 62/100
- State rank
- #907
- US rank
- #16268
Category grades
Schools grade is shown separately in the Schools card above.
Census & demographics
- Census place
- Texas City, TX
- County
- Galveston County · 357,330 people
- City population
- 49,936
- Metro
- Houston-The Woodlands-Sugar Land, TX
- Population (ZIP)
- 18,294
- Household income
- $68,593
- Rent vs Own
- Severe rent burden
- 718.0
Population outlook (Galveston County) Hauer SSP2
- Today (2025)
- 390,640 people
- By 2030
- 425,226 · +8.9%
- By 2040
- 493,765 · +26.4%
- By 2050
- 559,698 · +43.3%
- By 2075
- 719,260 · +84.1%
- By 2100
- 819,628 · +109.8%
Race, ethnicity, and origin ACS 2023
- Neighborhood character
- Diverse neighborhood (Simpson 0.65)
- Race & ethnicity
- Black 50% White 26% Hispanic / Latino 19% Two or more races 9% Asian 2%
- Hispanic origin (detail)
- Mexican 15%
- Common ancestry
- Lithuanian 2% Romanian 1% Slovak 1%
- Foreign-born
- 7% · Canada, China
- Languages at home
- 88% English-only · Spanish 9% Other Indo-European 1% Chinese 1%
Political lean MEDSL · Galveston
- 2024 margin
- Strong R (+27.4) · D 35.7% · R 63.1% · Other 1.2%
- 2008→2024 swing
- -7.9pp toward R · 2008: -19.5pp · 2024: -27.4pp
- All cycles
- 2024: R+27.4 2020: R+22.6 2016: R+22.6 2012: R+26.9 2008: R+19.5
Not yet ingested
- Civics
- —
Market trends
- HPI YoY
- ▼ -14.63%
- Current HPI
- 247.1905
- Rent YoY
- ▲ 4.67%
- Metro
- Houston-The Woodlands-Sugar Land, TX
- State GDP YoY
- ▲ 3.95%
- F500 in state
- 110
Industry mix (Fortune 500 HQ in TX)
| Industry | F500 HQs | Revenue |
|---|---|---|
| Energy | 16 | $1,198B |
|
||
| Technology | 5 | $198B |
|
||
| Engineering / Construction | 4 | $72B |
|
||
| Energy Services | 3 | $60B |
|
||
| Utilities | 3 | $41B |
|
||
| Healthcare | 2 | $330B |
|
||
Price history
1 event — show timeline
- 2026-03-05 Listed $189,900 HARMLS
Property tax history
+20.7%/yrLatest (2025): $4,400 · +12.9% YoY. Source: county tax records.
Cash-flow waterfall
monthlySold comps — $/sqft
last 12 mo · ≤1 miLoading sold comps…