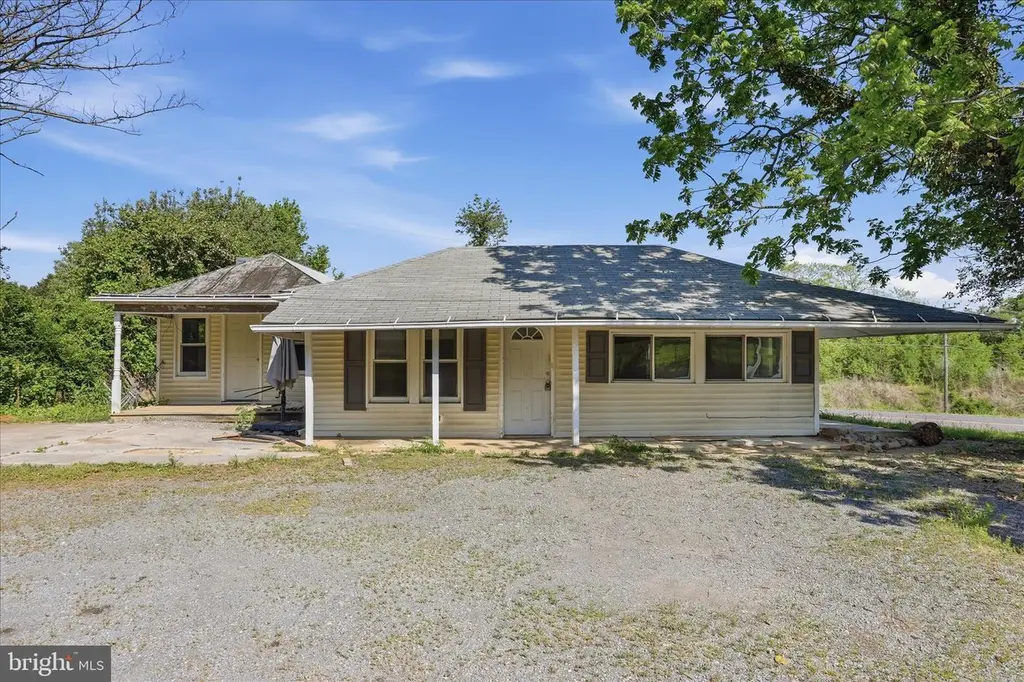
16273 Old Valley Pike · Edinburg, VA
Flood risk 1/10 · Minimal
- FEMA flood zone
- X (unshaded)
- Chance of flooding over 30 yrs
- 0.0%
- Est. flood insurance / yr
- $507 – $1,088
Fire risk 3/10 · Minor
- Est. fire insurance / yr
- $666 – $1,236
Heat risk 5/10 · Moderate
- Hot days now (above 97°F)
- 8 days/yr
- Hot days in 30 yrs
- 20 days/yr
Wind risk 2/10 · Minimal
- Chance of severe wind over 30 yrs
- 1.0%
Air-quality risk 1/10 · Minimal
- Unhealthy air days now
- 0 days/yr
- Unhealthy air days in 30 yrs
- 0 days/yr
Risk factors via First Street. Map © Google.
Why this score? — see what drove the C+ grade
The composite is a weighted blend of 9 inputs, each scored 0–100. Each bar is that input's sub-score; the figure is the points it added to the 100-point composite (weight × sub-score).
- Cash flow +15.6/30.0
- ARV discount +15.0/15.0
- Appreciation +10.0/10.0
- DSCR +4.8/10.0
- Schools +4.4/10.0
- Livability +3.4/5.0
- 1% rule +3.1/10.0
- Rent growth +2.5/5.0
- Condition / age +2.5/5.0
$160,000
🖨 Deal sheet 📄 Offer letter ✓ Due diligence
Listing remarks
SELLER NOW OFFERING $10,000 TOWARD TAP FEE OR WELL. 2-bedroom, 1-bath ranch being sold strictly AS-IS. Property will require significant renovation and updates. Home features a cistern water system and is not connected to public water. Great opportunity for buyers looking for a project property with potential. Buyer to perform all due diligence regarding condition, utilities, and systems.
Key facts
- Cistern water system
- 5,445 sq ft lot
- Built 1900
Tags
Property features AI
Finance
- Other: Fee simple ownership; Below average property condition; Built year and square footage sources from assessor; Above-grade finished area approximately 1,194 (assessor)
Exterior
- Parking: Driveway
- Utilities: Public sewer; Cistern water source; Electric service for heating/cooling/hot water
- Home design: Detached dwelling; Vinyl siding
- Construction: Concrete perimeter foundation; Above-grade and below-grade structures
- Exterior features: No basement; Not tidal water
Interior
- Bedrooms: 2 bedrooms on the main level
- Bathrooms: 1 full bathroom (main level)
- Heating & cooling: Heat pump heating (electric); Central air conditioning (electric); Electric hot water
- Interior features: Ceiling fans; Tub with shower; Entry-level bedroom
Neighborhood map
What this means for you Summary
Snapshot
- This is a 2-bed/1.0-bath single-family listed at $160k.
Deal economics
- At list price, monthly cash flow is $67 ($808/yr) — positive.
- The deal already cash-flows at list — no discount required.
- To meet the 1% rule (rent ≥ 1% of price), the offer needs to be $130k (18.8% below list).
- Recommended offer: $130k (18.8% below list) — sets the bar for 1% rule.
Location & tenants
- Location reads 67/100 on livability (#294 in VA) — a middle-class / working-renter tenant base. Strengths: crime A+, housing A+, cost of living A; Watch: amenities F, commute F, health & safety D-.
- Shenandoah County Public School District (town): math 46% / reading 58% proficiency, ranked #91 of 131 in VA (top 70%) — acceptable for families but not a draw, mixed tenant base, ~2y average lease.
- Zoned schools: W.W. Robinson Elementary (math 53% / reading 49%, grade C-, #733 of 1,108 statewide, top 66%, 1,061 students, 74% FRL); Peter Muhlenberg Middle (math 33% / reading 57%, grade D, #274 of 342 statewide, top 81%, 451 students, 73% FRL); Central High (math 46% / reading 66%, grade C, #275 of 319 statewide, top 87%, 749 students, 73% FRL) — zoned schools average 73% FRL vs 37% district-wide (36 pts higher); higher-poverty schools than district average — tighter screening recommended.
- Market conditions: 44 active listings in the ZIP; 224 units permitted in Shenandoah County in 2024 (0 in 5+ unit buildings).
Forward outlook
- In year one you build about $17k of equity ($1k loan paydown + $16k appreciation (10.0% local appreciation)).
- Shenandoah County population projected at +5% by 2050 — modest demand growth; plan on rents tracking national, not racing it.
- At projected returns (10.0% appreciation + 3.0% rent growth), your $45k cash investment doubles in ~3 years — after that, you're playing with house money.
- By year 3, paydown + projected appreciation supports a ~$43k cash-out refi (75% LTV) — recoverable capital for the next deal without selling this one.
Negotiation context
- It's been on market 28 days — a 2% lower offer ($158k) is reasonable based on typical stale-listing flexibility.
Risks & watch-outs
- Watch-outs: built in 1900 — expect roof / HVAC / electrical / plumbing capex.
- Climate carrying-cost: extreme-heat days projected 8→20/yr by 2055 (HVAC capex compounding) — expect insurance premiums to compound above CPI over the hold.
Questions for the listing agent
- Built in 1900 — when were the roof, HVAC, electrical panel, plumbing, and water heater last replaced?
- Is there a deadline driving the sale (1031 exchange, divorce, estate, relocation)? That informs how much negotiation room exists.
- Schools are D-rated, which usually means shorter tenancies and higher turnover. Who's the typical renter profile here, and what's been the actual vacancy rate?
- What's the average days-on-market for RENTAL listings here right now (not sales)? A rising rental-DOM trend means longer vacancies and softer asking-rent achievability than the comps imply.
- What's the recent tenant-quality profile in this submarket — average credit score on applications, eviction rate, late-payment / NSF rate, and stable-employment percentage? A property-management company in the area should have these aggregated.
- How much new for-sale + rental construction is in the pipeline within 1–3 miles? Heavy new supply typically softens prices + rents 12–24 months out; constrained supply supports both.
Investment metrics
- 1% rule
- 0.81% ✗
- Cap rate
- 6.80%
- Cash-on-cash
- 1.80%
- DSCR
- 1.08
- GRM
- 10.3
CMA / ARV
- ARV (on-the-fly)
- $246,776
- Comps found
- 4
Show comp detail 4 sales within ~0.75 mi
| Address | Dist | Beds/Ba | Sqft | Sold | Price | $/sf | Match |
|---|---|---|---|---|---|---|---|
| 130 N High St | 0.57mi | 3/2.0 (+1) | 1,188 (+5%) | 1mo | $300,000 | $253 | 56 |
| 881 Water St | 0.43mi | 2/3.0 | 1,220 (+8%) | 23mo | $158,000 | $130 | 40 |
| 107 Water St | 0.72mi | 3/1.5 (+1) | 1,218 (+8%) | 14mo | $265,000 | $218 | 35 |
| 213 Shenandoah Ave | 0.73mi | 3/1.5 (+1) | 1,212 (+7%) | 20mo | $245,000 | $202 | 31 |
Match score weights: distance 35% · size 25% · config 20% · recency 20%. Top-matched comps best support the ARV.
Projected returns pro-forma
10.0% appreciation · 3.0% rent growth · sell at horizon
- IRR
- 25.6%
- Equity multiple
- 3.04×
- Total profit
- $91,358
- Equity at exit
- $144,141
- IRR
- 22.5%
- Equity multiple
- 6.93×
- Total profit
- $265,522
- Equity at exit
- $310,845
Cash invested: $44,800 (down + closing). Projections, not guarantees.
Landlord ↔ Tenant lean methodology
- Overall (STATE)
- 55 Moderately Landlord-Leaning
- State Virginia
- 55 Moderately Landlord-Leaning · D+2
- County
- — inherits STATE
- City
- — inherits STATE
ZIP-level market 22824
- Home prices YoY
- 8.9%
- Active inventory
- 44
- Price-to-rent
- 10.3×
Monthly cashflow live
- Estimated rent
- $1,299 medium interval (Pro) →
- Mortgage (P&I)
- −$839
- Tax from tax record
- −$53 /mo · $634/yr
- Insurance
- −$67
- HOA
- −$0
- Vacancy / Maint / Mgmt
- −$273
- Net cashflow
- $67
Break-even live
UW: 25.0% down · 7.5% · 30yr · 1.5% tax · 5.0% vac · 8.0% maint · 8.0% mgmt
Financing live
Cash to close
- Down payment
- $40,000
- Closing costs
- $4,800
- Reserves months
- —
- Total cash needed
- —
Loan-product check · same deal, 3 products live
Conventional
25% down · 7.5% · 30yr
- Down + closing
- —
- Monthly P&I
- —
- Monthly cashflow
- —
- DSCR
- —
- Eligible?
- —
Personal DTI + credit; lowest rate.
DSCR
20% down · 8.5% · 30yr
- Down + closing
- —
- Monthly P&I
- —
- Monthly cashflow
- —
- DSCR
- —
- Eligible?
- —
No personal income docs; deal must DSCR.
Hard money
10% down · 12.0% · 12mo
- Down + closing
- —
- Monthly P&I
- —
- Monthly cashflow
- —
- DSCR
- —
- Eligible?
- —
Short-term bridge; refi at stabilization.
Listing history 16 events
-
2026-06-18days on market $160,000 Active 28 DOM
-
2026-06-17days on market $160,000 Active 27 DOM
-
2026-06-16days on market $160,000 Active 26 DOM
-
2026-06-15days on market $160,000 Active 25 DOM
-
2026-06-13days on market $160,000 Active 23 DOM
-
2026-06-13pricedays on market $160,000 Active 22 DOM
-
2026-06-09days on market $175,000 Active 19 DOM
-
2026-06-08days on market $175,000 Active 18 DOM
-
2026-06-08remarks 391-char remark
-
2026-06-07days on market $175,000 Active 17 DOM
-
2026-06-04days on market $175,000 Active 14 DOM
-
2026-06-03days on market $175,000 Active 13 DOM
-
2026-06-02days on market $175,000 Active 12 DOM
-
2026-06-01days on market $175,000 Active 11 DOM
-
2026-05-31days on market $175,000 Active 10 DOM
-
2026-05-21$175,000 Active
ⓘ Source: listings_history table (triggers on properties + properties_extension) + one-shot
backfill from property_details.listing_events for pre-trigger history.
Tax reassessment forecast VA · Resets to sale price
- Current annual tax
- $634 · $53/mo
- Projected year-2 tax
- $1,312 · $109/mo
- Expected delta
- +$678/yr (+$56/mo · 106.9%)
ⓘ Screening estimate from a state-policy table — verify with the county assessor before closing.
Climate risk First Street
- Flood 1/10 Low FEMA zone X (unshaded) · 0% chance over 30 yrs
- Wildfire 3/10 Moderate
- Heat 5/10 Major 8 d/yr ≥97°F today · 20 d/yr by 30 yrs out
- Wind 2/10 Low 100% chance of damaging wind over 30 yrs
- Air quality 1/10 Low 0 unhealthy d/yr today · 0 by 30 yrs out
Nearby sold comps map
Loading sold comps map…
Walkable amenities ~0.75 mi
Loading nearby amenities…
Taxation est. · year 1
- Rental income
- $15,584
- − Mortgage interest
- −$8,962
- − Property taxes
- −$634
- − Insurance
- −$800
- − Repairs & maintenance
- −$1,247
- − Management
- −$1,247
- − Depreciation
- −$4,655
- Taxable loss
- −$1,961
- Est. tax savings @ 24.0%
- +$471
- After-tax cash flow
- $1,279/yr
For passive investors: Depreciation is non-cash, so a rental often shows a tax loss while cash-flowing — sheltering income. Rental losses are passive: they offset passive income freely, and up to $25,000/yr can offset ordinary (W-2) income if you actively participate and your MAGI is under $100k (phasing out to $0 by $150k); unused losses carry forward. On sale, claimed depreciation is recaptured at up to 25%, and gains may owe capital-gains tax (a 1031 exchange can defer both). Figures are a year-1 estimate at your 24.0% rate — not tax advice; consult a CPA.
Schools (NCES district)
- District
- Shenandoah County Public School District
- NCES district ID
- 5103510
- Math proficiency
- 46% ▼ -30.00%
- Reading proficiency
- 58% ▼ -9.00%
- Median HH income
- $50,207
- Composite
- 44.42/100
- National rank
- #2811
- State rank
- #91 of 131 in VA
Livability — Edinburg
- Score
- 67/100
- State rank
- #294
- US rank
- #10446
Category grades
Schools grade is shown separately in the Schools card above.
Census & demographics
- Population (ZIP)
- 6,061
Population outlook (Shenandoah County) Hauer SSP2
- Today (2025)
- 44,891 people
- By 2030
- 45,630 · +1.6%
- By 2040
- 46,708 · +4.0%
- By 2050
- 47,072 · +4.9%
- By 2075
- 47,418 · +5.6%
- By 2100
- 43,707 · -2.6%
Race, ethnicity, and origin ACS 2023
- Neighborhood character
- Predominantly White (85%)
- Race & ethnicity
- White 85% Hispanic / Latino 9% Two or more races 6% Black 3%
- Hispanic origin (detail)
- Mexican 6% Puerto Rican 2%
- Common ancestry
- Italian 9% Slovak 4% Iranian 2%
- Foreign-born
- 6% · Canada
- Languages at home
- 90% English-only · Spanish 8% French/Haitian/Cajun 1%
Political lean MEDSL · Shenandoah
- 2024 margin
- Solid R (+42.2) · D 28.4% · R 70.6% · Other 1.0%
- 2008→2024 swing
- -15.8pp toward R · 2008: -26.5pp · 2024: -42.2pp
- All cycles
- 2024: R+42.2 2020: R+40.6 2016: R+43.3 2012: R+31.4 2008: R+26.5
Not yet ingested
- Civics
- —
Market trends
- HPI YoY
- ▲ 27.98%
- Current HPI
- 342.2967
- Rent YoY
- —
- Metro
- —
- State GDP YoY
- ▲ 2.40%
- F500 in state
- 50
Industry mix (Fortune 500 HQ in VA)
| Industry | F500 HQs | Revenue |
|---|---|---|
| Aerospace / Defense | 4 | $236B |
|
||
| Technology / Defense | 3 | $32B |
|
||
| Financial Services | 2 | $176B |
|
||
| Utilities | 2 | $27B |
|
||
| Insurance | 2 | $25B |
|
||
| Technology | 2 | $15B |
|
||
Price history
1 event — show timeline
- 2026-05-21 Listed $175,000 BRIGHT MLS
Property tax history
+3.9%/yrLatest (2025): $634 · +0.0% YoY. Source: county tax records.
Cash-flow waterfall
monthlySold comps — $/sqft
last 12 mo · ≤1 miLoading sold comps…