 Multi-family
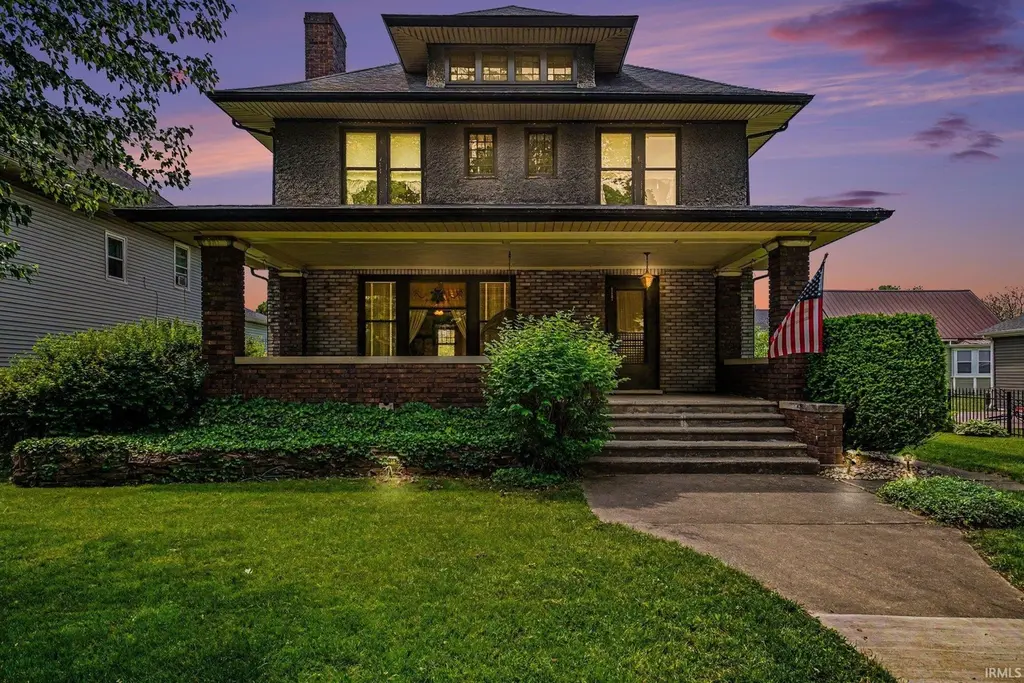
117 N 6th St · Goshen, IN
Flood risk 1/10 · Minimal
- FEMA flood zone
- X (unshaded)
- Chance of flooding over 30 yrs
- 0.0%
- Est. flood insurance / yr
- $473 – $860
Fire risk 1/10 · Minimal
- Est. fire insurance / yr
- $717 – $1,331
Heat risk 3/10 · Minor
- Hot days now (above 100°F)
- 7 days/yr
- Hot days in 30 yrs
- 16 days/yr
Wind risk 2/10 · Minimal
- Chance of severe wind over 30 yrs
- —
Air-quality risk 2/10 · Minimal
- Unhealthy air days now
- 1 days/yr
- Unhealthy air days in 30 yrs
- 2 days/yr
Risk factors via First Street. Map © Google.
Why this score? — see what drove the C+ grade
The composite is a weighted blend of 9 inputs, each scored 0–100. Each bar is that input's sub-score; the figure is the points it added to the 100-point composite (weight × sub-score).
- Cash flow +30.0/30.0
- DSCR +10.0/10.0
- 1% rule +9.2/10.0
- Livability +4.2/5.0
- Schools +3.0/10.0
- Rent growth +2.5/5.0
- Condition / age +2.5/5.0
- ARV discount +0.0/15.0
- Appreciation +0.0/10.0
$249,900
🖨 Deal sheet 📄 Offer letter ✓ Due diligence
Multi-family units
County records classify this as Multi-Family (2-4 Unit). Listing-text estimate: 1 unit. estimate disagrees with records
Listing remarks
Timeless character and craftsmanship shine throughout this spacious early 1900s home offering over 2,500 finished square feet, situated along one of Goshen’s few remaining historic brick roads. Rich original woodwork, detailed trim, hardwood floors, built-ins, and a stunning staircase create warmth and charm from the moment you enter. The main level features multiple living spaces, including a large living room with fireplace, a dinning room, and an office with natural light. The home offers 4 bedrooms, 2 full bathrooms, along with a finished loft area that provides flexible space for an additional bedroom, studio, hobby room, or additional living area. The eat-in kitchen maintains it
Key facts
- Stunning staircase
- Original woodwork
- Detailed trim
Tags
Property features AI
Exterior
- Parking: Detached 1-car garage
- Utilities: Public water; Public sewer
- Home design: Single-family, site-built home; Two stories
- Construction: Brick and concrete construction
- Exterior features: Level lot; Outbuilding on the property
Interior
- Bathrooms: Two full bathrooms, including one on the main level
- Heating & cooling: Hot water heating; Window AC unit(s)
- Interior features: Living room fireplace (1)
- Laundry & utility: Laundry in basement
Neighborhood map
What this means for you Summary
Snapshot
- This is a 4-bed/1.5-bath multifamily listed at $250k.
Deal economics
- At list price, monthly cash flow is $1k ($16k/yr) — positive.
- The deal already cash-flows at list — no discount required.
- Meets the 1% rule at list price ($4k rent vs $250k).
- Cap rate 12.6% vs local median 3.2% in Goshen — top-decile yield for the area; either an underpriced asset or a hidden risk that comps aren't pricing in. Stress-test before assuming the spread holds.
Location & tenants
- Location reads 85/100 on livability (#4 in IN, #622 nationally) — a professional / high-income tenant draw. Strengths: commute A+, cost of living A+, housing A+; Watch: employment D+.
- Goshen Community Schools (urban): math 31% / reading 40% proficiency, ranked #190 of 301 in IN (top 63%) — families likely to look elsewhere, expect single-tenant / working-renter base with shorter leases.
- Zoned schools: Chamberlain Elementary School (math 22% / reading 17%, grade F, #814 of 994 statewide, top 83%, 261 students, 82% FRL); Goshen Junior High School (math 25% / reading 38%, grade F, #197 of 330 statewide, top 60%, 1,001 students, 70% FRL); Goshen High School (math 32% / reading 65%, grade D, #139 of 369 statewide, top 38%, 2,004 students, 64% FRL).
- Market conditions: 74 active listings in the ZIP; 484 units permitted in Elkhart County in 2024 (136 in 5+ unit buildings).
Forward outlook
- Local home prices are declining (-3.0%/yr); year-one equity from $2k of loan paydown is wiped out by about $7k of value loss. Plan a longer hold.
- Elkhart County population projected at +7% by 2050 — modest demand growth; plan on rents tracking national, not racing it.
- At projected returns (-3.0% appreciation + 3.0% rent growth), your $70k cash investment doubles in ~6 years — after that, you're playing with house money.
Negotiation context
- Only 14 days on market — expect competitive offers; lowballing is unlikely to land.
Risks & watch-outs
- Watch-outs: built in 1910 — expect roof / HVAC / electrical / plumbing capex.
Questions for the listing agent
- Built in 1910 — when were the roof, HVAC, electrical panel, plumbing, and water heater last replaced?
- Is there a deadline driving the sale (1031 exchange, divorce, estate, relocation)? That informs how much negotiation room exists.
- Schools are D-rated, which usually means shorter tenancies and higher turnover. Who's the typical renter profile here, and what's been the actual vacancy rate?
- What's the average days-on-market for RENTAL listings here right now (not sales)? A rising rental-DOM trend means longer vacancies and softer asking-rent achievability than the comps imply.
- What's the recent tenant-quality profile in this submarket — average credit score on applications, eviction rate, late-payment / NSF rate, and stable-employment percentage? A property-management company in the area should have these aggregated.
- How much new apartment / multifamily construction is in the pipeline within 1–3 miles? Heavy new supply (>2% of stock underway) typically softens rents 12–24 months out; light construction supports rent growth.
Investment metrics
- 1% rule
- 1.42% ✓
- Cap rate
- 12.64%
- Cash-on-cash
- 22.67%
- DSCR
- 2.01
- GRM
- 5.8
CMA / ARV
- ARV (on-the-fly)
- $174,990
- Comps found
- 1
Show comp detail 1 sale within ~0.75 mi
| Address | Dist | Beds/Ba | Sqft | Sold | Price | $/sf | Match |
|---|---|---|---|---|---|---|---|
| 433 N 1st St | 0.55mi | 5/3.0 (+1) | 2,888 (-6%) | 24mo | $165,500 | $57 | 33 |
Match score weights: distance 35% · size 25% · config 20% · recency 20%. Top-matched comps best support the ARV.
Projected returns pro-forma
-3.0% appreciation · 3.0% rent growth · sell at horizon
- IRR
- 15.5%
- Equity multiple
- 1.62×
- Total profit
- $43,599
- Equity at exit
- $37,261
- IRR
- 24.2%
- Equity multiple
- 3.09×
- Total profit
- $145,996
- Equity at exit
- $21,607
Cash invested: $69,972 (down + closing). Projections, not guarantees.
Landlord ↔ Tenant lean methodology
- Overall (STATE)
- 90 Strongly Landlord-Friendly
- State Indiana
- 90 Strongly Landlord-Friendly · R+11
- County
- — inherits STATE
- City
- — inherits STATE
ZIP-level market 46528
- Home prices YoY
- -26.9%
- Active inventory
- 74
- Price-to-rent
- 11.7×
Monthly cashflow live
- Estimated rent
- $3,560 medium interval (Pro) →
- Mortgage (P&I)
- −$1,311
- Tax from tax record
- −$76 /mo · $912/yr
- Insurance
- −$104
- HOA
- −$0
- Vacancy / Maint / Mgmt
- −$748
- Net cashflow
- $1,322
Break-even live
2-unit breakdown (identical units grouped — click to expand)
| Units | Beds | Baths | Est. rent |
|---|---|---|---|
| 2× units | 2 | 1 | $3,560 |
| #1 | 2 | 1 | $1,780 |
| #2 | 2 | 1 | $1,780 |
| Total (2 units) | $3,560 | ||
UW: 25.0% down · 7.5% · 30yr · 1.5% tax · 5.0% vac · 8.0% maint · 8.0% mgmt
Financing live
Cash to close
- Down payment
- $62,475
- Closing costs
- $7,497
- Reserves months
- —
- Total cash needed
- —
Loan-product check · same deal, 3 products live
Conventional
25% down · 7.5% · 30yr
- Down + closing
- —
- Monthly P&I
- —
- Monthly cashflow
- —
- DSCR
- —
- Eligible?
- —
Personal DTI + credit; lowest rate.
DSCR
20% down · 8.5% · 30yr
- Down + closing
- —
- Monthly P&I
- —
- Monthly cashflow
- —
- DSCR
- —
- Eligible?
- —
No personal income docs; deal must DSCR.
Hard money
10% down · 12.0% · 12mo
- Down + closing
- —
- Monthly P&I
- —
- Monthly cashflow
- —
- DSCR
- —
- Eligible?
- —
Short-term bridge; refi at stabilization.
Listing history 9 events
-
2026-06-09status $249,900 Pending 14 DOM
-
2026-06-08days on market $249,900 Active 14 DOM
-
2026-06-07days on market $249,900 Active 13 DOM
-
2026-06-05days on market $249,900 Active 10 DOM
-
2026-06-02days on market $249,900 Active 8 DOM
-
2026-06-01days on market $249,900 Active 7 DOM
-
2026-05-31days on market $249,900 Active 6 DOM
-
2026-05-30days on market $249,900 Active 5 DOM
-
2026-05-26$249,900 Active
ⓘ Source: listings_history table (triggers on properties + properties_extension) + one-shot
backfill from property_details.listing_events for pre-trigger history.
Tax reassessment forecast IN · Partial reset (capped growth)
- Current annual tax
- $912 · $76/mo
- Projected year-2 tax
- $1,518 · $126/mo
- Expected delta
- +$606/yr (+$51/mo · 66.5%)
ⓘ Screening estimate from a state-policy table — verify with the county assessor before closing.
Climate risk First Street
- Flood 1/10 Low FEMA zone X (unshaded) · 0% chance over 30 yrs
- Wildfire 1/10 Low
- Heat 3/10 Moderate 7 d/yr ≥100°F today · 16 d/yr by 30 yrs out
- Wind 2/10 Low
- Air quality 2/10 Low 1 unhealthy d/yr today · 2 by 30 yrs out
Nearby sold comps map
Loading sold comps map…
Walkable amenities ~0.75 mi
Loading nearby amenities…
Taxation est. · year 1
- Rental income
- $42,720
- − Mortgage interest
- −$13,998
- − Property taxes
- −$912
- − Insurance
- −$1,250
- − Repairs & maintenance
- −$3,418
- − Management
- −$3,418
- − Depreciation
- −$7,270
- Taxable income
- $12,455
- Est. tax owed @ 24.0%
- −$2,989
- After-tax cash flow
- $12,872/yr
For passive investors: Depreciation is non-cash, so a rental often shows a tax loss while cash-flowing — sheltering income. Rental losses are passive: they offset passive income freely, and up to $25,000/yr can offset ordinary (W-2) income if you actively participate and your MAGI is under $100k (phasing out to $0 by $150k); unused losses carry forward. On sale, claimed depreciation is recaptured at up to 25%, and gains may owe capital-gains tax (a 1031 exchange can defer both). Figures are a year-1 estimate at your 24.0% rate — not tax advice; consult a CPA.
Schools (NCES district)
- District
- Goshen Community Schools
- NCES district ID
- 1803930
- Math proficiency
- 31% ▼ -11.00%
- Reading proficiency
- 40% ▼ -4.00%
- Median HH income
- $44,892
- Composite
- 30.24/100
- National rank
- #6292
- State rank
- #190 of 301 in IN
Livability — Goshen
- Score
- 85/100
- State rank
- #4
- US rank
- #622
Category grades
Schools grade is shown separately in the Schools card above.
Census & demographics
- Census place
- Goshen, IN
- City population
- 33,668
- Population (ZIP)
- 26,356
Population outlook (Elkhart County) Hauer SSP2
- Today (2025)
- 213,761 people
- By 2030
- 218,103 · +2.0%
- By 2040
- 225,381 · +5.4%
- By 2050
- 229,447 · +7.3%
- By 2075
- 232,856 · +8.9%
- By 2100
- 214,088 · +0.2%
Race, ethnicity, and origin ACS 2023
- Neighborhood character
- Predominantly White (76%)
- Race & ethnicity
- White 76% Hispanic / Latino 19% Two or more races 7% Black 2% Asian 1%
- Hispanic origin (detail)
- Mexican 16%
- Common ancestry
- Italian 3% Iranian 2% Polish 2%
- Foreign-born
- 9% · Canada, South Korea, Jamaica
- Languages at home
- 73% English-only · Spanish 14% German/W. Germanic 11% Russian/Polish/Slavic 1%
Political lean MEDSL · Elkhart
- 2024 margin
- Solid R (+32.4) · D 33.1% · R 65.5% · Other 1.4%
- 2008→2024 swing
- -21.2pp toward R · 2008: -11.2pp · 2024: -32.4pp
- All cycles
- 2024: R+32.4 2020: R+28.1 2016: R+32.4 2012: R+26.5 2008: R+11.2
Not yet ingested
- Civics
- —
Market trends
- HPI YoY
- ▼ -85.40%
- Current HPI
- 231.4441
- Rent YoY
- —
- Metro
- —
- State GDP YoY
- ▲ 2.90%
- F500 in state
- 18
Industry mix (Fortune 500 HQ in IN)
| Industry | F500 HQs | Revenue |
|---|---|---|
| Industrial Machinery | 2 | $37B |
|
||
| Healthcare | 1 | $177B |
|
||
| Pharmaceuticals | 1 | $45B |
|
||
| Metals / Steel | 1 | $18B |
|
||
| Agriculture | 1 | $17B |
|
||
| Packaging | 1 | $12B |
|
||
Price history
1 event — show timeline
- 2026-05-26 Listed $249,900 IRMLS
Property tax history
+0.6%/yrLatest (2025): $912 · +2.0% YoY. Source: county tax records.
Cash-flow waterfall
monthlySold comps — $/sqft
last 12 mo · ≤1 miLoading sold comps…