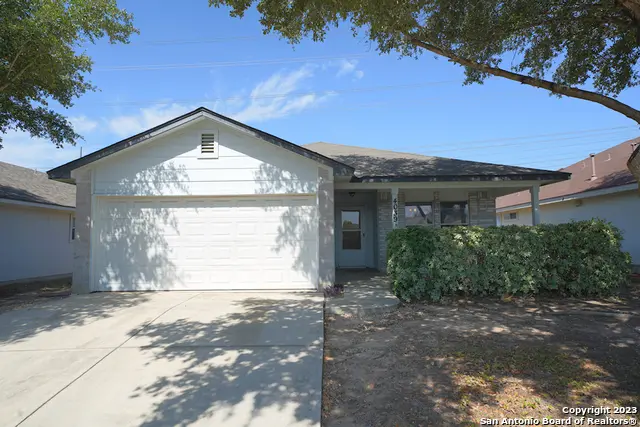
4039 Mistflower · San Antonio, TX
Flood risk 1/10 · Minimal
- FEMA flood zone
- X (unshaded)
- Chance of flooding over 30 yrs
- 0.0%
- Est. flood insurance / yr
- $507 – $1,088
Fire risk 4/10 · Minor
- Est. fire insurance / yr
- $1,222 – $2,270
Heat risk 8/10 · Major
- Hot days now (above 108°F)
- 7 days/yr
- Hot days in 30 yrs
- 22 days/yr
Wind risk 8/10 · Major
- Chance of severe wind over 30 yrs
- 80.0%
Air-quality risk 1/10 · Minimal
- Unhealthy air days now
- 0 days/yr
- Unhealthy air days in 30 yrs
- 0 days/yr
Risk factors via First Street. Map © Google.
Why this score? — see what drove the C- grade
The composite is a weighted blend of 9 inputs, each scored 0–100. Each bar is that input's sub-score; the figure is the points it added to the 100-point composite (weight × sub-score).
- Cash flow +15.2/30.0
- ARV discount +15.0/15.0
- 1% rule +5.2/10.0
- DSCR +4.7/10.0
- Livability +4.0/5.0
- Condition / age +2.5/5.0
- Schools +2.4/10.0
- Rent growth +2.2/5.0
- Appreciation +0.0/10.0
$169,950
🖨 Deal sheet (PDF) 📄 Offer letter ✓ Due diligence
Listing remarks MLS
*Feel Welcome Here!* Immaculate home, well cared for by original owner. Spacious kitchen with gas cooking will please the family chef. Utility area located inside. Enjoy relaxing on the "country style" front porch or back patio. Gardener's will love the mature landscaping including fruit trees. Located in a family friendly neighborhood with easy commute to Ft. Sam, Randolph A.F.B., and Downtown. Neighborhood pool and recreation area. Beautiful home for the simple lifestyle!
Key facts
- Generous kitchen
- Backyard patio
- Community pool
Tags
Property features AI
Finance
- Financial info: Association transfer fee applies
- HOA & community: Mandatory HOA; Community amenities include a pool and sports court; HOA fee paid annually
Exterior
- Parking: Attached 2-car garage
- Utilities: Water service: SAWS; Sewer service: SAWS; Electric service: CPS; Gas service: CPS; Garbage service: C-6 Disposal; Other utility: Spectrum
- Home design: Brick and cement fiber exterior; Faces east; Pre-owned home; Approximate age: 21 years
- Construction: Slab foundation; Composition roof; Built by Mainstreet
- Exterior features: Patio slab; Privacy fence; Double-pane windows; Gutters; Mature trees
Interior
- Kitchen: Stove/Range; Refrigerator; Disposal; Ice maker connection; Kitchen approx. 14 x 12
- Bedrooms: Master bedroom on lower level with walk-in closet and full bath (approx. 14 x 12); Bedroom 2 approx. 11 x 10; Bedroom 3 approx. 11 x 10
- Flooring: Vinyl flooring
- Bathrooms: Two full bathrooms; Master bath with tub/shower combination and single vanity (approx. 7 x 6)
- Heating & cooling: Central heating (electric); Central air conditioning
- Interior features: Open floor plan with one main living area and a separate dining room; Utility room inside; Ground level / no steps; Cable TV available and high-speed internet; All window coverings remain
- Laundry & utility: Washer connection; Dryer connection; Utility room approx. 6 x 3
Neighborhood map
What this means for you Summary
Snapshot
- This is a 3-bed/2.0-bath single-family listed at $170k.
Deal economics
- At list price, monthly cash flow is $59 ($710/yr) — positive.
- The deal already cash-flows at list — no discount required.
- Meets the 1% rule at list price ($2k rent vs $170k).
- Cap rate 6.7% vs local median 3.8% in San Antonio — top-decile yield for the area; either an underpriced asset or a hidden risk that comps aren't pricing in. Stress-test before assuming the spread holds.
Location & tenants
- Location reads 80/100 on livability (#31 in TX, #1,616 nationally) — a professional / high-income tenant draw. Strengths: amenities A+, commute A+, cost of living A+; Watch: crime F.
- Judson ISD (suburban): math 21% / reading 33% proficiency, ranked #660 of 826 in TX (top 80%) — low school quality limits family demand, transient renter base, plan for 1-2y turnover.
- Zoned schools: Converse El (math 21% / reading 30%, grade F, #2,982 of 4,322 statewide, top 70%, 604 students, 63% FRL); Karen Wagner H S (math 12% / reading 29%, grade F, #1,389 of 1,632 statewide, top 86%, 2,366 students, 80% FRL).
- Market conditions: Rents soft (-1.1%/yr); 1208 active listings in the ZIP; 40 comparable units currently listed for rent nearby; rentals at typical pace (median 18d on market — plan ~3-4 weeks tenant-placement turnaround); solid renter incomes; 8,308 units permitted in Bexar County in 2024 (2,506 in 5+ unit buildings).
Forward outlook
- Local home prices are declining (-3.0%/yr); year-one equity from $1k of loan paydown is wiped out by about $5k of value loss. Plan a longer hold.
- Bexar County population projected at +50% by 2050 — long-run rental-demand tailwind backs the buy-and-hold thesis.
Negotiation context
- Only 14 days on market — expect competitive offers; lowballing is unlikely to land.
- 4 sale attempts since 14y ago with the ask held roughly flat each time — persistent listings suggest the price (not the market) is what's stuck; bring a comps-based counter.
Risks & watch-outs
- Climate carrying-cost: severe wind risk, 80% chance of damaging wind over 30y; extreme-heat days projected 7→22/yr by 2055 (HVAC capex compounding) — expect insurance premiums to compound above CPI over the hold.
Questions for the listing agent
- What does the HOA fee cover, when was the last increase, and are there any pending special assessments or reserve-fund shortfalls?
- Is there a deadline driving the sale (1031 exchange, divorce, estate, relocation)? That informs how much negotiation room exists.
- Crime grade is F in this area — have there been break-ins, vandalism, or insurance claims at this property in the last 3 years? What carrier currently insures it and at what premium?
- What's the average days-on-market for RENTAL listings here right now (not sales)? A rising rental-DOM trend means longer vacancies and softer asking-rent achievability than the comps imply.
- What's the recent tenant-quality profile in this submarket — average credit score on applications, eviction rate, late-payment / NSF rate, and stable-employment percentage? A property-management company in the area should have these aggregated.
- How much new for-sale + rental construction is in the pipeline within 1–3 miles? Heavy new supply typically softens prices + rents 12–24 months out; constrained supply supports both.
Investment metrics
- 1% rule
- 1.02% ✓
- Cap rate
- 6.71%
- Cash-on-cash
- 1.49%
- DSCR
- 1.07
- GRM
- 8.1
CMA / ARV
- ARV (median comp)
- $229,722
- List price
- $169,950
- Delta
- -26.02%
- Verdict
- UNDERPRICED
- Comps
- 20 within 1.0 mi
Show comp detail 8 sales within ~0.75 mi
| Address | Dist | Beds/Ba | Sqft | Sold | Price | $/sf | Match |
|---|---|---|---|---|---|---|---|
| 4039 Mistflower | 0.00mi | 3/2.0 | 1,259 (0%) | 1mo | $169,950 | $135 | 99 |
| 3850 Key West | 0.36mi | 3/2.0 | 1,168 (-7%) | 2mo | $215,000 | $184 | 70 |
| 8830 Trumpet Cir | 0.37mi | 3/2.0 | 1,208 (-4%) | 15mo | $220,000 | $182 | 64 |
| 3842 Bogie Way | 0.47mi | 3/2.0 | 1,264 (+0%) | 21mo | $240,000 | $190 | 60 |
| 7923 Brinson Ct | 0.57mi | 3/2.0 | 1,246 (-1%) | 17mo | $245,000 | $197 | 57 |
| 8317 Kinclaven Ct | 0.23mi | 3/2.0 | 1,417 (+12%) | 18mo | $239,950 | $169 | 54 |
| 8530 Trumpet Cir | 0.23mi | 3/2.0 | 1,436 (+14%) | 18mo | $219,000 | $153 | 50 |
| 4018 Matson Mnr | 0.67mi | 3/2.0 | 1,430 (+14%) | 8mo | $236,500 | $165 | 40 |
Match score weights: distance 35% · size 25% · config 20% · recency 20%. Top-matched comps best support the ARV.
Projected returns pro-forma
-3.0% appreciation · 0.0% rent growth · sell at horizon
- IRR
- -17.7%
- Equity multiple
- 0.40×
- Total profit
- $-28,757
- Equity at exit
- $25,340
- IRR
- -17.9%
- Equity multiple
- 0.17×
- Total profit
- $-39,429
- Equity at exit
- $14,694
Cash invested: $47,586 (down + closing). Projections, not guarantees.
Landlord ↔ Tenant lean methodology
- Overall (STATE)
- 87 Strongly Landlord-Friendly
- State Texas
- 87 Strongly Landlord-Friendly · R+5
- County
- — inherits STATE
- City
- — inherits STATE
ZIP-level market 78109
- Home prices YoY
- -17.8%
- Rents YoY
- -1.1%
- Active inventory
- 1208
- Price-to-rent
- 8.1×
Monthly cashflow live
- Estimated rent
- $1,739 high interval (Pro) →
- Mortgage (P&I)
- −$891
- Tax from tax record
- −$329 /mo · $3,954/yr
- Insurance
- −$71
- HOA
- −$23
- Vacancy / Maint / Mgmt
- −$365
- Net cashflow
- $59
Break-even live
Sensitivity live
| Price | -10% $155 | -5% $107 | +0% $59 | +5% $11 | +10% $-37 |
|---|---|---|---|---|---|
| Rent | -10% $-78 | -5% $-10 | +0% $59 | +5% $128 | +10% $196 |
| Rate | -1.0pp $145 | -0.5pp $102 | base $59 | +0.5pp $15 | +1.0pp $-30 |
UW: 25.0% down · 7.5% · 30yr · 1.5% tax · 5.0% vac · 8.0% maint · 8.0% mgmt
Financing live
Cash to close
- Down payment
- $42,488
- Closing costs
- $5,098
- Reserves months
- —
- Total cash needed
- —
Loan-product check · same deal, 3 products live
Conventional
25% down · 7.5% · 30yr
- Down + closing
- —
- Monthly P&I
- —
- Monthly cashflow
- —
- DSCR
- —
- Eligible?
- —
Personal DTI + credit; lowest rate.
DSCR
20% down · 8.5% · 30yr
- Down + closing
- —
- Monthly P&I
- —
- Monthly cashflow
- —
- DSCR
- —
- Eligible?
- —
No personal income docs; deal must DSCR.
Hard money
10% down · 12.0% · 12mo
- Down + closing
- —
- Monthly P&I
- —
- Monthly cashflow
- —
- DSCR
- —
- Eligible?
- —
Short-term bridge; refi at stabilization.
Rent comps 40 comps
| Address | Beds | Baths | Sqft | Rent | $/sqft | DOM | Units | Dist |
|---|---|---|---|---|---|---|---|---|
| 8422 Cherisse Dr Converse, TX | 3.0 | 2.0 | 1436 | $1,736 | $1.21 | 5d | 1 | 0.12mi |
| 8514 Whitebrush Converse, TX | 3.0 | 2.0 | 1535 | $1,700 | $1.11 | 25d | 1 | 0.15mi |
| 8411 Crinum Lily Dr Converse, TX | 3.0 | 2.0 | 1259 | $1,550 | $1.23 | 25d | 1 | 0.17mi |
| 8423 Snakeweed Dr Unit 1 Converse, TX | 3.0 | 2.0 | 1668 | $1,500 | $0.90 | 45d | 1 | 0.22mi |
| 8519 Snakeweed Dr Converse, TX | 3.0 | 2.0 | 1259 | $1,450 | $1.15 | 13d | 1 | 0.29mi |
| 8439 Blackstone Cv Converse, TX | 3.0 | 2.0 | 1208 | $1,550 | $1.28 | 45d | 1 | 0.35mi |
| 3851 Bacall Way Converse, TX | 3.0 | 2.0 | 1168 | $1,650 | $1.41 | 5d | 1 | 0.39mi |
| 3950 West Way Key W Converse, TX | 3.0 | 2.0 | 1124 | $1,550 | $1.38 | 12d | 1 | 0.40mi |
| 8611 Key Windy Way Unit 2 Converse, TX | 3.0 | 2.5 | 1514 | $1,850 | $1.22 | 3d | 1 | 0.40mi |
| 8611 Key Windy Way Unit 2 Converse, TX | 3.0 | 2.5 | 1514 | $1,850 | $1.22 | 45d | 1 | 0.40mi |
| 8411 Favero Cv Converse, TX | 4.0 | 2.0 | 1668 | $1,695 | $1.02 | 45d | 1 | 0.45mi |
| 8639 Key Windy Way Unit 1 Converse, TX | 3.0 | 2.5 | 1225 | $1,475 | $1.20 | 25d | 1 | 0.46mi |
| 8639 Key Windy Way Converse, TX | 3.0 | 2.5 | 1225 | $1,475 | $1.20 | 5d | 1 | 0.46mi |
| 4931 Badland Beacon Converse, TX | 3.0 | 2.0 | 1509 | $1,625 | $1.08 | 45d | 1 | 0.59mi |
| 5118 Everett Loop Converse, TX | 4.0 | 2.0 | 1635 | $1,599 | $0.98 | 16d | 1 | 0.72mi |
| 8902 Grand Western Converse, TX | 3.0 | 2.5 | 1570 | $1,995 | $1.27 | 45d | 1 | 0.75mi |
| 8511 Amistad Cv Converse, TX | 3.0 | 2.0 | 1440 | $1,479 | $1.03 | 5d | 1 | 0.78mi |
| 8833 Binz Engleman Rd Unit 710 Converse, TX | 2.0 | 2.0 | 1097 | $950 | $0.87 | 4d | 1 | 0.78mi |
| 7703 Redstone Mnr Converse, TX | 3.0 | 2.0 | 1656 | $1,750 | $1.06 | 25d | 1 | 0.79mi |
| 8555 Barefoot Ln Converse, TX | 3.0 | 2.5 | 1780 | $2,050 | $1.15 | 25d | 1 | 0.83mi |
| 7715 Shining Glow San Antonio, TX | 3.0 | 2.5 | 1554 | $1,529 | $0.98 | 17d | 1 | 0.86mi |
| 7715 Shining Glow San Antonio, TX | 3.0 | 2.5 | 1554 | $1,499 | $0.96 | 4d | 1 | 0.86mi |
| 9026 Bowring Park Converse, TX | 3.0 | 2.0 | 1721 | $1,795 | $1.04 | 45d | 1 | 0.88mi |
| 9110 Longhorn Park Converse, TX | 3.0 | 2.0 | 1646 | $1,675 | $1.02 | 17d | 1 | 0.89mi |
| 9110 Longhorn Park Converse, TX | 3.0 | 2.0 | 1646 | $1,675 | $1.02 | 13d | 1 | 0.89mi |
| 7718 Burro Bnd San Antonio, TX | 3.0 | 2.5 | 1547 | $1,650 | $1.07 | 4d | 1 | 0.89mi |
| 5475 Bluebell Mdw Converse, TX | 3.0 | 2.5 | 1605 | $1,695 | $1.06 | 45d | 1 | 0.89mi |
| 5514 Soothing Water San Antonio, TX | 3.0 | 2.5 | 1700 | $1,750 | $1.03 | 4d | 1 | 0.94mi |
| 4715 Appaloosa Run San Antonio, TX | 3.0 | 2.5 | 1774 | $1,595 | $0.90 | 17d | 1 | 0.95mi |
| 5622 Rowan Rdg Converse, TX | 3.0 | 2.0 | 1412 | $1,625 | $1.15 | 25d | 1 | 0.97mi |
| 5622 Rowan Rdg Converse, TX | 3.0 | 2.0 | 1412 | $1,625 | $1.15 | 16d | 1 | 0.97mi |
| 5431 Rue Girard Converse, TX | 3.0 | 2.5 | 1605 | $1,700 | $1.06 | 25d | 1 | 0.99mi |
| 5107 Hornbeck Hts Converse, TX | 3.0 | 2.0 | 1266 | $1,496 | $1.18 | 5d | 1 | 0.99mi |
| 5439 Rue Girard Converse, TX | 3.0 | 2.5 | 1826 | $2,400 | $1.31 | 25d | 1 | 1.00mi |
| 4326 Stanley Park Converse, TX | 3.0 | 2.0 | 1484 | $1,650 | $1.11 | 3d | 1 | 1.00mi |
| 5631 Pearl Mdw Converse, TX | 3.0 | 2.0 | 1410 | $1,500 | $1.06 | 25d | 1 | 1.01mi |
| 5135 Fowler Crst Converse, TX | 3.0 | 2.0 | 1266 | $1,950 | $1.54 | 5d | 1 | 1.01mi |
| 5814 Lilac Lndg Converse, TX | 3.0 | 2.0 | 1532 | $1,775 | $1.16 | 5d | 1 | 1.01mi |
| 9115 Griffith Run Converse, TX | 3.0 | 2.0 | 1266 | $1,521 | $1.20 | 45d | 1 | 1.02mi |
| 7811 Caballo Cyn San Antonio, TX | 3.0 | 2.5 | 1547 | $1,460 | $0.94 | 5d | 1 | 1.02mi |
HOA detail
- Monthly dues
- $23 · $276/yr
- Likely covers
- gaslandscapingpool
Listing history 12 events
-
2026-05-12status Pending 869-char remark
-
2026-05-02historical Active Option 869-char remark
-
2026-04-28$169,950 New 869-char remark
-
2025-12-09historical
-
2025-10-01price $199,950
-
2025-08-26$219,950 New
-
2025-07-25historical $1,595
-
2024-11-01$1,595
-
2012-08-31soldstatus
-
2012-08-29soldstatus
Show marketing remark (496 chars)
*Feel Welcome Here!* Immaculate home, well cared for by original owner. Spacious kitchen with gas cooking will please the family chef. Utility area located inside. Enjoy relaxing on the "country style" front porch or back patio. Gardener's will love the mature landscaping including fruit trees. Located in a family friendly neighborhood with easy commute to Ft. Sam, Randolph A.F.B., and Downtown. Neighborhood pool and recreation area. Beautiful home for the simple lifestyle!
-
2012-07-21historical
Show marketing remark (496 chars)
*Feel Welcome Here!* Immaculate home, well cared for by original owner. Spacious kitchen with gas cooking will please the family chef. Utility area located inside. Enjoy relaxing on the "country style" front porch or back patio. Gardener's will love the mature landscaping including fruit trees. Located in a family friendly neighborhood with easy commute to Ft. Sam, Randolph A.F.B., and Downtown. Neighborhood pool and recreation area. Beautiful home for the simple lifestyle!
-
2012-04-13$99,000
Show marketing remark (496 chars)
*Feel Welcome Here!* Immaculate home, well cared for by original owner. Spacious kitchen with gas cooking will please the family chef. Utility area located inside. Enjoy relaxing on the "country style" front porch or back patio. Gardener's will love the mature landscaping including fruit trees. Located in a family friendly neighborhood with easy commute to Ft. Sam, Randolph A.F.B., and Downtown. Neighborhood pool and recreation area. Beautiful home for the simple lifestyle!
ⓘ Source: listings_history table (triggers on properties + properties_extension) + one-shot
backfill from property_details.listing_events for pre-trigger history.
Tax reassessment forecast TX · Resets to sale price
- Current annual tax
- $3,954 · $329/mo
- Projected year-2 tax
- $3,954 · $329/mo
- Expected delta
- $0/yr ($0/mo · 0.0%)
ⓘ Screening estimate from a state-policy table — verify with the county assessor before closing.
Climate risk First Street
- Flood 1/10 Low FEMA zone X (unshaded) · 0% chance over 30 yrs
- Wildfire 4/10 Moderate
- Heat 8/10 Severe 7 d/yr ≥108°F today · 22 d/yr by 30 yrs out
- Wind 8/10 Severe 80% chance of damaging wind over 30 yrs
- Air quality 1/10 Low 0 unhealthy d/yr today · 0 by 30 yrs out
Nearby sold comps map
Loading sold comps map…
Walkable amenities ~0.75 mi
Loading nearby amenities…
Taxation est. · year 1
- Rental income
- $20,866
- − Mortgage interest
- −$9,520
- − Property taxes
- −$3,954
- − Insurance
- −$850
- − Repairs & maintenance
- −$1,669
- − Management
- −$1,669
- − HOA
- −$276
- − Depreciation
- −$4,944
- Taxable loss
- −$2,016
- Est. tax savings @ 24.0%
- +$484
- After-tax cash flow
- $1,193/yr
For passive investors: Depreciation is non-cash, so a rental often shows a tax loss while cash-flowing — sheltering income. Rental losses are passive: they offset passive income freely, and up to $25,000/yr can offset ordinary (W-2) income if you actively participate and your MAGI is under $100k (phasing out to $0 by $150k); unused losses carry forward. On sale, claimed depreciation is recaptured at up to 25%, and gains may owe capital-gains tax (a 1031 exchange can defer both). Figures are a year-1 estimate at your 24.0% rate — not tax advice; consult a CPA.
Schools (NCES district)
- District
- Judson ISD
- NCES district ID
- 4824990
- Math proficiency
- 21% ▼ -21.00%
- Reading proficiency
- 33% ▼ -7.00%
- Median HH income
- $57,542
- Composite
- 24.39/100
- National rank
- #7689
- State rank
- #660 of 826 in TX
Livability — San Antonio
- Score
- 80/100
- State rank
- #31
- US rank
- #1616
Category grades
Schools grade is shown separately in the Schools card above.
Census & demographics
- County
- Bexar County · 1,990,555 people
- City population
- 1,806,925
- Metro
- San Antonio-New Braunfels, TX
- Population (ZIP)
- 63,067
- Household income
- $91,320
- Rent vs Own
- Severe rent burden
- 1732.0
Population outlook (Bexar County) Hauer SSP2
- Today (2025)
- 2,336,851 people
- By 2030
- 2,560,728 · +9.6%
- By 2040
- 3,020,569 · +29.3%
- By 2050
- 3,493,522 · +49.5%
- By 2075
- 4,668,459 · +99.8%
- By 2100
- 5,533,242 · +136.8%
Race, ethnicity, and origin ACS 2023
- Neighborhood character
- Diverse neighborhood (Simpson 0.69)
- Race & ethnicity
- Hispanic / Latino 44% White 27% Two or more races 21% Black 21% Asian 3%
- Hispanic origin (detail)
- Mexican 29% Puerto Rican 4%
- Common ancestry
- Lithuanian 1% Romanian 1% Italian 1%
- Foreign-born
- 11% · Canada, Vietnam, South Korea
- Languages at home
- 71% English-only · Spanish 23% Tagalog/Filipino 1% Other Asian/Pacific 1%
Political lean MEDSL · Bexar
- 2024 margin
- Lean D (+9.8) · D 54.3% · R 44.6% · Other 1.1%
- 2008→2024 swing
- +4.2pp toward D · 2008: 5.6pp · 2024: 9.8pp
- All cycles
- 2024: D+9.8 2020: D+18.2 2016: D+13.5 2012: D+4.6 2008: D+5.6
Not yet ingested
- Civics
- —
Market trends
- HPI YoY
- ▼ -51.02%
- Current HPI
- 236.4923
- Rent YoY
- ▼ -1.08%
- Metro
- San Antonio-New Braunfels, TX
- State GDP YoY
- ▲ 3.95%
- F500 in state
- 110
Industry mix (Fortune 500 HQ in TX)
| Industry | F500 HQs | Revenue |
|---|---|---|
| Energy | 16 | $1,198B |
|
||
| Technology | 5 | $198B |
|
||
| Engineering / Construction | 4 | $72B |
|
||
| Energy Services | 3 | $60B |
|
||
| Utilities | 3 | $41B |
|
||
| Healthcare | 2 | $330B |
|
||
Price history
+71.7% since first listed14 events — show timeline
- 2026-05-28 Sold (MLS) — LERA
- 2026-05-28 Sold (Public Records) — Public Records
- 2026-05-12 Pending — LERA
- 2026-05-02 Contingent — LERA
- 2026-04-28 Listed $169,950 LERA
- 2025-12-09 Listing Removed — LERA
- 2025-10-01 Price Changed $199,950 LERA
- 2025-08-26 Listed $219,950 LERA
- 2025-07-25 Rental Removed $1,595 APPFOLIO
- 2024-11-01 Listed for Rent $1,595 APPFOLIO
- 2012-08-31 Sold (Public Records) — Public Records
- 2012-08-29 Sold (MLS) — LERA
- 2012-07-21 Listing Removed — LERA
- 2012-04-13 Listed $99,000 LERA
Property tax history
+13.2%/yrLatest (2025): $3,954 · +0.5% YoY. Source: county tax records.
Cash-flow waterfall
monthlySold comps — $/sqft
last 12 mo · ≤1 miLoading sold comps…