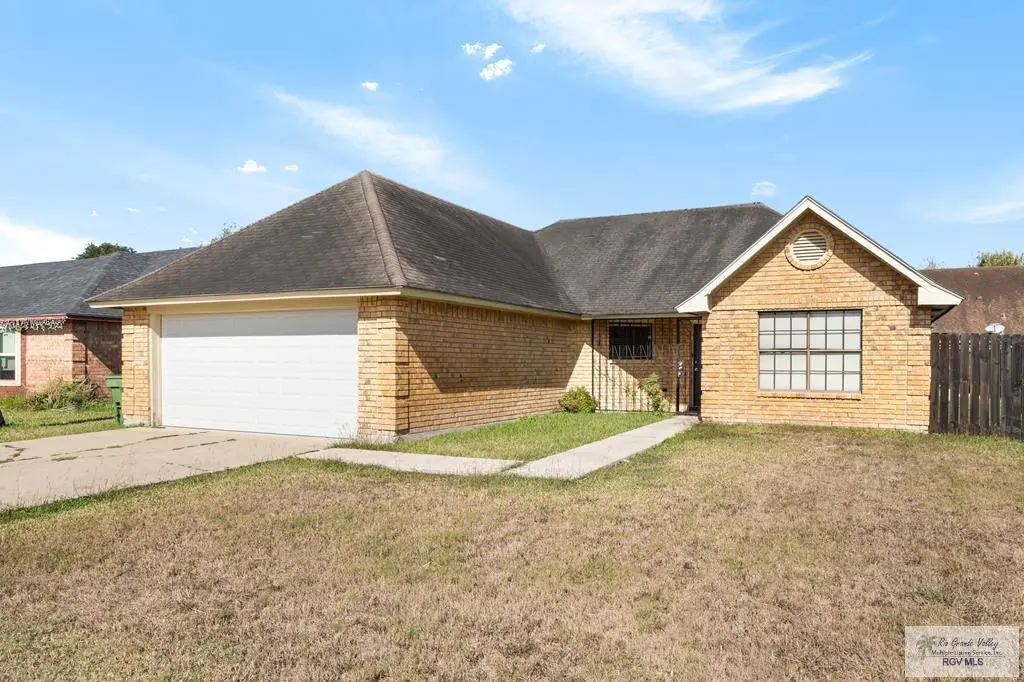
1545 Capistrano Dr #12 · Brownsville, TX
Flood risk 1/10 · Minimal
- FEMA flood zone
- X (shaded)
- Chance of flooding over 30 yrs
- 0.0%
- Est. flood insurance / yr
- $507 – $1,088
Fire risk 4/10 · Minor
- Est. fire insurance / yr
- $1,222 – $2,270
Heat risk 9/10 · Severe
- Hot days now (above 110°F)
- 7 days/yr
- Hot days in 30 yrs
- 25 days/yr
Wind risk 9/10 · Severe
- Chance of severe wind over 30 yrs
- 99.0%
Air-quality risk 2/10 · Minimal
- Unhealthy air days now
- 1 days/yr
- Unhealthy air days in 30 yrs
- 1 days/yr
Risk factors via First Street. Map © Google.
Why this score? — see what drove the D grade
The composite is a weighted blend of 9 inputs, each scored 0–100. Each bar is that input's sub-score; the figure is the points it added to the 100-point composite (weight × sub-score).
- ARV discount +12.2/15.0
- Cash flow +12.1/30.0
- Livability +4.0/5.0
- DSCR +3.6/10.0
- 1% rule +3.5/10.0
- Rent growth +3.2/5.0
- Schools +2.2/10.0
- Condition / age +2.2/5.0
- Appreciation +0.0/10.0
$255,000
🖨 Deal sheet (PDF) 📄 Offer letter ✓ Due diligence
Listing remarks
Excellent Opportunity in Mission Trails! This 3-bedroom, 2-bath home offers 1,650 sq ft of living space on a 0.17-acre lot with an in-ground pool and covered patio. Conveniently located near major roads, shopping, dining, and schools. Property is currently tenant occupied; however, tenant has agreed to vacate after an accepted contract, making this an excellent option for both owner-occupants and investors. Showings by appointment only.
Key facts
- In-ground pool
- Covered patio
- 7,300 sq ft lot
Tags
Property features AI
Exterior
- Parking: Attached 2-car garage
- Security: Smoke detector(s)
- Utilities: Public sewer
- Home design: Single-family residence (house); One story
- Construction: Brick veneer and stone exterior; Composition roof; Slab foundation; Built with residential construction materials
- Exterior features: Covered patio/porch; In-ground pool; Lot approximately 0.17 acres
Interior
- Flooring: Tile
- Bathrooms: 2 full bathrooms; 1 half bathroom
- Heating & cooling: Central heating; Central air; Ceiling fan(s)
- Interior features: Electric water heater; Tile flooring
Neighborhood map
What this means for you Summary
Snapshot
- This is a 3-bed/2.5-bath single-family listed at $255k. Condition is rated fair.
Deal economics
- At list price, monthly cash flow is $-57 ($-683/yr) — negative.
- To cash-flow at today's rent, offer at most $247k (3.2% below list).
- To meet the 1% rule (rent ≥ 1% of price), the offer needs to be $216k (15.3% below list).
- Recommended offer: $216k (15.3% below list) — sets the bar for 1% rule.
- Cap rate 6.0% vs local median 5.0% in Brownsville — meaningfully above typical; check what's discounted (condition, days-on-market, listing class) to confirm the premium yield is real.
Location & tenants
- Location reads 79/100 on livability (#62 in TX, #2,311 nationally) — a middle-class / working-renter tenant base. Strengths: commute A+, cost of living A+, housing A+; Watch: amenities D, crime D-, employment F.
- Brownsville ISD (urban): math 20% / reading 34% proficiency, ranked #710 of 826 in TX (top 86%) — low school quality limits family demand, transient renter base, plan for 1-2y turnover; 83% free/reduced lunch — lower-income household profile, screen leases tightly.
- Zoned schools: Burns El (math 22% / reading 27%, grade F, #3,052 of 4,322 statewide, top 74%, 604 students, 92% FRL); Vela Middle (math 19% / reading 37%, grade F, #1,143 of 1,662 statewide, top 69%, 638 students, 82% FRL); Hanna Early College H S (math 24% / reading 49%, grade F, #924 of 1,632 statewide, top 57%, 2,246 students, 88% FRL) — zoned schools at 87% FRL track the district average.
- Market conditions: Rents rising (+2.8%/yr); 416 active listings in the ZIP; 32 comparable units currently listed for rent nearby; rentals at typical pace (median 24d on market — plan ~3-4 weeks tenant-placement turnaround); 2,326 units permitted in Cameron County in 2024 (503 in 5+ unit buildings).
- This rent runs 37% of the median local income ($71k/yr) — at the standard rent-burdened threshold; future hikes will face affordability resistance.
Forward outlook
- Local home prices are declining (-3.0%/yr); year-one equity from $2k of loan paydown is wiped out by about $8k of value loss. Plan a longer hold.
- Cameron County population projected at +3% by 2050 — modest demand growth; plan on rents tracking national, not racing it.
Negotiation context
- It's been on market 24 days — a 2% lower offer ($251k) is reasonable based on typical stale-listing flexibility.
- 2 sale attempts with the ask held roughly flat each time — persistent listings suggest the price (not the market) is what's stuck; bring a comps-based counter.
Risks & watch-outs
- Climate carrying-cost: severe wind risk, 99% chance of damaging wind over 30y; extreme-heat days projected 7→25/yr by 2055 (HVAC capex compounding) — expect insurance premiums to compound above CPI over the hold.
Questions for the listing agent
- What do current leases actually rent for vs. the listed asking? Can we see a recent rent roll and the last 12 months of T-12 income?
- Have any recent inspections been done? Can we get a copy of the seller's disclosures and any deferred-maintenance estimates?
- Is there a deadline driving the sale (1031 exchange, divorce, estate, relocation)? That informs how much negotiation room exists.
- Crime grade is D in this area — have there been break-ins, vandalism, or insurance claims at this property in the last 3 years? What carrier currently insures it and at what premium?
- The area grade is low — what's the realistic commute time and amenity access for the typical tenant pool here? Any planned neighborhood developments (good or bad) we should know about?
- What's the average days-on-market for RENTAL listings here right now (not sales)? A rising rental-DOM trend means longer vacancies and softer asking-rent achievability than the comps imply.
- What's the recent tenant-quality profile in this submarket — average credit score on applications, eviction rate, late-payment / NSF rate, and stable-employment percentage? A property-management company in the area should have these aggregated.
- How much new for-sale + rental construction is in the pipeline within 1–3 miles? Heavy new supply typically softens prices + rents 12–24 months out; constrained supply supports both.
Investment metrics
- 1% rule
- 0.85% ✗
- Cap rate
- 6.03%
- Cash-on-cash
- -0.96%
- DSCR
- 0.96
- GRM
- 9.8
CMA / ARV
- ARV (median comp)
- $284,655
- List price
- $255,000
- Delta
- -10.44%
- Verdict
- UNDERPRICED
- Comps
- 17 within 2.0 mi
Show comp detail 5 sales within ~0.75 mi
| Address | Dist | Beds/Ba | Sqft | Sold | Price | $/sf | Match |
|---|---|---|---|---|---|---|---|
| 4840 Larkspur Dr | 0.30mi | 3/2.0 | 1,591 (-4%) | 6mo | $245,500 | $154 | 73 |
| 4731 Larkspur Ave | 0.27mi | 3/2.0 | 1,779 (+8%) | 13mo | $240,000 | $135 | 62 |
| 1558 Guadalajara Ave | 0.32mi | 3/2.0 | 1,581 (-4%) | 17mo | $249,000 | $157 | 62 |
| 4951 Daffodil Dr | 0.23mi | 3/2.0 | 1,498 (-9%) | 16mo | $239,500 | $160 | 59 |
| 987 Paso Del Rio Dr | 0.67mi | 3/2.0 | 1,457 (-12%) | 21mo | $199,999 | $137 | 30 |
Match score weights: distance 35% · size 25% · config 20% · recency 20%. Top-matched comps best support the ARV.
Projected returns pro-forma
-3.0% appreciation · 2.77% rent growth · sell at horizon
- IRR
- -18.1%
- Equity multiple
- 0.36×
- Total profit
- $-45,412
- Equity at exit
- $38,021
- IRR
- -10.8%
- Equity multiple
- 0.35×
- Total profit
- $-46,115
- Equity at exit
- $22,048
Cash invested: $71,400 (down + closing). Projections, not guarantees.
Landlord ↔ Tenant lean methodology
- Overall (STATE)
- 87 Strongly Landlord-Friendly
- State Texas
- 87 Strongly Landlord-Friendly · R+5
- County
- — inherits STATE
- City
- — inherits STATE
ZIP-level market 78526
- Home prices YoY
- -12.1%
- Rents YoY
- 2.8%
- Active inventory
- 416
- Price-to-rent
- 9.8×
Monthly cashflow live
- Estimated rent
- $2,159 high interval (Pro) →
- Mortgage (P&I)
- −$1,337
- Tax est. 1.5%
- −$319 /mo · $3,825/yr
- Insurance
- −$106
- HOA
- −$0
- Lot rent
- −$0
- Vacancy / Maint / Mgmt
- −$453
- Net cashflow
- $-57
Break-even live
Sensitivity live
| Price | -10% $119 | -5% $31 | +0% $-57 | +5% $-145 | +10% $-233 |
|---|---|---|---|---|---|
| Rent | -10% $-227 | -5% $-142 | +0% $-57 | +5% $28 | +10% $114 |
| Rate | -1.0pp $72 | -0.5pp $8 | base $-57 | +0.5pp $-123 | +1.0pp $-190 |
UW: 25.0% down · 7.5% · 30yr · 1.5% tax · 5.0% vac · 8.0% maint · 8.0% mgmt
Financing live
Cash to close
- Down payment
- $63,750
- Closing costs
- $7,650
- Reserves months
- —
- Total cash needed
- —
Loan-product check · same deal, 3 products live
Conventional
25% down · 7.5% · 30yr
- Down + closing
- —
- Monthly P&I
- —
- Monthly cashflow
- —
- DSCR
- —
- Eligible?
- —
Personal DTI + credit; lowest rate.
DSCR
20% down · 8.5% · 30yr
- Down + closing
- —
- Monthly P&I
- —
- Monthly cashflow
- —
- DSCR
- —
- Eligible?
- —
No personal income docs; deal must DSCR.
Hard money
10% down · 12.0% · 12mo
- Down + closing
- —
- Monthly P&I
- —
- Monthly cashflow
- —
- DSCR
- —
- Eligible?
- —
Short-term bridge; refi at stabilization.
Rent comps 32 comps
| Address | Beds | Baths | Sqft | Rent | $/sqft | DOM | Units | Dist |
|---|---|---|---|---|---|---|---|---|
| 4951 Daffodil Dr Brownsville, TX | 3.0 | 2.0 | 1498 | $2,400 | $1.60 | 23d | 1 | 0.23mi |
| 4951 Daffodil Dr Brownsville, TX | 3.0 | 2.0 | 1498 | $2,400 | $1.60 | 46d | 1 | 0.23mi |
| 1587 Pinion Dr Brownsville, TX | 3.0 | 2.0 | 1226 | $1,750 | $1.43 | 46d | 1 | 0.27mi |
| 1315 Pinion Dr Brownsville, TX | 3.0 | 2.0 | 1600 | $1,950 | $1.22 | 46d | 1 | 0.31mi |
| 4883 Camino Verde Dr Brownsville, TX | 3.0 | 2.0 | 1302 | $1,800 | $1.38 | 23d | 1 | 0.35mi |
| 2066 Saketa Ln Brownsville, TX | 3.0 | 2.0 | 1184 | $1,700 | $1.44 | 16d | 1 | 0.41mi |
| 2018 Diamond Dr Unit A Brownsville, TX | 2.0 | 2.5 | 1465 | $1,750 | $1.19 | 46d | 1 | 0.46mi |
| 2019 Diamond Dr Unit B Brownsville, TX | 3.0 | 2.5 | 1565 | $1,950 | $1.25 | 23d | 1 | 0.47mi |
| 2011 Diamond Dr Unit A Brownsville, TX | 2.0 | 2.5 | 1465 | $2,900 | $1.98 | 23d | 1 | 0.48mi |
| 1653 W San Marcelo Blvd Brownsville, TX | 3.0 | 2.0 | 1212 | $1,700 | $1.40 | 23d | 1 | 0.51mi |
| 1124 Sierra Grande Dr Brownsville, TX | 3.0 | 2.0 | 1308 | $1,599 | $1.22 | 23d | 1 | 0.52mi |
| 1683 Artemisa Ave Brownsville, TX | 3.0 | 2.0 | 1717 | $1,950 | $1.14 | 23d | 1 | 0.53mi |
| 1044 Alta Mesa Blvd Brownsville, TX | 3.0 | 2.0 | 1276 | $1,700 | $1.33 | 16d | 1 | 0.57mi |
| 4874 Espada Grande Ave Brownsville, TX | 4.0 | 2.5 | 2215 | $3,300 | $1.49 | 23d | 1 | 0.64mi |
| 944 Alta Mesa Blvd Brownsville, TX | 3.0 | 2.0 | 1582 | $1,900 | $1.20 | 23d | 1 | 0.69mi |
| 2107 Carlos Ave Unit A Brownsville, TX | 3.0 | 2.0 | 1500 | $1,500 | $1.00 | 16d | 1 | 0.71mi |
| 5771 Greenwood Dr Brownsville, TX | 3.0 | 2.0 | 1881 | $1,950 | $1.04 | 46d | 1 | 0.92mi |
| 5871 Greenwood Dr Brownsville, TX | 3.0 | 2.5 | 1820 | $1,950 | $1.07 | 16d | 1 | 0.97mi |
| 6732 Stone Oak Brownsville, TX | 3.0 | 2.0 | 1786 | $2,300 | $1.29 | 16d | 1 | 0.99mi |
| 6601 Garden Woods Ave Brownsville, TX | 3.0 | 2.0 | 1291 | $1,600 | $1.24 | 46d | 1 | 1.04mi |
| 124 Barcelona Ave Brownsville, TX | 3.0 | 2.0 | 1708 | $2,900 | $1.70 | 23d | 1 | 1.07mi |
| 15 Valles Ct Brownsville, TX | 3.0 | 2.0 | 1715 | $2,350 | $1.37 | 16d | 1 | 1.23mi |
| 6978 Heritage Oak Dr Brownsville, TX | 3.0 | 2.0 | 1476 | $2,250 | $1.52 | 23d | 1 | 1.30mi |
| 2100 W San Marcelo Blvd Brownsville, TX | 2.0–3.0 | 2.0–2.5 | 1069 | $1,500 | $1.40 | 46d | 2 | 1.32mi |
| 3247 Noble Dr Brownsville, TX | 3.0 | 2.0 | 1800 | $2,000 | $1.11 | 23d | 1 | 1.33mi |
| 3330 Calle Bolivia Brownsville, TX | 3.0 | 2.5 | 2090 | $2,550 | $1.22 | 46d | 1 | 1.34mi |
| 6705 Garden Woods Ave Unit B Brownsville, TX | 3.0 | 2.0 | 1350 | $1,550 | $1.15 | 16d | 1 | 1.43mi |
| 7073 Heritage Oak Dr Brownsville, TX | 4.0 | 3.5 | 2204 | $3,400 | $1.54 | 46d | 1 | 1.44mi |
| 2034 Toluca Dr Brownsville, TX | 3.0 | 2.0 | 1669 | $2,000 | $1.20 | 23d | 1 | 1.44mi |
| 35 La Paz Ct Brownsville, TX | 3.0 | 2.5 | 1660 | $1,900 | $1.14 | 16d | 1 | 1.48mi |
| 501 Geraldine Ln Brownsville, TX | 4.0 | 2.0 | 1615 | $1,900 | $1.18 | 23d | 1 | 1.48mi |
| 3278 Calle Argentina Brownsville, TX | 4.0 | 2.0 | 1639 | $1,950 | $1.19 | 46d | 1 | 1.49mi |
Listing history 22 events
-
2026-06-22days on market $255,000 Active 24 DOM
-
2026-06-18days on market $255,000 Active 21 DOM
-
2026-06-17days on market $255,000 Active 20 DOM
-
2026-06-16days on market $255,000 Active 19 DOM
-
2026-06-15days on market $255,000 Active 18 DOM
-
2026-06-14days on market $255,000 Active 16 DOM
-
2026-06-13days on market $255,000 Active 15 DOM
-
2026-06-10days on market $255,000 Active 13 DOM
-
2026-06-09days on market $255,000 Active 12 DOM
-
2026-06-08days on market $255,000 Active 11 DOM
-
2026-06-07days on market $255,000 Active 10 DOM
-
2026-06-05days on market $255,000 Active 7 DOM
-
2026-06-03days on market $255,000 Active 6 DOM
-
2026-06-02days on market $255,000 Active 5 DOM
-
2026-06-01days on market $255,000 Active 4 DOM
-
2026-05-31days on market $255,000 Active 3 DOM
-
2026-05-30days on market $255,000 Active 2 DOM
-
2026-02-23historical $2,100
-
2026-02-10price $2,100
-
2026-02-02price $254,950 496-char remark
-
2026-01-27$2,300
-
2026-01-19$259,950 Active 496-char remark
ⓘ Source: listings_history table (triggers on properties + properties_extension) + one-shot
backfill from property_details.listing_events for pre-trigger history.
Climate risk First Street
- Flood 1/10 Low FEMA zone X (shaded) · 0% chance over 30 yrs
- Wildfire 4/10 Moderate
- Heat 9/10 Extreme 7 d/yr ≥110°F today · 25 d/yr by 30 yrs out
- Wind 9/10 Extreme 99% chance of damaging wind over 30 yrs
- Air quality 2/10 Low 1 unhealthy d/yr today · 1 by 30 yrs out
Nearby sold comps map
Loading sold comps map…
Walkable amenities ~0.75 mi
Loading nearby amenities…
Taxation est. · year 1
- Rental income
- $25,904
- − Mortgage interest
- −$14,284
- − Property taxes
- −$3,825
- − Insurance
- −$1,275
- − Repairs & maintenance
- −$2,072
- − Management
- −$2,072
- − Depreciation
- −$7,418
- Taxable loss
- −$5,043
- Est. tax savings @ 24.0%
- +$1,210
- After-tax cash flow
- $527/yr
For passive investors: Depreciation is non-cash, so a rental often shows a tax loss while cash-flowing — sheltering income. Rental losses are passive: they offset passive income freely, and up to $25,000/yr can offset ordinary (W-2) income if you actively participate and your MAGI is under $100k (phasing out to $0 by $150k); unused losses carry forward. On sale, claimed depreciation is recaptured at up to 25%, and gains may owe capital-gains tax (a 1031 exchange can defer both). Figures are a year-1 estimate at your 24.0% rate — not tax advice; consult a CPA.
Condition & rehab AI · 12 photos
This 3-bedroom, 2.5-bath home requires moderate repairs and maintenance to improve its condition and value. Exterior siding and paint are in poor condition, and interior walls and kitchen cabinets need updating.
Repairs flagged
- Major Exterior siding — Significant weathering and discoloration
- Moderate Paint — Fading in some areas
Value-add opportunities
- Both Paint exterior siding — Enhances curb appeal and value
- Both Paint interior walls — Fresh paint improves aesthetics and value
- Both Replace kitchen cabinets — Modern cabinets increase appeal and value
- Both Replace bathroom fixtures — Up-to-date fixtures improve functionality and value
Renovation cost estimate screening
| Repair item | Severity | Est. cost |
|---|---|---|
| Exterior siding · Significant weathering and discoloration | Major | $15,000–50,000 |
| Paint · Fading in some areas | Moderate | $3,000–15,000 |
| Total estimated repair cost · 2 items | $18,000–65,000 |
Value-add ROI direction
- Both Paint exterior siding — Enhances curb appeal and value ↑
- Both Paint interior walls — Fresh paint improves aesthetics and value ↑
- Both Replace kitchen cabinets — Modern cabinets increase appeal and value ↑
- Both Replace bathroom fixtures — Up-to-date fixtures improve functionality and value ↑
ⓘ Cost ranges are severity-bucket heuristics (US national rule-of-thumb). Get contractor quotes + a written scope before underwriting a rehab budget.
Schools (NCES district)
- District
- Brownsville ISD
- NCES district ID
- 4811680
- Math proficiency
- 20% ▼ -36.00%
- Reading proficiency
- 34% ▼ -13.00%
- Median HH income
- $30,490
- Composite
- 21.8/100
- National rank
- #8249
- State rank
- #710 of 826 in TX
Livability — Brownsville
- Score
- 79/100
- State rank
- #62
- US rank
- #2311
Category grades
Schools grade is shown separately in the Schools card above.
Census & demographics
- Census place
- Brownsville, TX
- County
- Cameron County · 310,734 people
- City population
- 212,132
- Metro
- Brownsville-Harlingen, TX
- Population (ZIP)
- 60,012
- Household income
- $70,565
- Rent vs Own
- Severe rent burden
- 1063.0
Population outlook (Cameron County) Hauer SSP2
- Today (2025)
- 441,603 people
- By 2030
- 448,113 · +1.5%
- By 2040
- 456,385 · +3.3%
- By 2050
- 456,294 · +3.3%
- By 2075
- 423,851 · -4.0%
- By 2100
- 342,787 · -22.4%
Race, ethnicity, and origin ACS 2023
- Neighborhood character
- Predominantly Hispanic (93%)
- Race & ethnicity
- Hispanic / Latino 93% Two or more races 45% White 4% Asian 2%
- Hispanic origin (detail)
- Mexican 87%
- Foreign-born
- 25% · Canada, Vietnam
- Languages at home
- 19% English-only · Spanish 79% Tagalog/Filipino 1%
Political lean MEDSL · Cameron
- 2024 margin
- Lean R (+5.8) · D 46.7% · R 52.5%
- 2008→2024 swing
- -34.6pp toward R · 2008: 28.8pp · 2024: -5.8pp
- All cycles
- 2024: R+5.8 2020: D+13.2 2016: D+32.5 2012: D+32.4 2008: D+28.8
Not yet ingested
- Civics
- —
Market trends
- HPI YoY
- ▼ -30.28%
- Current HPI
- 220.5233
- Rent YoY
- ▲ 2.77%
- Metro
- Brownsville-Harlingen, TX
- State GDP YoY
- ▲ 3.95%
- F500 in state
- 110
Industry mix (Fortune 500 HQ in TX)
| Industry | F500 HQs | Revenue |
|---|---|---|
| Energy | 16 | $1,198B |
|
||
| Technology | 5 | $198B |
|
||
| Engineering / Construction | 4 | $72B |
|
||
| Energy Services | 3 | $60B |
|
||
| Utilities | 3 | $41B |
|
||
| Healthcare | 2 | $330B |
|
||
Price history
+10987.0% since first listed5 events — show timeline
- 2026-05-28 Listed $255,000 RGVMLS
- 2026-02-23 Rental Removed $2,100 RGVMLS
- 2026-02-10 Price Changed $2,100 RGVMLS
- 2026-02-02 Price Changed $254,950 RGVMLS
- 2026-01-27 Listed for Rent $2,300 RGVMLS
Cash-flow waterfall
monthlySold comps — $/sqft
last 12 mo · ≤1 miLoading sold comps…