1045 Henry Pl · Angels, CA
Flood risk 1/10 · Minimal
- FEMA flood zone
- X (unshaded)
- Chance of flooding over 30 yrs
- 0.0%
- Est. flood insurance / yr
- $507 – $1,088
Fire risk 8/10 · Major
- Est. fire insurance / yr
- $659 – $1,223
Heat risk 6/10 · Moderate
- Hot days now (above 102°F)
- 6 days/yr
- Hot days in 30 yrs
- 13 days/yr
Wind risk 1/10 · Minimal
- Chance of severe wind over 30 yrs
- —
Air-quality risk 10/10 · Severe
- Unhealthy air days now
- 27 days/yr
- Unhealthy air days in 30 yrs
- 31 days/yr
Risk factors via First Street. Map © Google.
Why this score? — see what drove the B grade
The composite is a weighted blend of 9 inputs, each scored 0–100. Each bar is that input's sub-score; the figure is the points it added to the 100-point composite (weight × sub-score).
- Cash flow +29.3/30.0
- ARV discount +15.0/15.0
- DSCR +10.0/10.0
- 1% rule +7.4/10.0
- Schools +4.5/10.0
- Livability +3.5/5.0
- Rent growth +2.5/5.0
- Condition / age +2.5/5.0
- Appreciation +0.0/10.0
$255,000
🖨 Deal sheet (PDF) 📄 Offer letter ✓ Due diligence
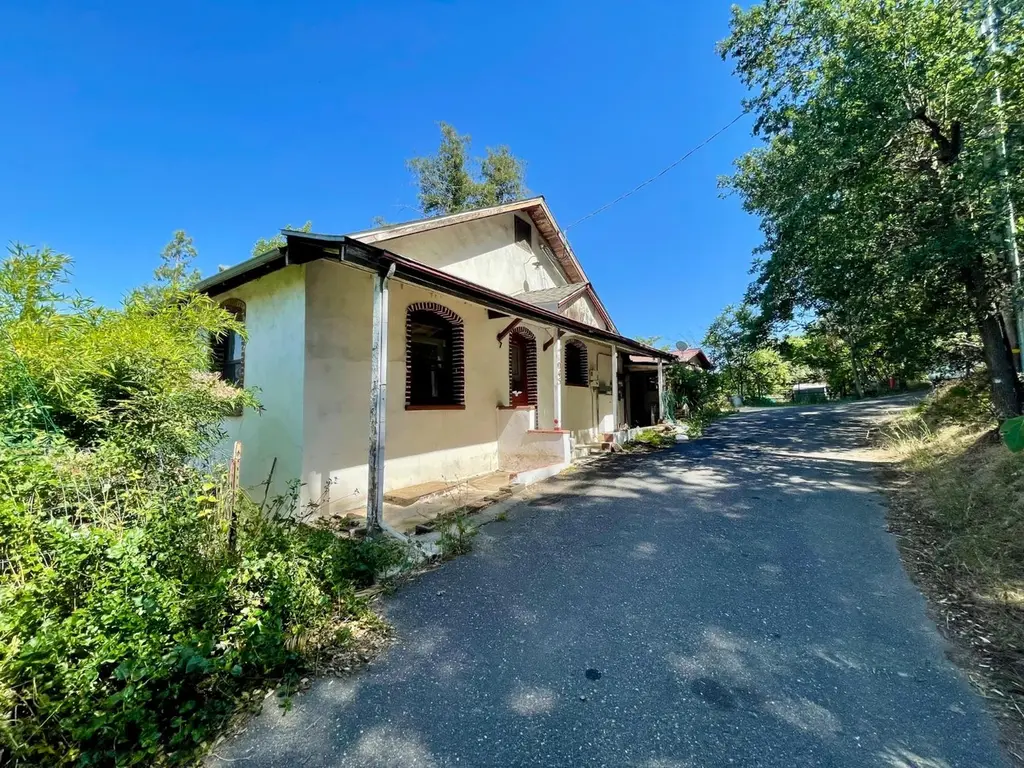
Listing remarks
3 bedroom, 2 bathroom, 2006 sq. ft. home on . 21 acres-close to historic downtown and other shopping/conveniences. Enjoy your morning or evening on covered porch offering views of the hills. New Roof and solar, installed in 2023. Potential for studio apartment below with separate entrance, bathroom, kitchenette, living/bedroom area. Two workshops, lower could be used for possible wine cellar. Carpets were removed recently exposing some older hardwood flooring and concrete floors. This is a fixer upper, but a good wood refinishing and concrete stain would really help bring out the charm of home. Unique brick accents around exterior of windows. Plenty of level space with mature trees/landscap
Key facts
- Covered porch
- Separate entrance
- Solar
Tags
Property features AI
Finance
- Other: Property listed by Cedar Creek Realty (Murphys)
- HOA & community: No homeowners association; Not a senior community
Exterior
- Parking: Covered, detached parking
- Utilities: Solar utilities; Electric service: other; Public sewer; Public water and water district; No irrigation system
- Home design: Detached single-family residence; Residential property; Fixer condition; Built in 1925; 2 stories; Street entrance
- Construction: Detached construction
- Exterior features: Landscaped backyard; Composition roof; No private pool or spa
Interior
- Kitchen: Electric cooktop; Free-standing gas oven; Synthetic countertops
- Bedrooms: 3 bedrooms (located on main and lower levels)
- Flooring: Wood flooring; Linoleum; Additional flooring details — see remarks
- Bathrooms: 2 full bathrooms; Jack and Jill layout; Tub and tub with shower over
- Heating & cooling: Wall furnace heating; No central cooling
- Interior features: Deck attached to the living area; Covered deck; Dining and family room combined; Synthetic kitchen countertops; Pets allowed
- Laundry & utility: Laundry area (other)
Neighborhood map
What this means for you Summary
Snapshot
- This is a 3-bed/1.5-bath single-family listed at $255k.
Deal economics
- At list price, monthly cash flow is $898 ($11k/yr) — positive.
- The deal already cash-flows at list — no discount required.
- Meets the 1% rule at list price ($3k rent vs $255k).
- Recommended offer: $247k (3.0% below list) — sets the bar for market timing.
- Cap rate 10.5% vs local median 4.4% in Angels — top-decile yield for the area; either an underpriced asset or a hidden risk that comps aren't pricing in. Stress-test before assuming the spread holds.
Location & tenants
- Location reads 69/100 on livability (#265 in CA) — a middle-class / working-renter tenant base. Strengths: health & safety A+, crime B+, schools B; Watch: amenities F, commute F, cost of living F.
- Bret Harte Union High (town): math 35% / reading 65% proficiency, ranked #429 of 1,400 in CA (top 31%) — acceptable for families but not a draw, mixed tenant base, ~2y average lease.
- Market conditions: 99 active listings in the ZIP; 1 comparable units currently listed for rent nearby; 77 units permitted in Calaveras County in 2024 (0 in 5+ unit buildings).
Forward outlook
- Local home prices are declining (-3.0%/yr); year-one equity from $2k of loan paydown is wiped out by about $8k of value loss. Plan a longer hold.
- Calaveras County population projected at -18% by 2050 — secular population decline; favor cash flow + early exit over multi-decade hold.
- At projected returns (-3.0% appreciation + 3.0% rent growth), your $71k cash investment doubles in ~8 years — after that, you're playing with house money.
Negotiation context
- It's been on market 31 days — a 3% lower offer ($247k) is reasonable based on typical stale-listing flexibility.
Risks & watch-outs
- Watch-outs: built in 1925 — expect roof / HVAC / electrical / plumbing capex.
- Climate carrying-cost: severe wildfire risk; extreme-heat days projected 6→13/yr by 2055 (HVAC capex compounding) — expect insurance premiums to compound above CPI over the hold.
Questions for the listing agent
- It's been on market 31 days. Have you received any prior offers? Is the seller open to a 3% concession, seller financing, or rate buy-down credit?
- Built in 1925 — when were the roof, HVAC, electrical panel, plumbing, and water heater last replaced?
- Is there a deadline driving the sale (1031 exchange, divorce, estate, relocation)? That informs how much negotiation room exists.
- Schools are B-rated — typically a magnet for longer-tenancy family renters. What's the average tenant stay here, and is there a school-zone premium baked into asking?
- What's the average days-on-market for RENTAL listings here right now (not sales)? A rising rental-DOM trend means longer vacancies and softer asking-rent achievability than the comps imply.
- What's the recent tenant-quality profile in this submarket — average credit score on applications, eviction rate, late-payment / NSF rate, and stable-employment percentage? A property-management company in the area should have these aggregated.
- How much new for-sale + rental construction is in the pipeline within 1–3 miles? Heavy new supply typically softens prices + rents 12–24 months out; constrained supply supports both.
Investment metrics
- 1% rule
- 1.24% ✓
- Cap rate
- 10.52%
- Cash-on-cash
- 15.10%
- DSCR
- 1.67
- GRM
- 6.7
CMA / ARV
- ARV (on-the-fly)
- $503,506
- Comps found
- 8
Show comp detail 8 sales within ~0.75 mi
| Address | Dist | Beds/Ba | Sqft | Sold | Price | $/sf | Match |
|---|---|---|---|---|---|---|---|
| 1568 Old Vallecito Rd | 0.22mi | 3/2.0 | 1,712 (-15%) | 1mo | $439,000 | $256 | 62 |
| 1703 Tryon Ct | 0.31mi | 4/2.0 (+1) | 1,886 (-6%) | 9mo | $390,000 | $207 | 61 |
| 1020 Devegio | 0.19mi | 3/2.5 | 1,902 (-5%) | 23mo | $445,000 | $234 | 60 |
| 1526 Finnegan Ln | 0.57mi | 3/3.0 | 1,990 (-1%) | 10mo | $524,000 | $263 | 58 |
| 684 Alpine Ave | 0.64mi | 3/3.0 | 2,075 (+3%) | 12mo | $520,000 | $251 | 48 |
| 540 Amador Ave | 0.72mi | 4/2.0 (+1) | 1,920 (-4%) | 15mo | $418,000 | $218 | 40 |
| 974 Mark Twain Rd | 0.38mi | 4/2.0 (+1) | 1,760 (-12%) | 18mo | $440,000 | $250 | 40 |
| 1002 Stelte Ct | 0.33mi | 4/3.0 (+1) | 1,821 (-9%) | 24mo | $480,000 | $264 | 39 |
Match score weights: distance 35% · size 25% · config 20% · recency 20%. Top-matched comps best support the ARV.
Projected returns pro-forma
-3.0% appreciation · 3.0% rent growth · sell at horizon
- IRR
- 5.7%
- Equity multiple
- 1.22×
- Total profit
- $15,837
- Equity at exit
- $38,021
- IRR
- 15.1%
- Equity multiple
- 2.22×
- Total profit
- $87,229
- Equity at exit
- $22,048
Cash invested: $71,400 (down + closing). Projections, not guarantees.
Landlord ↔ Tenant lean methodology
- Overall (STATE)
- 18 Strongly Tenant-Friendly
- State California
- 18 Strongly Tenant-Friendly · D+13
- County
- — inherits STATE
- City
- — inherits STATE
ZIP-level market 95222
- Active inventory
- 99
- Price-to-rent
- 6.7×
Monthly cashflow live
- Estimated rent
- $3,150 medium interval (Pro) →
- Mortgage (P&I)
- −$1,337
- Tax from tax record
- −$147 /mo · $1,760/yr
- Insurance
- −$106
- HOA
- −$0
- Vacancy / Maint / Mgmt
- −$662
- Net cashflow
- $898
Break-even live
Sensitivity live
| Price | -10% $1,043 | -5% $971 | +0% $898 | +5% $826 | +10% $754 |
|---|---|---|---|---|---|
| Rent | -10% $649 | -5% $774 | +0% $898 | +5% $1,023 | +10% $1,147 |
| Rate | -1.0pp $1,027 | -0.5pp $963 | base $898 | +0.5pp $832 | +1.0pp $765 |
UW: 25.0% down · 7.5% · 30yr · 1.5% tax · 5.0% vac · 8.0% maint · 8.0% mgmt
Financing live
Cash to close
- Down payment
- $63,750
- Closing costs
- $7,650
- Reserves months
- —
- Total cash needed
- —
Loan-product check · same deal, 3 products live
Conventional
25% down · 7.5% · 30yr
- Down + closing
- —
- Monthly P&I
- —
- Monthly cashflow
- —
- DSCR
- —
- Eligible?
- —
Personal DTI + credit; lowest rate.
DSCR
20% down · 8.5% · 30yr
- Down + closing
- —
- Monthly P&I
- —
- Monthly cashflow
- —
- DSCR
- —
- Eligible?
- —
No personal income docs; deal must DSCR.
Hard money
10% down · 12.0% · 12mo
- Down + closing
- —
- Monthly P&I
- —
- Monthly cashflow
- —
- DSCR
- —
- Eligible?
- —
Short-term bridge; refi at stabilization.
Rent comps 1 comps
| Address | Beds | Baths | Sqft | Rent | $/sqft | DOM | Units | Dist |
|---|---|---|---|---|---|---|---|---|
| 515 Rosebush Ct Angels Camp, CA | 3.0 | 3.0 | 2250 | $3,150 | $1.40 | 15d | 1 | 1.03mi |
Listing history 16 events
-
2026-06-21pricedays on market $255,000 Active 31 DOM
-
2026-06-18days on market $280,000 Active 28 DOM
-
2026-06-17days on market $280,000 Active 27 DOM
-
2026-06-16days on market $280,000 Active 26 DOM
-
2026-06-15days on market $280,000 Active 25 DOM
-
2026-06-14days on market $280,000 Active 23 DOM
-
2026-06-10days on market $280,000 Active 20 DOM
-
2026-06-09days on market $280,000 Active 19 DOM
-
2026-06-08days on market $280,000 Active 18 DOM
-
2026-06-07days on market $280,000 Active 17 DOM
-
2026-06-05days on market $280,000 Active 14 DOM
-
2026-06-03days on market $280,000 Active 13 DOM
-
2026-06-02days on market $280,000 Active 12 DOM
-
2026-06-01days on market $280,000 Active 11 DOM
-
2026-05-31days on market $280,000 Active 10 DOM
-
2026-05-30days on market $280,000 Active 9 DOM
ⓘ Source: listings_history table (triggers on properties + properties_extension) + one-shot
backfill from property_details.listing_events for pre-trigger history.
Tax reassessment forecast CA · Resets to sale price
- Current annual tax
- $1,760 · $147/mo
- Projected year-2 tax
- $1,938 · $162/mo
- Expected delta
- +$178/yr (+$15/mo · 10.1%)
ⓘ Screening estimate from a state-policy table — verify with the county assessor before closing.
Climate risk First Street
- Flood 1/10 Low FEMA zone X (unshaded) · 0% chance over 30 yrs
- Wildfire 8/10 Severe
- Heat 6/10 Major 6 d/yr ≥102°F today · 13 d/yr by 30 yrs out
- Wind 1/10 Low
- Air quality 10/10 Extreme 27 unhealthy d/yr today · 31 by 30 yrs out
Nearby sold comps map
Loading sold comps map…
Walkable amenities ~0.75 mi
Loading nearby amenities…
Taxation est. · year 1
- Rental income
- $37,800
- − Mortgage interest
- −$14,284
- − Property taxes
- −$1,760
- − Insurance
- −$1,275
- − Repairs & maintenance
- −$3,024
- − Management
- −$3,024
- − Depreciation
- −$7,418
- Taxable income
- $7,015
- Est. tax owed @ 24.0%
- −$1,684
- After-tax cash flow
- $9,097/yr
For passive investors: Depreciation is non-cash, so a rental often shows a tax loss while cash-flowing — sheltering income. Rental losses are passive: they offset passive income freely, and up to $25,000/yr can offset ordinary (W-2) income if you actively participate and your MAGI is under $100k (phasing out to $0 by $150k); unused losses carry forward. On sale, claimed depreciation is recaptured at up to 25%, and gains may owe capital-gains tax (a 1031 exchange can defer both). Figures are a year-1 estimate at your 24.0% rate — not tax advice; consult a CPA.
Schools (NCES district)
- District
- Bret Harte Union High
- NCES district ID
- 0605940
- Math proficiency
- 35% ▲ 5.00%
- Reading proficiency
- 65% ▲ 5.00%
- Median HH income
- $56,974
- Composite
- 45.41/100
- National rank
- #5708
- State rank
- #429 of 1400 in CA
Livability — Angels
- Score
- 69/100
- State rank
- #265
- US rank
- #8772
Category grades
Schools grade is shown separately in the Schools card above.
Census & demographics
- Census place
- Angels, CA
- City population
- 164
- Population (ZIP)
- 5,666
Population outlook (Calaveras County) Hauer SSP2
- Today (2025)
- 43,163 people
- By 2030
- 41,703 · -3.4%
- By 2040
- 38,202 · -11.5%
- By 2050
- 35,385 · -18.0%
- By 2075
- 30,807 · -28.6%
- By 2100
- 25,755 · -40.3%
Race, ethnicity, and origin ACS 2023
- Neighborhood character
- Predominantly White (85%)
- Race & ethnicity
- White 85% Hispanic / Latino 8% Two or more races 7% Native American 2%
- Hispanic origin (detail)
- Mexican 5%
- Common ancestry
- Slovak 4% Russian 3% Serbian 2%
- Foreign-born
- 3% · Canada
- Languages at home
- 91% English-only · Spanish 8% Other Indo-European 1%
Political lean MEDSL · Calaveras
- 2024 margin
- Strong R (+28.1) · D 34.7% · R 62.8% · Other 2.5%
- 2008→2024 swing
- -15.2pp toward R · 2008: -13.0pp · 2024: -28.1pp
- All cycles
- 2024: R+28.1 2020: R+23.8 2016: R+23.9 2012: R+17.0 2008: R+13.0
Not yet ingested
- Civics
- —
Market trends
- HPI YoY
- ▼ -118.93%
- Current HPI
- 137.7432
- Rent YoY
- —
- Metro
- —
- State GDP YoY
- ▲ 3.21%
- F500 in state
- 116
Industry mix (Fortune 500 HQ in CA)
| Industry | F500 HQs | Revenue |
|---|---|---|
| Technology | 27 | $1,492B |
|
||
| Financial Services | 3 | $174B |
|
||
| Retail | 3 | $44B |
|
||
| Insurance | 3 | $26B |
|
||
| Media / Entertainment | 2 | $115B |
|
||
| Pharmaceuticals / Biotech | 2 | $62B |
|
||
Property tax history
+2.2%/yrLatest (2025): $1,760 · +1.0% YoY. Source: county tax records.
Cash-flow waterfall
monthlySold comps — $/sqft
last 12 mo · ≤1 miLoading sold comps…