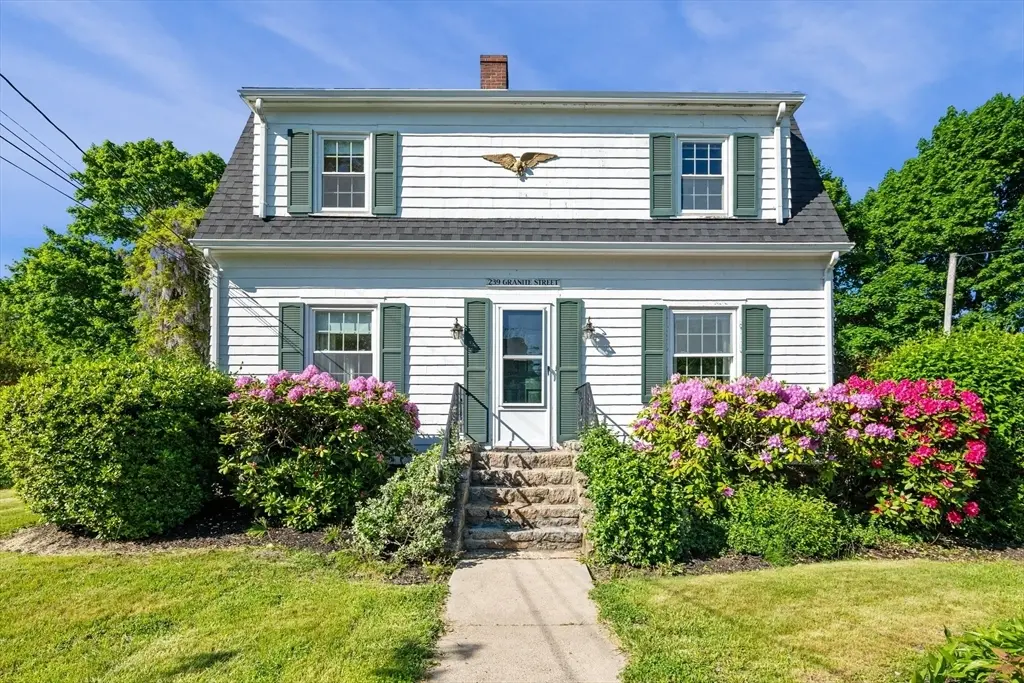
239 Granite St · Gloucester, MA
Flood risk 1/10 · Minimal
- FEMA flood zone
- X (unshaded)
- Chance of flooding over 30 yrs
- 0.0%
- Est. flood insurance / yr
- $473 – $860
Fire risk 1/10 · Minimal
- Est. fire insurance / yr
- $915 – $1,699
Heat risk 5/10 · Moderate
- Hot days now (above 87°F)
- 8 days/yr
- Hot days in 30 yrs
- 18 days/yr
Wind risk 8/10 · Major
- Chance of severe wind over 30 yrs
- 80.0%
Air-quality risk 2/10 · Minimal
- Unhealthy air days now
- 0 days/yr
- Unhealthy air days in 30 yrs
- 1 days/yr
Risk factors via First Street. Map © Google.
Why this score? — see what drove the B+ grade
The composite is a weighted blend of 9 inputs, each scored 0–100. Each bar is that input's sub-score; the figure is the points it added to the 100-point composite (weight × sub-score).
- Cash flow +30.0/30.0
- ARV discount +15.0/15.0
- DSCR +10.0/10.0
- 1% rule +8.8/10.0
- Schools +3.7/10.0
- Livability +3.6/5.0
- Rent growth +2.5/5.0
- Condition / age +2.5/5.0
- Appreciation +0.0/10.0
$899,000
🖨 Deal sheet (PDF) 📄 Offer letter ✓ Due diligence
Listing remarks
This classic New England home is surrounded by mature landscaping and offers variety of indoor and outdoor living. The spacious great room features cathedral ceilings and flows seamlessly into the open-concept kitchen, all leading to a deck overlooking the yard and outdoor stone fireplace. Additional living spaces include a welcoming living room with fireplace and a formal dining room. The second floor offers primary bedroom with walk in closet and 2 additional bedrooms with plenty of closets, A convenient first-floor laundry room adds everyday ease. Major improvements include a newer Buderus heating system, Velocity water heater, 2019 roof. 2014 updated windows and kitchen. Potential for
Key facts
- Open-concept kitchen
- Great room
- 8,276 sq ft lot
Tags
Property features AI
Finance
- HOA & community: Community offers public transportation, shopping, walk/jog trails, golf, laundromat, bike path and houses of worship
Exterior
- Parking: Paved driveway; Open parking for 3 vehicles
- Utilities: Public water; Public sewer; Electric with circuit breakers; Electric hookups for range and dryer
- Home design: Single family residence; Updated/remodeled condition; Approximately 2,066 total building area; White exterior color
- Construction: Shingle roof; Granite foundation; Year built approximately (public records)
- Exterior features: Composite deck; Exterior storage; Cleared lot; Public road frontage; Ocean nearby; 1–2 miles to beach; public beach access
Interior
- Kitchen: Hardwood floors; Stone/granite or solid countertops; Kitchen island; Open to adjacent living/dining areas; Access to exterior deck
- Bedrooms: Master bedroom on second floor with walk-in closet, recessed lighting and hardwood floors; Second bedroom on second floor with custom built cabinets/closet and hardwood floors; Third bedroom on second floor with closet and hardwood floors
- Flooring: Hardwood throughout primary living areas; Tile in select areas; Laminate in second-floor bathroom
- Bathrooms: Two full bathrooms; First-floor bathroom with shower stall; Second-floor bathroom with tub and shower; laminate flooring
- Heating & cooling: Baseboard heating (oil); Window cooling units; Has heating and cooling
- Interior features: Cathedral ceilings; Ceiling fans; Open floorplan; Slider; Closets; Dining area; Great room; Storm door(s); Insulated windows; Hardwood and tile flooring
- Laundry & utility: First-floor laundry with washer and electric dryer hook-ups (5x7)
Neighborhood map
What this means for you Summary
Snapshot
- This is a 3-bed/2.5-bath single-family listed at $899k.
Deal economics
- At list price, monthly cash flow is $4k ($51k/yr) — positive.
- The deal already cash-flows at list — no discount required.
- Meets the 1% rule at list price ($12k rent vs $899k).
- Recommended offer: $886k (1.5% below list) — sets the bar for market timing.
- Cap rate 12.0% vs local median 2.4% in Gloucester — top-decile yield for the area; either an underpriced asset or a hidden risk that comps aren't pricing in. Stress-test before assuming the spread holds.
Location & tenants
- Location reads 72/100 on livability (#119 in MA) — a middle-class / working-renter tenant base. Strengths: commute A+, employment A, crime B+; Watch: amenities F, cost of living F.
- Rockport (suburban): math 32% / reading 51% proficiency, ranked #187 of 302 in MA (top 62%) — families likely to look elsewhere, expect single-tenant / working-renter base with shorter leases; only 13% free/reduced lunch — higher-income household profile.
- Market conditions: 28 active listings in the ZIP; 2 comparable units currently listed for rent nearby; 1,032 units permitted in Essex County in 2024 (590 in 5+ unit buildings).
Forward outlook
- Local home prices are declining (-3.0%/yr); year-one equity from $6k of loan paydown is wiped out by about $27k of value loss. Plan a longer hold.
- Essex County population projected at +15% by 2050 — long-run rental-demand tailwind backs the buy-and-hold thesis.
- At projected returns (-3.0% appreciation + 3.0% rent growth), your $252k cash investment doubles in ~6 years — after that, you're playing with house money.
Negotiation context
- It's been on market 18 days — a 2% lower offer ($886k) is reasonable based on typical stale-listing flexibility.
Risks & watch-outs
- Watch-outs: built in 1942 — expect roof / HVAC / electrical / plumbing capex.
- Climate carrying-cost: severe wind risk, 80% chance of damaging wind over 30y; extreme-heat days projected 8→18/yr by 2055 (HVAC capex compounding) — expect insurance premiums to compound above CPI over the hold.
Questions for the listing agent
- Built in 1942 — when were the roof, HVAC, electrical panel, plumbing, and water heater last replaced?
- Is there a deadline driving the sale (1031 exchange, divorce, estate, relocation)? That informs how much negotiation room exists.
- What's the average days-on-market for RENTAL listings here right now (not sales)? A rising rental-DOM trend means longer vacancies and softer asking-rent achievability than the comps imply.
- What's the recent tenant-quality profile in this submarket — average credit score on applications, eviction rate, late-payment / NSF rate, and stable-employment percentage? A property-management company in the area should have these aggregated.
- How much new for-sale + rental construction is in the pipeline within 1–3 miles? Heavy new supply typically softens prices + rents 12–24 months out; constrained supply supports both.
Investment metrics
- 1% rule
- 1.38% ✓
- Cap rate
- 11.97%
- Cash-on-cash
- 20.27%
- DSCR
- 1.90
- GRM
- 6.0
CMA / ARV
- ARV (on-the-fly)
- $1,082,584
- Comps found
- 3
Show comp detail 3 sales within ~0.75 mi
| Address | Dist | Beds/Ba | Sqft | Sold | Price | $/sf | Match |
|---|---|---|---|---|---|---|---|
| 237 Granite St | 0.02mi | 3/2.0 | 1,890 (-8%) | 12mo | $990,000 | $524 | 73 |
| 25 Stockholm Ave | 0.44mi | 3/2.5 | 2,120 (+3%) | 6mo | $665,000 | $314 | 70 |
| 110 Phillips Ave | 0.05mi | 3/2.5 | 1,900 (-8%) | 18mo | $1,276,000 | $672 | 70 |
Match score weights: distance 35% · size 25% · config 20% · recency 20%. Top-matched comps best support the ARV.
Projected returns pro-forma
-3.0% appreciation · 3.0% rent growth · sell at horizon
- IRR
- 12.5%
- Equity multiple
- 1.50×
- Total profit
- $124,974
- Equity at exit
- $134,044
- IRR
- 21.4%
- Equity multiple
- 2.81×
- Total profit
- $456,763
- Equity at exit
- $77,729
Cash invested: $251,720 (down + closing). Projections, not guarantees.
Landlord ↔ Tenant lean methodology
- Overall (STATE)
- 20 Strongly Tenant-Friendly
- State Massachusetts
- 20 Strongly Tenant-Friendly · D+15
- County
- — inherits STATE
- City
- — inherits STATE
ZIP-level market 01966
- Home prices YoY
- -21.2%
- Active inventory
- 28
- Price-to-rent
- 6.0×
Monthly cashflow live
- Estimated rent
- $12,438 medium interval (Pro) →
- Mortgage (P&I)
- −$4,714
- Tax from tax record
- −$485 /mo · $5,815/yr
- Insurance
- −$375
- HOA
- −$0
- Vacancy / Maint / Mgmt
- −$2,612
- Net cashflow
- $4,253
Break-even live
Sensitivity live
| Price | -10% $4,762 | -5% $4,507 | +0% $4,253 | +5% $3,998 | +10% $3,744 |
|---|---|---|---|---|---|
| Rent | -10% $3,270 | -5% $3,761 | +0% $4,253 | +5% $4,744 | +10% $5,235 |
| Rate | -1.0pp $4,705 | -0.5pp $4,481 | base $4,253 | +0.5pp $4,020 | +1.0pp $3,783 |
UW: 25.0% down · 7.5% · 30yr · 1.5% tax · 5.0% vac · 8.0% maint · 8.0% mgmt
Financing live
Cash to close
- Down payment
- $224,750
- Closing costs
- $26,970
- Reserves months
- —
- Total cash needed
- —
Loan-product check · same deal, 3 products live
Conventional
25% down · 7.5% · 30yr
- Down + closing
- —
- Monthly P&I
- —
- Monthly cashflow
- —
- DSCR
- —
- Eligible?
- —
Personal DTI + credit; lowest rate.
DSCR
20% down · 8.5% · 30yr
- Down + closing
- —
- Monthly P&I
- —
- Monthly cashflow
- —
- DSCR
- —
- Eligible?
- —
No personal income docs; deal must DSCR.
Hard money
10% down · 12.0% · 12mo
- Down + closing
- —
- Monthly P&I
- —
- Monthly cashflow
- —
- DSCR
- —
- Eligible?
- —
Short-term bridge; refi at stabilization.
Rent comps 2 comps
| Address | Beds | Baths | Sqft | Rent | $/sqft | DOM | Units | Dist |
|---|---|---|---|---|---|---|---|---|
| 21 Norseman Ave Gloucester, MA | 2.0 | 2.0 | 1700 | $3,500 | $2.06 | 0d | 1 | 1.29mi |
| 14 Sunset Point Rd Gloucester, MA | 3.0 | 2.5 | 1518 | $24,000 | $15.81 | 0d | 1 | 1.49mi |
Listing history 13 events
-
2026-06-21days on market $899,000 Active 18 DOM
-
2026-06-18days on market $899,000 Active 15 DOM
-
2026-06-17days on market $899,000 Active 14 DOM
-
2026-06-16days on market $899,000 Active 13 DOM
-
2026-06-15statusdays on market $899,000 Active 12 DOM
-
2026-06-13days on market $899,000 Price Changed 10 DOM
-
2026-06-13pricestatusdays on market $899,000 Price Changed 9 DOM
-
2026-06-09days on market $969,000 Active 6 DOM
-
2026-06-08days on market $969,000 Active 5 DOM
-
2026-06-08status $969,000 Active 4 DOM
-
2026-06-07days on market $969,000 New 4 DOM
-
2026-06-04remarks 699-char remark
-
2026-06-04$969,000 New 1 DOM
ⓘ Source: listings_history table (triggers on properties + properties_extension) + one-shot
backfill from property_details.listing_events for pre-trigger history.
Tax reassessment forecast MA · Partial reset (capped growth)
- Current annual tax
- $5,815 · $485/mo
- Projected year-2 tax
- $8,436 · $703/mo
- Expected delta
- +$2,621/yr (+$218/mo · 45.1%)
ⓘ Screening estimate from a state-policy table — verify with the county assessor before closing.
Climate risk First Street
- Flood 1/10 Low FEMA zone X (unshaded) · 0% chance over 30 yrs
- Wildfire 1/10 Low
- Heat 5/10 Major 8 d/yr ≥87°F today · 18 d/yr by 30 yrs out
- Wind 8/10 Severe 80% chance of damaging wind over 30 yrs
- Air quality 2/10 Low 0 unhealthy d/yr today · 1 by 30 yrs out
Nearby sold comps map
Loading sold comps map…
Walkable amenities ~0.75 mi
Loading nearby amenities…
Taxation est. · year 1
- Rental income
- $149,260
- − Mortgage interest
- −$50,358
- − Property taxes
- −$5,815
- − Insurance
- −$4,495
- − Repairs & maintenance
- −$11,941
- − Management
- −$11,941
- − Depreciation
- −$26,153
- Taxable income
- $38,558
- Est. tax owed @ 24.0%
- −$9,254
- After-tax cash flow
- $41,778/yr
For passive investors: Depreciation is non-cash, so a rental often shows a tax loss while cash-flowing — sheltering income. Rental losses are passive: they offset passive income freely, and up to $25,000/yr can offset ordinary (W-2) income if you actively participate and your MAGI is under $100k (phasing out to $0 by $150k); unused losses carry forward. On sale, claimed depreciation is recaptured at up to 25%, and gains may owe capital-gains tax (a 1031 exchange can defer both). Figures are a year-1 estimate at your 24.0% rate — not tax advice; consult a CPA.
Schools (NCES district)
- District
- Rockport
- NCES district ID
- 2510200
- Math proficiency
- 32% ▼ -14.00%
- Reading proficiency
- 51% ▼ -8.00%
- Median HH income
- $67,677
- Composite
- 37.35/100
- National rank
- #4436
- State rank
- #187 of 302 in MA
Livability — Gloucester
- Score
- 72/100
- State rank
- #119
- US rank
- #6345
Category grades
Schools grade is shown separately in the Schools card above.
Census & demographics
- City population
- 30,075
- Population (ZIP)
- 6,977
Population outlook (Essex County) Hauer SSP2
- Today (2025)
- 840,920 people
- By 2030
- 872,201 · +3.7%
- By 2040
- 927,918 · +10.3%
- By 2050
- 970,206 · +15.4%
- By 2075
- 1,077,993 · +28.2%
- By 2100
- 1,103,053 · +31.2%
Race, ethnicity, and origin ACS 2023
- Neighborhood character
- Predominantly White (94%)
- Race & ethnicity
- White 94% Two or more races 5% Hispanic / Latino 2%
- Common ancestry
- Lithuanian 5% Slovak 4% Romanian 4%
- Foreign-born
- 5% · Canada, Jamaica
- Languages at home
- 96% English-only · Other Indo-European 2% Spanish 1% French/Haitian/Cajun 1%
Political lean MEDSL · Essex
- 2024 margin
- Strong D (+20.3) · D 59.2% · R 38.9% · Other 1.9%
- 2008→2024 swing
- 0.0pp no change · 2008: 20.3pp · 2024: 20.3pp
- All cycles
- 2024: D+20.3 2020: D+29.1 2016: D+22.5 2012: D+16.2 2008: D+20.3
Not yet ingested
- Civics
- —
Market trends
- HPI YoY
- ▼ -74.07%
- Current HPI
- 275.8249
- Rent YoY
- —
- Metro
- —
- State GDP YoY
- ▲ 2.28%
- F500 in state
- 38
Industry mix (Fortune 500 HQ in MA)
| Industry | F500 HQs | Revenue |
|---|---|---|
| Technology | 3 | $17B |
|
||
| Insurance | 2 | $84B |
|
||
| Retail | 2 | $76B |
|
||
| Life Sciences | 1 | $43B |
|
||
| Energy Technology | 1 | $31B |
|
||
| Aerospace / Defense | 1 | $18B |
|
||
Price history
1 event — show timeline
- 2026-06-03 Listed $969,000 MLS PIN
Property tax history
+3.7%/yrLatest (2023): $5,815 · +12.9% YoY. Source: county tax records.
Cash-flow waterfall
monthlySold comps — $/sqft
last 12 mo · ≤1 miLoading sold comps…