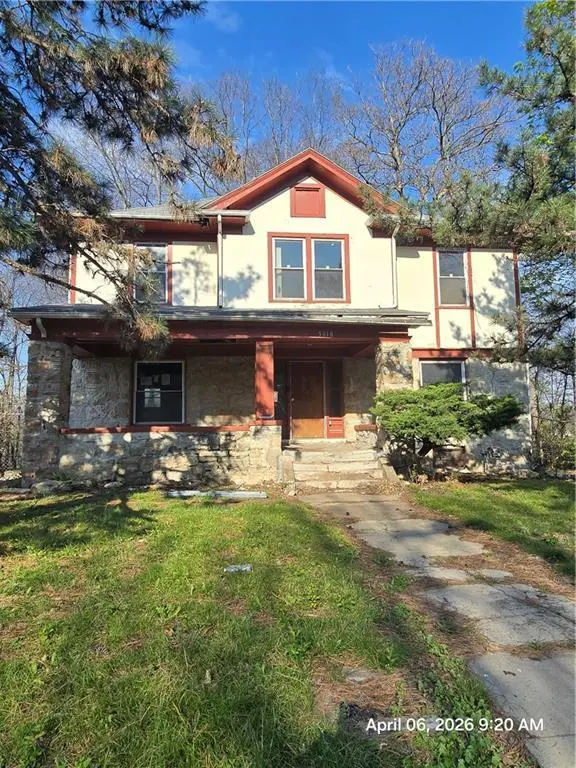
5018 Euclid St · Kansas City, MO
Flood risk 1/10 · Minimal
- FEMA flood zone
- X (unshaded)
- Chance of flooding over 30 yrs
- 0.0%
- Est. flood insurance / yr
- $473 – $860
Fire risk 1/10 · Minimal
- Est. fire insurance / yr
- $1,054 – $1,958
Heat risk 4/10 · Minor
- Hot days now (above 106°F)
- 7 days/yr
- Hot days in 30 yrs
- 17 days/yr
Wind risk 2/10 · Minimal
- Chance of severe wind over 30 yrs
- —
Air-quality risk 3/10 · Minor
- Unhealthy air days now
- 2 days/yr
- Unhealthy air days in 30 yrs
- 4 days/yr
Risk factors via First Street. Map © Google.
Why this score? — see what drove the B- grade
The composite is a weighted blend of 9 inputs, each scored 0–100. Each bar is that input's sub-score; the figure is the points it added to the 100-point composite (weight × sub-score).
- Cash flow +27.1/30.0
- ARV discount +15.0/15.0
- DSCR +9.4/10.0
- 1% rule +6.5/10.0
- Livability +3.9/5.0
- Rent growth +3.6/5.0
- Condition / age +2.5/5.0
- Schools +1.5/10.0
- Appreciation +0.0/10.0
$159,900
🖨 Deal sheet 📄 Offer letter ✓ Due diligence
Listing remarks
This spacious 2 story home in the heart of Garfield Heights is packed with potential and ready for its next chapter. Boasting over 2000 square feet, this 1916 built property sits on an oversized 14181 square foot lot, giving you room to expand, reimagine, or simply enjoy the extra space. With a classic stone and frame exterior and off street parking, the bones are there and now it just needs the vision. Whether you are an investor looking for your next project or a buyer ready to create a home with character, this property is a blank canvas waiting for the right touch. Opportunities like this do not come around often, bring your ideas and unlock the full potential.
Key facts
- 0.33 acre lot
- Built 1916
- Listed 52 days
Property features AI
Finance
- Other: Directions: The Paseo to East 51st Street, take 51st Street east to Euclid, then take Euclid Avenue north to the address on the left
- HOA & community: No association fees
Exterior
- Parking: Off-street parking
- Utilities: Public water; Public sewer
- Home design: Single-family residence; Residential property; 2-story floor plan; Approx. 2,030 above-grade finished living area; Property age: 101+ years
- Construction: Stone and frame construction; Composition roof
- Exterior features: Not in a flood plain; Lot approximately 14,181 square feet
Interior
- Bedrooms: 4 bedrooms
- Bathrooms: 2 full bathrooms
- Heating & cooling: Natural gas heating; Electric cooling (has cooling)
- Interior features: Has unfinished basement; Has one fireplace
Neighborhood map
What this means for you Summary
Snapshot
- This is a 4-bed/2.0-bath single-family listed at $160k.
Deal economics
- At list price, monthly cash flow is $451 ($5k/yr) — positive.
- The deal already cash-flows at list — no discount required.
- Meets the 1% rule at list price ($2k rent vs $160k).
- Recommended offer: $155k (3.0% below list) — sets the bar for market timing.
- Cap rate 9.7% vs local median 3.9% in Kansas City — top-decile yield for the area; either an underpriced asset or a hidden risk that comps aren't pricing in. Stress-test before assuming the spread holds.
Location & tenants
- Location reads 78/100 on livability (#28 in MO, #2,671 nationally) — a middle-class / working-renter tenant base. Strengths: amenities A+, commute A+, cost of living A+; Watch: schools C-, crime F.
- Kansas City 33 (urban): math 12% / reading 24% proficiency, ranked #308 of 324 in MO (top 95%) — low school quality limits family demand, transient renter base, plan for 1-2y turnover; 75% free/reduced lunch — lower-income household profile, screen leases tightly.
- Market conditions: Rents rising fast (+4.4%/yr); 187 active listings in the ZIP; 25 comparable units currently listed for rent nearby; rentals at typical pace (median 20d on market — plan ~3-4 weeks tenant-placement turnaround); lower-income renter base — watch delinquency; 4,002 units permitted in Jackson County in 2024 (2,271 in 5+ unit buildings).
- At $1,836/mo this rent would consume 52% of the median local household income ($42k/yr) (locally 1132% of renters already pay >50% of income on rent) — very limited rent-growth headroom before tenants either downsize or default.
Forward outlook
- Local home prices are declining (-3.0%/yr); year-one equity from $1k of loan paydown is wiped out by about $5k of value loss. Plan a longer hold.
- Jackson County population projected at +4% by 2050 — modest demand growth; plan on rents tracking national, not racing it.
- At projected returns (-3.0% appreciation + 4.4% rent growth), your $45k cash investment doubles in ~9 years — after that, you're playing with house money.
Negotiation context
- It's been on market 52 days — a 3% lower offer ($155k) is reasonable based on typical stale-listing flexibility.
Risks & watch-outs
- Watch-outs: built in 1916 — expect roof / HVAC / electrical / plumbing capex.
Questions for the listing agent
- It's been on market 52 days. Have you received any prior offers? Is the seller open to a 3% concession, seller financing, or rate buy-down credit?
- Built in 1916 — when were the roof, HVAC, electrical panel, plumbing, and water heater last replaced?
- Is there a deadline driving the sale (1031 exchange, divorce, estate, relocation)? That informs how much negotiation room exists.
- Crime grade is F in this area — have there been break-ins, vandalism, or insurance claims at this property in the last 3 years? What carrier currently insures it and at what premium?
- What's the average days-on-market for RENTAL listings here right now (not sales)? A rising rental-DOM trend means longer vacancies and softer asking-rent achievability than the comps imply.
- What's the recent tenant-quality profile in this submarket — average credit score on applications, eviction rate, late-payment / NSF rate, and stable-employment percentage? A property-management company in the area should have these aggregated.
- How much new for-sale + rental construction is in the pipeline within 1–3 miles? Heavy new supply typically softens prices + rents 12–24 months out; constrained supply supports both.
Investment metrics
- 1% rule
- 1.15% ✓
- Cap rate
- 9.68%
- Cash-on-cash
- 12.08%
- DSCR
- 1.54
- GRM
- 7.3
CMA / ARV
- ARV (median comp)
- $198,102
- List price
- $159,900
- Delta
- -19.28%
- Verdict
- UNDERPRICED
- Comps
- 20 within 1.0 mi
Show comp detail 12 sales within ~0.75 mi
| Address | Dist | Beds/Ba | Sqft | Sold | Price | $/sf | Match |
|---|---|---|---|---|---|---|---|
| 5101 Garfield Ave | 0.12mi | 3/2.5 (-1) | 2,184 (+8%) | 3mo | $135,000 | $62 | 72 |
| 5247 Brookwood Ave | 0.31mi | 4/2.5 | 1,898 (-6%) | 1mo | $50,000 | $26 | 72 |
| 5016 Lydia Ave | 0.38mi | 3/2.0 (-1) | 1,974 (-3%) | 3mo | $250,000 | $127 | 70 |
| 5007 Euclid Ave | 0.05mi | 4/2.5 | 2,286 (+13%) | 8mo | $200,000 | $87 | 68 |
| 4937 Highland Ave | 0.18mi | 5/2.5 (+1) | 1,884 (-7%) | 7mo | $200,000 | $106 | 66 |
| 5344 Brooklyn Ave | 0.44mi | 3/1.0 (-1) | 2,080 (+2%) | 9mo | $100,000 | $48 | 59 |
| 5127 Olive St | 0.32mi | 3/1.0 (-1) | 2,155 (+6%) | 11mo | $115,000 | $53 | 57 |
| 4949 Tracy Ave | 0.48mi | 4/4.0 | 2,100 (+3%) | 9mo | $329,000 | $157 | 57 |
| 1220 E 51st St | 0.51mi | 3/1.5 (-1) | 1,938 (-4%) | 8mo | $265,000 | $137 | 55 |
| 5239 Paseo Blvd | 0.38mi | 3/2.0 (-1) | 1,788 (-12%) | 13mo | $275,000 | $154 | 46 |
| 5422 Tracy Ave | 0.72mi | 3/2.5 (-1) | 2,081 (+2%) | 14mo | $385,000 | $185 | 43 |
| 5441 Lydia Ave | 0.64mi | 3/3.5 (-1) | 2,250 (+11%) | 14mo | $395,000 | $176 | 30 |
Match score weights: distance 35% · size 25% · config 20% · recency 20%. Top-matched comps best support the ARV.
Projected returns pro-forma
-3.0% appreciation · 4.42% rent growth · sell at horizon
- IRR
- 3.1%
- Equity multiple
- 1.12×
- Total profit
- $5,420
- Equity at exit
- $23,842
- IRR
- 13.9%
- Equity multiple
- 2.18×
- Total profit
- $52,773
- Equity at exit
- $13,825
Cash invested: $44,772 (down + closing). Projections, not guarantees.
Landlord ↔ Tenant lean methodology
- Overall (STATE)
- 81 Strongly Landlord-Friendly
- State Missouri
- 81 Strongly Landlord-Friendly · R+10
- County
- — inherits STATE
- City
- — inherits STATE
ZIP-level market 64130
- Home prices YoY
- -21.5%
- Rents YoY
- 4.4%
- Active inventory
- 187
- Price-to-rent
- 7.3×
Monthly cashflow live
- Estimated rent
- $1,836 high interval (Pro) →
- Mortgage (P&I)
- −$839
- Tax from tax record
- −$95 /mo · $1,138/yr
- Insurance
- −$67
- HOA
- −$0
- Vacancy / Maint / Mgmt
- −$386
- Net cashflow
- $451
Break-even live
UW: 25.0% down · 7.5% · 30yr · 1.5% tax · 5.0% vac · 8.0% maint · 8.0% mgmt
Financing live
Cash to close
- Down payment
- $39,975
- Closing costs
- $4,797
- Reserves months
- —
- Total cash needed
- —
Loan-product check · same deal, 3 products live
Conventional
25% down · 7.5% · 30yr
- Down + closing
- —
- Monthly P&I
- —
- Monthly cashflow
- —
- DSCR
- —
- Eligible?
- —
Personal DTI + credit; lowest rate.
DSCR
20% down · 8.5% · 30yr
- Down + closing
- —
- Monthly P&I
- —
- Monthly cashflow
- —
- DSCR
- —
- Eligible?
- —
No personal income docs; deal must DSCR.
Hard money
10% down · 12.0% · 12mo
- Down + closing
- —
- Monthly P&I
- —
- Monthly cashflow
- —
- DSCR
- —
- Eligible?
- —
Short-term bridge; refi at stabilization.
Rent comps 25 comps
| Address | Beds | Baths | Sqft | Rent | $/sqft | DOM | Units | Dist |
|---|---|---|---|---|---|---|---|---|
| 5241 Brookwood Ave Kansas City, MO | 3.0 | 2.0 | 1431 | $1,550 | $1.08 | 43d | 1 | 0.29mi |
| 5218 Highland Ave Kansas City, MO | 5.0 | 2.0 | 2300 | $1,995 | $0.87 | 7d | 1 | 0.32mi |
| 2420 E 51st St Kansas City, MO | 3.0 | 2.0 | 1460 | $1,350 | $0.92 | 23d | 1 | 0.33mi |
| 5122 Paseo Blvd Kansas City, MO | 3.0 | 1.0 | 1573 | $1,595 | $1.01 | 10d | 1 | 0.34mi |
| 1330 Rockhurst Rd Kansas City, MO | 4.0 | 2.0 | 1984 | $2,500 | $1.26 | 43d | 1 | 0.44mi |
| 5344 Brooklyn Ave Kansas City, MO | 3.0 | 1.0 | 2040 | $1,495 | $0.73 | 7d | 1 | 0.44mi |
| 5414 Brooklyn Ave Kansas City, MO | 3.0 | 1.5 | 1856 | $1,650 | $0.89 | 16d | 1 | 0.49mi |
| 5430 Michigan Ave Kansas City, MO | 3.0 | 1.0 | 1710 | $1,100 | $0.64 | 19d | 1 | 0.52mi |
| 5038 S Benton Ave Kansas City, MO | 4.0 | 3.0 | 1500 | $1,875 | $1.25 | 21d | 1 | 0.57mi |
| 4511 Park Ave Kansas City, MO | 4.0 | 2.5 | 1915 | $1,982 | $1.03 | 23d | 1 | 0.69mi |
| 5346 Harrison St Kansas City, MO | 3.0 | 1.0 | 1580 | $1,695 | $1.07 | 19d | 1 | 0.81mi |
| 5346 Harrison St Kansas City, MO | 3.0 | 1.0 | 1580 | $1,695 | $1.07 | 16d | 1 | 0.81mi |
| 5712 Garfield Ave Kansas City, MO | 4.0 | 2.0 | 2200 | $1,900 | $0.86 | 16d | 1 | 0.86mi |
| 4444 Troost Ave Kansas City, MO | 5.0 | 2.0 | 2400 | $2,250 | $0.94 | 43d | 1 | 0.94mi |
| 4440 Troost Ave Kansas City, MO | 5.0 | 2.0 | 2400 | $2,250 | $0.94 | 43d | 1 | 0.95mi |
| 4219 Woodland Ave Kansas City, MO | 4.0 | 2.0 | 1566 | $1,900 | $1.21 | 1d | 1 | 0.97mi |
| 4211 Woodland Ave Kansas City, MO | 4.0 | 2.5 | 1926 | $2,010 | $1.04 | 16d | 1 | 1.00mi |
| 4653 Benton Blvd Kansas City, MO | 3.0 | 2.0 | 1594 | $1,600 | $1.00 | 7d | 1 | 1.08mi |
| 4112 Park Ave Kansas City, MO | 4.0 | 2.0 | 1700 | $1,800 | $1.06 | 14d | 1 | 1.16mi |
| 5017 Grand Ave Kansas City, MO | 4.0 | 4.5 | 2000 | $4,600 | $2.30 | 21d | 1 | 1.22mi |
| 4119 S Benton Ave Kansas City, MO | 4.0 | 2.0 | 1700 | $1,800 | $1.06 | 43d | 1 | 1.27mi |
| 5125 Walnut St Kansas City, MO | 3.0 | 3.0 | 1400 | $2,690 | $1.92 | 1d | 1 | 1.29mi |
| 4018 Prospect Ave Kansas City, MO | 4.0 | 1.5 | 1900 | $1,695 | $0.89 | 43d | 1 | 1.31mi |
| 4031 Campbell St Kansas City, MO | 4.0 | 1.5 | 2074 | $2,500 | $1.21 | 16d | 1 | 1.43mi |
| 3902 Wabash Ave Kansas City, MO | 4.0 | 2.0 | 1400 | $1,850 | $1.32 | 43d | 1 | 1.45mi |
Listing history 14 events
-
2026-06-18days on market $159,900 Active 52 DOM
-
2026-06-17days on market $159,900 Active 51 DOM
-
2026-06-16days on market $159,900 Active 50 DOM
-
2026-06-15days on market $159,900 Active 49 DOM
-
2026-06-13days on market $159,900 Active 47 DOM
-
2026-06-09days on market $159,900 Active 43 DOM
-
2026-06-08days on market $159,900 Active 42 DOM
-
2026-06-07days on market $159,900 Active 41 DOM
-
2026-06-05pricedays on market $159,900 Active 38 DOM
-
2026-06-03days on market $184,900 Active 37 DOM
-
2026-06-02days on market $184,900 Active 36 DOM
-
2026-06-01days on market $184,900 Active 35 DOM
-
2026-05-31days on market $184,900 Active 34 DOM
-
2026-04-27$184,900 Active 673-char remark
ⓘ Source: listings_history table (triggers on properties + properties_extension) + one-shot
backfill from property_details.listing_events for pre-trigger history.
Tax reassessment forecast MO · Resets to sale price
- Current annual tax
- $1,138 · $95/mo
- Projected year-2 tax
- $1,551 · $129/mo
- Expected delta
- +$413/yr (+$34/mo · 36.3%)
ⓘ Screening estimate from a state-policy table — verify with the county assessor before closing.
Climate risk First Street
- Flood 1/10 Low FEMA zone X (unshaded) · 0% chance over 30 yrs
- Wildfire 1/10 Low
- Heat 4/10 Moderate 7 d/yr ≥106°F today · 17 d/yr by 30 yrs out
- Wind 2/10 Low
- Air quality 3/10 Moderate 2 unhealthy d/yr today · 4 by 30 yrs out
Nearby sold comps map
Loading sold comps map…
Walkable amenities ~0.75 mi
Loading nearby amenities…
Taxation est. · year 1
- Rental income
- $22,036
- − Mortgage interest
- −$8,957
- − Property taxes
- −$1,138
- − Insurance
- −$800
- − Repairs & maintenance
- −$1,763
- − Management
- −$1,763
- − Depreciation
- −$4,652
- Taxable income
- $2,964
- Est. tax owed @ 24.0%
- −$711
- After-tax cash flow
- $4,697/yr
For passive investors: Depreciation is non-cash, so a rental often shows a tax loss while cash-flowing — sheltering income. Rental losses are passive: they offset passive income freely, and up to $25,000/yr can offset ordinary (W-2) income if you actively participate and your MAGI is under $100k (phasing out to $0 by $150k); unused losses carry forward. On sale, claimed depreciation is recaptured at up to 25%, and gains may owe capital-gains tax (a 1031 exchange can defer both). Figures are a year-1 estimate at your 24.0% rate — not tax advice; consult a CPA.
Schools (NCES district)
- District
- Kansas City 33
- NCES district ID
- 2916400
- Math proficiency
- 12% ▼ -8.00%
- Reading proficiency
- 24% ▬ 0.00%
- Median HH income
- $35,227
- Composite
- 14.8/100
- National rank
- #9387
- State rank
- #308 of 324 in MO
Livability — Kansas City
- Score
- 78/100
- State rank
- #28
- US rank
- #2671
Category grades
Schools grade is shown separately in the Schools card above.
Census & demographics
- Census place
- Kansas City, MO
- County
- Jackson County · 687,798 people
- City population
- 439,467
- Metro
- Kansas City, MO-KS
- Population (ZIP)
- 19,644
- Household income
- $42,221
- Rent vs Own
- Severe rent burden
- 1132.0
Population outlook (Jackson County) Hauer SSP2
- Today (2025)
- 719,589 people
- By 2030
- 731,456 · +1.6%
- By 2040
- 746,689 · +3.8%
- By 2050
- 749,289 · +4.1%
- By 2075
- 736,227 · +2.3%
- By 2100
- 668,210 · -7.1%
Race, ethnicity, and origin ACS 2023
- Neighborhood character
- Predominantly Black (80%)
- Race & ethnicity
- Black 80% White 9% Hispanic / Latino 8% Two or more races 6%
- Hispanic origin (detail)
- Mexican 5%
- Common ancestry
- Lithuanian 1% Swedish 0%
- Foreign-born
- 6% · Canada
- Languages at home
- 92% English-only · Spanish 7%
Political lean MEDSL · Jackson
- 2024 margin
- D (+19.3) · D 58.9% · R 39.5% · Other 1.6%
- 2008→2024 swing
- -6.1pp toward R · 2008: 25.4pp · 2024: 19.3pp
- All cycles
- 2024: D+19.3 2020: D+22.0 2016: D+16.6 2012: D+19.0 2008: D+25.4
Not yet ingested
- Civics
- —
Market trends
- HPI YoY
- ▼ -73.32%
- Current HPI
- 267.491
- Rent YoY
- ▲ 4.42%
- Metro
- Kansas City, MO-KS
- State GDP YoY
- ▲ 1.84%
- F500 in state
- 20
Industry mix (Fortune 500 HQ in MO)
| Industry | F500 HQs | Revenue |
|---|---|---|
| Healthcare | 1 | $163B |
|
||
| Insurance | 1 | $21B |
|
||
| Industrial Technology | 1 | $17B |
|
||
| Retail | 1 | $16B |
|
||
| Industrial Distribution | 1 | $10B |
|
||
| Utilities | 1 | $9B |
|
||
Price history
-13.5% since first listed2 events — show timeline
- 2026-06-04 Price Changed $159,900 Heartland MLS as Distributed by MLS Grid
- 2026-04-27 Listed $184,900 Heartland MLS as Distributed by MLS Grid
Property tax history
+7.9%/yrLatest (2025): $1,138 · -19.5% YoY. Source: county tax records.
Cash-flow waterfall
monthlySold comps — $/sqft
last 12 mo · ≤1 miLoading sold comps…