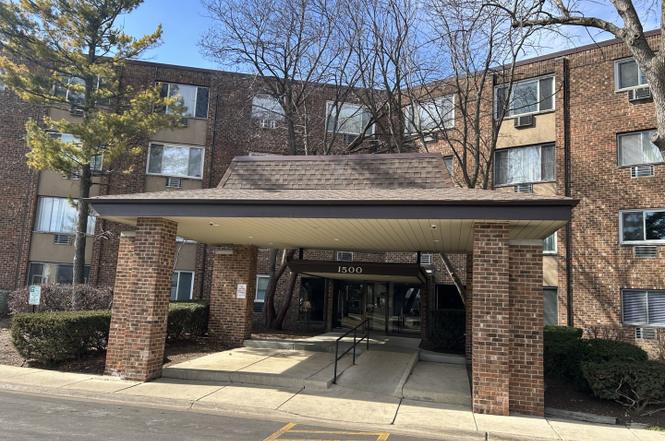
1500 Robin Cir #314 · Hoffman Estates, IL
Flood risk 1/10 · Minimal
- FEMA flood zone
- X (unshaded)
- Chance of flooding over 30 yrs
- 0.0%
- Est. flood insurance / yr
- $507 – $1,088
Fire risk 4/10 · Minor
- Est. fire insurance / yr
- $804 – $1,492
Heat risk 3/10 · Minor
- Hot days now (above 101°F)
- 7 days/yr
- Hot days in 30 yrs
- 14 days/yr
Wind risk 2/10 · Minimal
- Chance of severe wind over 30 yrs
- 0.0%
Air-quality risk 3/10 · Minor
- Unhealthy air days now
- 2 days/yr
- Unhealthy air days in 30 yrs
- 3 days/yr
Risk factors via First Street. Map © Google.
Why this score? — see what drove the D grade
The composite is a weighted blend of 9 inputs, each scored 0–100. Each bar is that input's sub-score; the figure is the points it added to the 100-point composite (weight × sub-score).
- Cash flow +12.2/30.0
- ARV discount +7.5/15.0
- 1% rule +5.6/10.0
- Schools +4.0/10.0
- Livability +3.8/5.0
- DSCR +3.6/10.0
- Rent growth +3.5/5.0
- Condition / age +2.5/5.0
- Appreciation +0.0/10.0
$164,900
🖨 Deal sheet (PDF) 📄 Offer letter ✓ Due diligence
Listing remarks MLS
ONE BEDROOM CONDO IN A QUIET, WELL CARED FOR COMPLEX W/MANY AMENITIES INCLUD'G POOL,PICINIC AREAS, TENNIS COURTS, CLUBHOUSE. ELEVATOR BUILDING, SECURITY ENTRANCE, STORAGE, HOA FEE INCLUDES HEAT, LAUNDRY ON SITE, EASY ACCESS TO X-WAY, SHOPPING, FITNESS CENTER. FANNIE MAE HOME PATH PROPERTY. APPROVED FOR HOMEPATH & HOMEPATH RENOVATION MORTGAGE. CAN BE PURCHASED W/3% DOWN. PER HOA: MUST OWN FOR 24 MOS BEFORE RENTABLE
Key facts
- Clubhouse
- Tennis courts
- Pool
Tags
Property features AI
Finance
- Other: Building contains 144 units; Living area was taped; School bus service available; Subdivision: Moon Lake Village
- Financial info: Special service area: No
- HOA & community: Monthly association fee of $306; Association covers heat, water, gas, parking, insurance, security, clubhouse, pool, exterior maintenance, lawn care, scavenger, and snow removal; Association amenities include coin laundry, storage, pool, tennis court(s), and security door lock(s); Pets allowed (cats and dogs); maximum pet weight widely permitted
Exterior
- Parking: 2 parking spaces; Asphalt surface parking; Unassigned parking
- Security: Security door lock(s); Manager off-site
- Utilities: Water from Lake Michigan and public supply; Public sewer; Electric service with circuit breakers
- Home design: Attached single (condo); Condo ownership; Entry on third level; Disability accessible
- Construction: Brick construction; Brick/mortar foundation; Building age: 41–50 years; Not rebuilt or rehabbed; not built before 1978
- Exterior features: Common grounds; Cul-de-sac; Landscaped grounds
Interior
- Kitchen: Range; Refrigerator; Ceramic tile flooring in kitchen
- Bedrooms: 1 bedroom
- Flooring: Carpet in living room, dining area and bedrooms; Ceramic tile in kitchen
- Bathrooms: 1 full bathroom
- Heating & cooling: Natural gas heating (baseboard); Wall cooling unit(s)
- Interior features: Elevator; Storage; Total of 4 rooms
- Laundry & utility: Laundry room
Neighborhood map
What this means for you Summary
Snapshot
- This is a 1-bed/1.0-bath condo listed at $165k.
Deal economics
- At list price, monthly cash flow is $-32 ($-390/yr) — negative.
- To cash-flow at today's rent, offer at most $159k (3.5% below list).
- Meets the 1% rule at list price ($2k rent vs $165k).
- Recommended offer: $150k (9.0% below list) — sets the bar for market timing.
- Cap rate 6.1% vs local median 3.9% in Hoffman Estates — top-decile yield for the area; either an underpriced asset or a hidden risk that comps aren't pricing in. Stress-test before assuming the spread holds.
Location & tenants
- Location reads 76/100 on livability (#189 in IL, #3,583 nationally) — a middle-class / working-renter tenant base. Strengths: commute A+, employment A+, housing A+; Watch: cost of living C-, amenities F, health & safety F.
- Township Hsd 211 (urban): math 45% / reading 43% proficiency, ranked #89 of 620 in IL (top 14%) — families likely to look elsewhere, expect single-tenant / working-renter base with shorter leases.
- Zoned schools: Neil Armstrong Elem School (math 27% / reading 37%, grade F, #586 of 2,056 statewide, top 31%, 497 students, 0% FRL); Dwight D Eisenhower Jhs (math 36% / reading 51%, grade D, #101 of 665 statewide, top 16%, 617 students, 0% FRL); Hoffman Estates High School (math 39% / reading 36%, grade F, #104 of 693 statewide, top 15%, 2,067 students, 0% FRL).
- Market conditions: Rents rising fast (+4.0%/yr); 87 active listings in the ZIP; 3 comparable units currently listed for rent nearby; rentals leasing fast (median 0d on market — plan ~1-2 weeks tenant-placement turnaround); solid renter incomes; 6,272 units permitted in Cook County in 2024 (4,658 in 5+ unit buildings).
Forward outlook
- Local home prices are declining (-3.0%/yr); year-one equity from $1k of loan paydown is wiped out by about $5k of value loss. Plan a longer hold.
Negotiation context
- It's been on market 111 days — a 9% lower offer ($150k) is reasonable based on typical stale-listing flexibility.
- 2 sale attempts since 13y ago with the ask held roughly flat each time — persistent listings suggest the price (not the market) is what's stuck; bring a comps-based counter.
- Current owner paid $84k; list at $165k implies a 96% gain — meaningful room to come down on a strong offer.
Questions for the listing agent
- What do current leases actually rent for vs. the listed asking? Can we see a recent rent roll and the last 12 months of T-12 income?
- It's been on market 111 days. Have you received any prior offers? Is the seller open to a 9% concession, seller financing, or rate buy-down credit?
- What does the HOA fee cover, when was the last increase, and are there any pending special assessments or reserve-fund shortfalls?
- Any open or pending special assessments — roof, HVAC, plumbing, elevator, façade? What's the per-unit balance and payoff schedule, and is the seller paying it off at close or rolling it to the buyer?
- Why hasn't it sold? Are there any deal-killer items the seller is aware of (foundation, flood, title, zoning, code violations)?
- Is there a deadline driving the sale (1031 exchange, divorce, estate, relocation)? That informs how much negotiation room exists.
- The area grade is low — what's the realistic commute time and amenity access for the typical tenant pool here? Any planned neighborhood developments (good or bad) we should know about?
- What's the average days-on-market for RENTAL listings here right now (not sales)? A rising rental-DOM trend means longer vacancies and softer asking-rent achievability than the comps imply.
- What's the recent tenant-quality profile in this submarket — average credit score on applications, eviction rate, late-payment / NSF rate, and stable-employment percentage? A property-management company in the area should have these aggregated.
- How much new apartment / multifamily construction is in the pipeline within 1–3 miles? Heavy new supply (>2% of stock underway) typically softens rents 12–24 months out; light construction supports rent growth.
Investment metrics
- 1% rule
- 1.06% ✓
- Cap rate
- 6.06%
- Cash-on-cash
- -0.84%
- DSCR
- 0.96
- GRM
- 7.8
CMA / ARV
No comps found within radius.
Projected returns pro-forma
-3.0% appreciation · 4.01% rent growth · sell at horizon
- IRR
- -16.1%
- Equity multiple
- 0.42×
- Total profit
- $-26,796
- Equity at exit
- $24,587
- IRR
- -5.6%
- Equity multiple
- 0.62×
- Total profit
- $-17,668
- Equity at exit
- $14,258
Cash invested: $46,172 (down + closing). Projections, not guarantees.
Landlord ↔ Tenant lean methodology
- Overall (STATE)
- 43 Moderately Tenant-Leaning
- State Illinois
- 43 Moderately Tenant-Leaning · D+7
- County
- — inherits STATE
- City
- — inherits STATE
ZIP-level market 60169
- Rents YoY
- 4.0%
- Active inventory
- 87
- Price-to-rent
- 7.8×
Monthly cashflow live
- Estimated rent
- $1,752 medium interval (Pro) →
- Mortgage (P&I)
- −$865
- Tax from tax record
- −$177 /mo · $2,124/yr
- Insurance
- −$69
- HOA
- −$306
- Vacancy / Maint / Mgmt
- −$368
- Net cashflow
- $-32
Break-even live
Sensitivity live
| Price | -10% $61 | -5% $14 | +0% $-32 | +5% $-79 | +10% $-126 |
|---|---|---|---|---|---|
| Rent | -10% $-171 | -5% $-102 | +0% $-32 | +5% $37 | +10% $106 |
| Rate | -1.0pp $51 | -0.5pp $9 | base $-32 | +0.5pp $-75 | +1.0pp $-119 |
UW: 25.0% down · 7.5% · 30yr · 1.5% tax · 5.0% vac · 8.0% maint · 8.0% mgmt
Financing live
Cash to close
- Down payment
- $41,225
- Closing costs
- $4,947
- Reserves months
- —
- Total cash needed
- —
Loan-product check · same deal, 3 products live
Conventional
25% down · 7.5% · 30yr
- Down + closing
- —
- Monthly P&I
- —
- Monthly cashflow
- —
- DSCR
- —
- Eligible?
- —
Personal DTI + credit; lowest rate.
DSCR
20% down · 8.5% · 30yr
- Down + closing
- —
- Monthly P&I
- —
- Monthly cashflow
- —
- DSCR
- —
- Eligible?
- —
No personal income docs; deal must DSCR.
Hard money
10% down · 12.0% · 12mo
- Down + closing
- —
- Monthly P&I
- —
- Monthly cashflow
- —
- DSCR
- —
- Eligible?
- —
Short-term bridge; refi at stabilization.
Rent comps 3 comps
| Address | Beds | Baths | Sqft | Rent | $/sqft | DOM | Units | Dist |
|---|---|---|---|---|---|---|---|---|
| 1728 Fayette Walk Unit M Hoffman Estates, IL | 1.0 | 1.0 | 750 | $1,600 | $2.13 | 5d | 1 | 0.25mi |
| 1800 Autumn Dr Hoffman Estates, IL | 3.0 | 1.0–2.0 | 1029 | $2,412 | $2.34 | 0d | 31 | 0.58mi |
| 2200 Hassell Rd Hoffman Estates, IL | 3.0 | 1.0–2.0 | 935 | $1,773 | $1.90 | 0d | 85 | 0.86mi |
HOA detail condo
- Monthly dues
- $306 · $3,672/yr
- Likely covers
- poolgymsecurity
- Assessments
- None detected in remarks — confirm with the listing agent.
Listing history 22 events
-
2026-06-21days on market $164,900 Active 111 DOM
-
2026-06-18days on market $164,900 Active 108 DOM
-
2026-06-17days on market $164,900 Active 107 DOM
-
2026-06-16days on market $164,900 Active 106 DOM
-
2026-06-15days on market $164,900 Active 105 DOM
-
2026-06-13days on market $164,900 Active 103 DOM
-
2026-06-13days on market $164,900 Active 102 DOM
-
2026-06-09days on market $164,900 Active 99 DOM
-
2026-06-08days on market $164,900 Active 98 DOM
-
2026-06-07days on market $164,900 Active 97 DOM
-
2026-06-03days on market $164,900 Active 93 DOM
-
2026-06-02days on market $164,900 Active 92 DOM
-
2026-06-02price $164,900 Active 91 DOM
-
2026-06-01days on market $169,900 Active 91 DOM
-
2026-05-31days on market $169,900 Active 90 DOM
-
2026-03-02$169,900 Active
-
2021-03-15soldstatus $84,000
-
2013-09-27soldstatus $36,000 Closed Sale 423-char remark
Show marketing remark (423 chars)
ONE BEDROOM CONDO IN A QUIET, WELL CARED FOR COMPLEX W/MANY AMENITIES INCLUD'G POOL,PICINIC AREAS, TENNIS COURTS, CLUBHOUSE. ELEVATOR BUILDING, SECURITY ENTRANCE, STORAGE, HOA FEE INCLUDES HEAT, LAUNDRY ON SITE, EASY ACCESS TO X-WAY, SHOPPING, FITNESS CENTER. FANNIE MAE HOME PATH PROPERTY. APPROVED FOR HOMEPATH & HOMEPATH RENOVATION MORTGAGE. CAN BE PURCHASED W/3% DOWN. PER HOA: MUST OWN FOR 24 MOS BEFORE RENTABLE
-
2013-08-29status Pending 423-char remark
Show marketing remark (423 chars)
ONE BEDROOM CONDO IN A QUIET, WELL CARED FOR COMPLEX W/MANY AMENITIES INCLUD'G POOL,PICINIC AREAS, TENNIS COURTS, CLUBHOUSE. ELEVATOR BUILDING, SECURITY ENTRANCE, STORAGE, HOA FEE INCLUDES HEAT, LAUNDRY ON SITE, EASY ACCESS TO X-WAY, SHOPPING, FITNESS CENTER. FANNIE MAE HOME PATH PROPERTY. APPROVED FOR HOMEPATH & HOMEPATH RENOVATION MORTGAGE. CAN BE PURCHASED W/3% DOWN. PER HOA: MUST OWN FOR 24 MOS BEFORE RENTABLE
-
2013-08-06$37,000 New 423-char remark
Show marketing remark (423 chars)
ONE BEDROOM CONDO IN A QUIET, WELL CARED FOR COMPLEX W/MANY AMENITIES INCLUD'G POOL,PICINIC AREAS, TENNIS COURTS, CLUBHOUSE. ELEVATOR BUILDING, SECURITY ENTRANCE, STORAGE, HOA FEE INCLUDES HEAT, LAUNDRY ON SITE, EASY ACCESS TO X-WAY, SHOPPING, FITNESS CENTER. FANNIE MAE HOME PATH PROPERTY. APPROVED FOR HOMEPATH & HOMEPATH RENOVATION MORTGAGE. CAN BE PURCHASED W/3% DOWN. PER HOA: MUST OWN FOR 24 MOS BEFORE RENTABLE
-
2004-11-26soldstatus $98,500
-
1997-01-27soldstatus $43,000
ⓘ Source: listings_history table (triggers on properties + properties_extension) + one-shot
backfill from property_details.listing_events for pre-trigger history.
Tax reassessment forecast IL · Partial reset (capped growth)
- Current annual tax
- $2,124 · $177/mo
- Projected year-2 tax
- $2,933 · $244/mo
- Expected delta
- +$810/yr (+$67/mo · 38.1%)
ⓘ Screening estimate from a state-policy table — verify with the county assessor before closing.
Climate risk First Street
- Flood 1/10 Low FEMA zone X (unshaded) · 0% chance over 30 yrs
- Wildfire 4/10 Moderate
- Heat 3/10 Moderate 7 d/yr ≥101°F today · 14 d/yr by 30 yrs out
- Wind 2/10 Low 0% chance of damaging wind over 30 yrs
- Air quality 3/10 Moderate 2 unhealthy d/yr today · 3 by 30 yrs out
Nearby sold comps map
Loading sold comps map…
Walkable amenities ~0.75 mi
Loading nearby amenities…
Taxation est. · year 1
- Rental income
- $21,022
- − Mortgage interest
- −$9,237
- − Property taxes
- −$2,124
- − Insurance
- −$824
- − Repairs & maintenance
- −$1,682
- − Management
- −$1,682
- − HOA
- −$3,672
- − Depreciation
- −$4,797
- Taxable loss
- −$2,996
- Est. tax savings @ 24.0%
- +$719
- After-tax cash flow
- $329/yr
For passive investors: Depreciation is non-cash, so a rental often shows a tax loss while cash-flowing — sheltering income. Rental losses are passive: they offset passive income freely, and up to $25,000/yr can offset ordinary (W-2) income if you actively participate and your MAGI is under $100k (phasing out to $0 by $150k); unused losses carry forward. On sale, claimed depreciation is recaptured at up to 25%, and gains may owe capital-gains tax (a 1031 exchange can defer both). Figures are a year-1 estimate at your 24.0% rate — not tax advice; consult a CPA.
Schools (NCES district)
- District
- Township Hsd 211
- NCES district ID
- 1730450
- Math proficiency
- 45% ▼ -8.00%
- Reading proficiency
- 43% ▼ -4.00%
- Median HH income
- $72,942
- Composite
- 40.02/100
- National rank
- #3824
- State rank
- #89 of 620 in IL
Livability — Hoffman Estates
- Score
- 76/100
- State rank
- #189
- US rank
- #3583
Category grades
Schools grade is shown separately in the Schools card above.
Census & demographics
- Census place
- Hoffman Estates, IL
- County
- Cook County · 4,486,803 people
- City population
- 33,401
- Metro
- Chicago-Naperville-Elgin, IL-IN-WI
- Population (ZIP)
- 33,401
- Household income
- $90,774
- Rent vs Own
- Severe rent burden
- 1123.0
Population outlook (Cook County) Hauer SSP2
- Today (2025)
- 5,347,519 people
- By 2030
- 5,357,703 · +0.2%
- By 2040
- 5,324,924 · -0.4%
- By 2050
- 5,230,762 · -2.2%
- By 2075
- 4,785,735 · -10.5%
- By 2100
- 4,188,836 · -21.7%
Race, ethnicity, and origin ACS 2023
- Neighborhood character
- Diverse neighborhood (Simpson 0.69)
- Race & ethnicity
- White 45% Hispanic / Latino 24% Asian 23% Two or more races 13% Black 4%
- Hispanic origin (detail)
- Mexican 18% Puerto Rican 1%
- Common ancestry
- Romanian 10% Scandinavian 2% Lithuanian 1%
- Foreign-born
- 37% · Canada, China, South Korea
- Languages at home
- 46% English-only · Spanish 21% Other Indo-European 13% Russian/Polish/Slavic 5%
Political lean MEDSL · Cook
- 2024 margin
- Solid D (+42.0) · D 70.4% · R 28.4% · Other 1.2%
- 2008→2024 swing
- -11.4pp toward R · 2008: 53.4pp · 2024: 42.0pp
- All cycles
- 2024: D+42.0 2020: D+50.3 2016: D+53.0 2012: D+49.4 2008: D+53.4
Not yet ingested
- Civics
- —
Market trends
- HPI YoY
- ▼ -187.37%
- Current HPI
- 241.7222
- Rent YoY
- ▲ 4.01%
- Metro
- Chicago-Naperville-Elgin, IL-IN-WI
- State GDP YoY
- ▲ 1.59%
- F500 in state
- 60
Industry mix (Fortune 500 HQ in IL)
| Industry | F500 HQs | Revenue |
|---|---|---|
| Insurance | 4 | $201B |
|
||
| Consumer Goods | 4 | $87B |
|
||
| Industrial Machinery | 3 | $64B |
|
||
| Healthcare | 2 | $55B |
|
||
| Retail / Pharmacy | 1 | $148B |
|
||
| Agriculture / Food | 1 | $86B |
|
||
Price history
+295.1% since first listed7 events — show timeline
- 2026-03-02 Listed $169,900 MRED as Distributed by MLS Grid
- 2021-03-15 Sold (Public Records) $84,000 Public Records
- 2013-09-27 Sold (MLS) $36,000 MRED as Distributed by MLS Grid
- 2013-08-29 Pending — MRED as Distributed by MLS Grid
- 2013-08-06 Listed $37,000 MRED as Distributed by MLS Grid
- 2004-11-26 Sold (Public Records) $98,500 Public Records
- 1997-01-27 Sold (Public Records) $43,000 Public Records
Property tax history
+6.3%/yrLatest (2023): $2,124 · +3.3% YoY. Source: county tax records.
Cash-flow waterfall
monthlySold comps — $/sqft
last 12 mo · ≤1 miLoading sold comps…