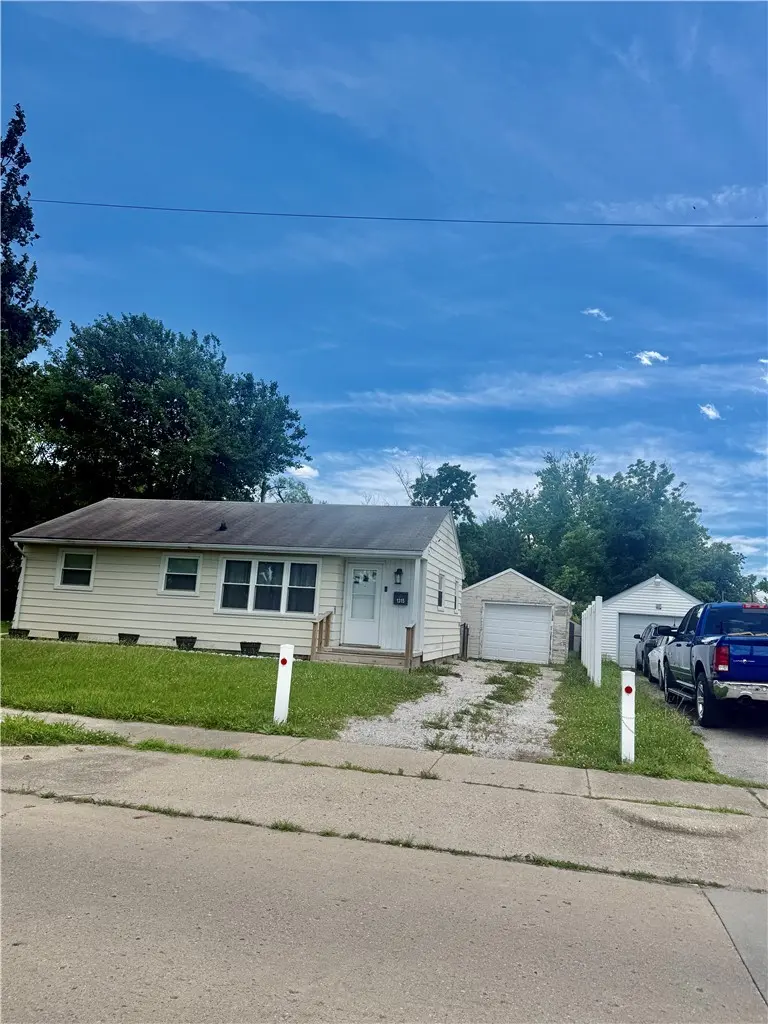
1315 W Division St · Decatur, IL
Flood risk 1/10 · Minimal
- FEMA flood zone
- X (unshaded)
- Chance of flooding over 30 yrs
- 0.0%
- Est. flood insurance / yr
- $473 – $860
Fire risk 1/10 · Minimal
- Est. fire insurance / yr
- $804 – $1,492
Heat risk 3/10 · Minor
- Hot days now (above 105°F)
- 7 days/yr
- Hot days in 30 yrs
- 19 days/yr
Wind risk 2/10 · Minimal
- Chance of severe wind over 30 yrs
- 2.0%
Air-quality risk 2/10 · Minimal
- Unhealthy air days now
- 1 days/yr
- Unhealthy air days in 30 yrs
- 1 days/yr
Risk factors via First Street. Map © Google.
Why this score? — see what drove the C+ grade
The composite is a weighted blend of 9 inputs, each scored 0–100. Each bar is that input's sub-score; the figure is the points it added to the 100-point composite (weight × sub-score).
- Cash flow +30.0/30.0
- 1% rule +10.0/10.0
- DSCR +10.0/10.0
- Appreciation +3.9/10.0
- Livability +3.0/5.0
- Rent growth +2.5/5.0
- Condition / age +2.5/5.0
- Schools +0.4/10.0
- ARV discount +0.0/15.0
$69,897
🖨 Deal sheet (PDF) 📄 Offer letter ✓ Due diligence
Listing remarks
This move-in ready, 3-bedroom, 1-bathroom ranch offers the perfect blend of modern updates and cozy comfort. Designed for easy, single-level living, this home is packed with recent upgrades and impressive outdoor features. Newer paint & flooring makes this home move in ready, while newer windows give peace of mind. The spacious fenced in backyard is the ideal setup for pets, gardening or entertaining & it has a bonus 8x16 shed for added outdoor storage! Don't miss out on this gem! Whether you are a first-time homebuyer, looking to downsize, or seeking a turnkey investment property, this beautifully updated ranch is ready for you to move right in and make it your own.
Key facts
- Recent upgrades
- Fenced in backyard
- Newer windows
Tags
Property features AI
Finance
- Other: Property listed as residential single-family
Exterior
- Parking: Detached garage (1 car)
- Utilities: Public water; Public sewer
- Home design: Single-family residence; One story
- Construction: Aluminum siding; Built with crawl space foundation
- Exterior features: Asphalt roof; Gravel road access; Lot approximately 0.23 acres; Zoned residential
Interior
- Kitchen: Refrigerator
- Bedrooms: 5 total rooms (includes bedrooms and living spaces)
- Bathrooms: 1 full bathroom
- Heating & cooling: Central air conditioning; Natural gas heating
- Interior features: Gas water heater; Crawl space basement
- Laundry & utility: Laundry on main level
Neighborhood map
What this means for you Summary
Snapshot
- This is a 3-bed/1.0-bath single-family listed at $70k.
Deal economics
- At list price, monthly cash flow is $432 ($5k/yr) — positive.
- The deal already cash-flows at list — no discount required.
- Meets the 1% rule at list price ($1k rent vs $70k).
- Cap rate 13.7% vs local median 7.0% in Decatur — top-decile yield for the area; either an underpriced asset or a hidden risk that comps aren't pricing in. Stress-test before assuming the spread holds.
Location & tenants
- Location reads 59/100 on livability (#1,076 in IL) — a working-class tenant base; expect higher turnover. Strengths: cost of living A+, housing A+; Watch: schools F, crime F, amenities F.
- Decatur SD 61 (urban): math 3% / reading 6% proficiency, ranked #605 of 620 in IL (top 98%) — low school quality limits family demand, transient renter base, plan for 1-2y turnover; 73% free/reduced lunch — lower-income household profile, screen leases tightly.
- Market conditions: 135 active listings in the ZIP; 8 comparable units currently listed for rent nearby; rentals lingering (median 45d on market — plan ~5-8 weeks vacancy on turnover, expect pricing pressure); 100% of comp listings sitting > 30 days — soft ceiling on asking rent; 63 units permitted in Macon County in 2024 (0 in 5+ unit buildings).
Forward outlook
- Local home prices are declining (-2.2%/yr); year-one equity from $484 of loan paydown is wiped out by about $2k of value loss. Plan a longer hold.
- Macon County population projected at -24% by 2050 — secular population decline; favor cash flow + early exit over multi-decade hold.
- At projected returns (-2.2% appreciation + 3.0% rent growth), your $20k cash investment doubles in ~5 years — after that, you're playing with house money.
Negotiation context
- Only 2 days on market — expect competitive offers; lowballing is unlikely to land.
Risks & watch-outs
- Watch-outs: built in 1955 — expect roof / HVAC / electrical / plumbing capex.
Questions for the listing agent
- Built in 1955 — when were the roof, HVAC, electrical panel, plumbing, and water heater last replaced?
- Is there a deadline driving the sale (1031 exchange, divorce, estate, relocation)? That informs how much negotiation room exists.
- Schools are F-rated, which usually means shorter tenancies and higher turnover. Who's the typical renter profile here, and what's been the actual vacancy rate?
- Crime grade is F in this area — have there been break-ins, vandalism, or insurance claims at this property in the last 3 years? What carrier currently insures it and at what premium?
- What's the average days-on-market for RENTAL listings here right now (not sales)? A rising rental-DOM trend means longer vacancies and softer asking-rent achievability than the comps imply.
- What's the recent tenant-quality profile in this submarket — average credit score on applications, eviction rate, late-payment / NSF rate, and stable-employment percentage? A property-management company in the area should have these aggregated.
- How much new for-sale + rental construction is in the pipeline within 1–3 miles? Heavy new supply typically softens prices + rents 12–24 months out; constrained supply supports both.
Investment metrics
- 1% rule
- 1.63% ✓
- Cap rate
- 13.72%
- Cash-on-cash
- 26.52%
- DSCR
- 2.18
- GRM
- 5.1
CMA / ARV
- ARV (on-the-fly)
- $46,750
- Comps found
- 12
Show comp detail 12 sales within ~0.75 mi
| Address | Dist | Beds/Ba | Sqft | Sold | Price | $/sf | Match |
|---|---|---|---|---|---|---|---|
| 1429 Walnut Grove Ave | 0.41mi | 2/1.0 (-1) | 884 (+4%) | 1mo | $35,000 | $40 | 68 |
| 2064 N Evandale Dr | 0.49mi | 3/1.5 | 825 (-3%) | 3mo | $65,000 | $79 | 67 |
| 947 N Hill Ave | 0.59mi | 2/1.0 (-1) | 832 (-2%) | 3mo | $54,500 | $66 | 62 |
| 1059 Packard St | 0.53mi | 2/2.0 (-1) | 837 (-2%) | 3mo | $76,500 | $91 | 61 |
| 1828 W Leafland Ave | 0.50mi | 2/1.0 (-1) | 777 (-9%) | 2mo | $28,500 | $37 | 56 |
| 1415 N Dennis Ave | 0.36mi | 2/1.0 (-1) | 740 (-13%) | 2mo | $22,500 | $30 | 55 |
| 1524 N Summit Ave | 0.50mi | 2/1.0 (-1) | 776 (-9%) | 4mo | $39,000 | $50 | 54 |
| 2094 N Dennis Ave | 0.48mi | 3/1.0 | 950 (+12%) | 5mo | $52,000 | $55 | 54 |
| 794 W Waggoner St | 0.63mi | 2/1.0 (-1) | 923 (+9%) | 0mo | $29,000 | $31 | 51 |
| 1213 W Marietta St | 0.52mi | 2/1.0 (-1) | 748 (-12%) | 2mo | $65,000 | $87 | 49 |
| 1126 N Oakcrest Ave | 0.62mi | 2/1.0 (-1) | 768 (-10%) | 4mo | $50,000 | $65 | 47 |
| 1356 Huron St | 0.72mi | 3/1.0 | 936 (+10%) | 5mo | $31,500 | $34 | 45 |
Match score weights: distance 35% · size 25% · config 20% · recency 20%. Top-matched comps best support the ARV.
Projected returns pro-forma
-2.21% appreciation · 3.0% rent growth · sell at horizon
- IRR
- 22.1%
- Equity multiple
- 1.95×
- Total profit
- $18,549
- Equity at exit
- $12,894
- IRR
- 29.1%
- Equity multiple
- 3.74×
- Total profit
- $53,698
- Equity at exit
- $10,377
Cash invested: $19,571 (down + closing). Projections, not guarantees.
Landlord ↔ Tenant lean methodology
- Overall (STATE)
- 43 Moderately Tenant-Leaning
- State Illinois
- 43 Moderately Tenant-Leaning · D+7
- County
- — inherits STATE
- City
- — inherits STATE
ZIP-level market 62526
- Home prices YoY
- -1.2%
- Active inventory
- 135
- Price-to-rent
- 5.1×
Monthly cashflow live
- Estimated rent
- $1,138 high interval (Pro) →
- Mortgage (P&I)
- −$367
- Tax from tax record
- −$71 /mo · $855/yr
- Insurance
- −$29
- HOA
- −$0
- Vacancy / Maint / Mgmt
- −$239
- Net cashflow
- $432
Break-even live
Sensitivity live
| Price | -10% $472 | -5% $452 | +0% $432 | +5% $413 | +10% $393 |
|---|---|---|---|---|---|
| Rent | -10% $343 | -5% $387 | +0% $432 | +5% $477 | +10% $522 |
| Rate | -1.0pp $468 | -0.5pp $450 | base $432 | +0.5pp $414 | +1.0pp $396 |
UW: 25.0% down · 7.5% · 30yr · 1.5% tax · 5.0% vac · 8.0% maint · 8.0% mgmt
Financing live
Cash to close
- Down payment
- $17,474
- Closing costs
- $2,097
- Reserves months
- —
- Total cash needed
- —
Loan-product check · same deal, 3 products live
Conventional
25% down · 7.5% · 30yr
- Down + closing
- —
- Monthly P&I
- —
- Monthly cashflow
- —
- DSCR
- —
- Eligible?
- —
Personal DTI + credit; lowest rate.
DSCR
20% down · 8.5% · 30yr
- Down + closing
- —
- Monthly P&I
- —
- Monthly cashflow
- —
- DSCR
- —
- Eligible?
- —
No personal income docs; deal must DSCR.
Hard money
10% down · 12.0% · 12mo
- Down + closing
- —
- Monthly P&I
- —
- Monthly cashflow
- —
- DSCR
- —
- Eligible?
- —
Short-term bridge; refi at stabilization.
Rent comps 8 comps
| Address | Beds | Baths | Sqft | Rent | $/sqft | DOM | Units | Dist |
|---|---|---|---|---|---|---|---|---|
| 1345 N Fairview Ave Decatur, IL | 3.0 | 1.0 | 785 | $985 | $1.25 | 44d | 1 | 0.19mi |
| 1311 N Walnut Grove Ave Decatur, IL | 2.0 | 1.0 | 781 | $1,100 | $1.41 | 44d | 1 | 0.45mi |
| 1091 N Oakcrest Ave Decatur, IL | 2.0 | 1.0 | 672 | $950 | $1.41 | 44d | 1 | 0.68mi |
| 2148 N Graceland Ave Decatur, IL | 2.0 | 1.0 | 864 | $1,195 | $1.38 | 44d | 1 | 0.81mi |
| 1045 N Monroe St Decatur, IL | 3.0 | 2.0 | 1094 | $1,000 | $0.91 | 44d | 1 | 0.86mi |
| 1245 N Union St Decatur, IL | 3.0 | 2.0 | 1111 | $995 | $0.90 | 44d | 1 | 1.02mi |
| 853 N College St Decatur, IL | 2.0 | 1.0 | 936 | $925 | $0.99 | 44d | 1 | 1.02mi |
| 1908 N Union St Decatur, IL | 2.0 | 1.0 | 704 | $899 | $1.28 | 44d | 1 | 1.04mi |
Listing history 3 events
-
2026-06-19days on market $69,897 Active 2 DOM
-
2026-06-18remarks 679-char remark
-
2026-06-18$69,897 Active 1 DOM
ⓘ Source: listings_history table (triggers on properties + properties_extension) + one-shot
backfill from property_details.listing_events for pre-trigger history.
Tax reassessment forecast IL · Partial reset (capped growth)
- Current annual tax
- $855 · $71/mo
- Projected year-2 tax
- $1,221 · $102/mo
- Expected delta
- +$366/yr (+$30/mo · 42.8%)
ⓘ Screening estimate from a state-policy table — verify with the county assessor before closing.
Climate risk First Street
- Flood 1/10 Low FEMA zone X (unshaded) · 0% chance over 30 yrs
- Wildfire 1/10 Low
- Heat 3/10 Moderate 7 d/yr ≥105°F today · 19 d/yr by 30 yrs out
- Wind 2/10 Low 2% chance of damaging wind over 30 yrs
- Air quality 2/10 Low 1 unhealthy d/yr today · 1 by 30 yrs out
Nearby sold comps map
Loading sold comps map…
Walkable amenities ~0.75 mi
Loading nearby amenities…
Taxation est. · year 1
- Rental income
- $13,661
- − Mortgage interest
- −$3,915
- − Property taxes
- −$855
- − Insurance
- −$349
- − Repairs & maintenance
- −$1,093
- − Management
- −$1,093
- − Depreciation
- −$2,033
- Taxable income
- $4,323
- Est. tax owed @ 24.0%
- −$1,037
- After-tax cash flow
- $4,152/yr
For passive investors: Depreciation is non-cash, so a rental often shows a tax loss while cash-flowing — sheltering income. Rental losses are passive: they offset passive income freely, and up to $25,000/yr can offset ordinary (W-2) income if you actively participate and your MAGI is under $100k (phasing out to $0 by $150k); unused losses carry forward. On sale, claimed depreciation is recaptured at up to 25%, and gains may owe capital-gains tax (a 1031 exchange can defer both). Figures are a year-1 estimate at your 24.0% rate — not tax advice; consult a CPA.
Schools (NCES district)
- District
- Decatur SD 61
- NCES district ID
- 1711850
- Math proficiency
- 3% ▼ -4.00%
- Reading proficiency
- 6% ▼ -6.00%
- Median HH income
- $38,864
- Composite
- 3.99/100
- National rank
- #10059
- State rank
- #605 of 620 in IL
Livability — Decatur
- Score
- 59/100
- State rank
- #1076
- US rank
- #20533
Category grades
Schools grade is shown separately in the Schools card above.
Census & demographics
- Census place
- Decatur, IL
- County
- Macon County · 78,333 people
- City population
- 78,333
- Metro
- Decatur, IL
- Population (ZIP)
- 30,483
- Household income
- $49,062
- Rent vs Own
- Severe rent burden
- 1041.0
Population outlook (Macon County) Hauer SSP2
- Today (2025)
- 99,568 people
- By 2030
- 94,973 · -4.6%
- By 2040
- 85,250 · -14.4%
- By 2050
- 75,920 · -23.8%
- By 2075
- 55,962 · -43.8%
- By 2100
- 36,468 · -63.4%
Race, ethnicity, and origin ACS 2023
- Neighborhood character
- Predominantly White (68%)
- Race & ethnicity
- White 68% Black 22% Two or more races 6% Hispanic / Latino 3% Asian 2%
- Common ancestry
- Lithuanian 2% Italian 2% Slovak 2%
- Foreign-born
- 4% · Canada
- Languages at home
- 95% English-only · Spanish 2% Other Indo-European 1%
Political lean MEDSL · Macon
- 2024 margin
- R (+18.9) · D 39.8% · R 58.7% · Other 1.4%
- 2008→2024 swing
- -20.0pp toward R · 2008: 1.1pp · 2024: -18.9pp
- All cycles
- 2024: R+18.9 2020: R+17.7 2016: R+18.1 2012: R+5.2 2008: D+1.1
Not yet ingested
- Civics
- —
Market trends
- HPI YoY
- ▼ -2.21%
- Current HPI
- 182.871
- Rent YoY
- —
- Metro
- Decatur, IL
- State GDP YoY
- ▲ 1.59%
- F500 in state
- 60
Industry mix (Fortune 500 HQ in IL)
| Industry | F500 HQs | Revenue |
|---|---|---|
| Insurance | 4 | $201B |
|
||
| Consumer Goods | 4 | $87B |
|
||
| Industrial Machinery | 3 | $64B |
|
||
| Healthcare | 2 | $55B |
|
||
| Retail / Pharmacy | 1 | $148B |
|
||
| Agriculture / Food | 1 | $86B |
|
||
Price history
1 event — show timeline
- 2026-06-17 Listed $69,897 CIBR
Property tax history
-0.1%/yrLatest (2024): $855 · -26.2% YoY. Source: county tax records.
Cash-flow waterfall
monthlySold comps — $/sqft
last 12 mo · ≤1 miLoading sold comps…