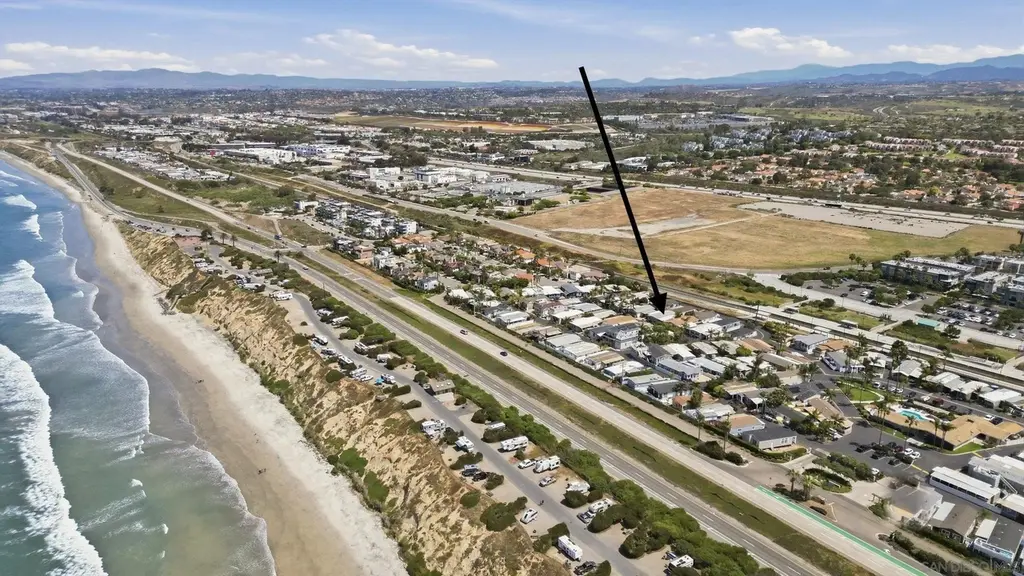
6550 Ponto Dr #135 · Carlsbad, CA
Flood risk 1/10 · Minimal
- FEMA flood zone
- X (unshaded)
- Chance of flooding over 30 yrs
- 0.0%
- Est. flood insurance / yr
- $507 – $1,088
Fire risk 1/10 · Minimal
- Est. fire insurance / yr
- $659 – $1,223
Heat risk 5/10 · Moderate
- Hot days now (above 82°F)
- 7 days/yr
- Hot days in 30 yrs
- 21 days/yr
Wind risk 1/10 · Minimal
- Chance of severe wind over 30 yrs
- —
Air-quality risk 3/10 · Minor
- Unhealthy air days now
- 4 days/yr
- Unhealthy air days in 30 yrs
- 4 days/yr
Risk factors via First Street. Map © Google.
Why this score? — see what drove the A- grade
The composite is a weighted blend of 9 inputs, each scored 0–100. Each bar is that input's sub-score; the figure is the points it added to the 100-point composite (weight × sub-score).
- Cash flow +30.0/30.0
- 1% rule +10.0/10.0
- DSCR +10.0/10.0
- ARV discount +8.7/15.0
- Schools +6.5/10.0
- Appreciation +5.9/10.0
- Livability +3.9/5.0
- Rent growth +3.4/5.0
- Condition / age +2.5/5.0
$285,000
🖨 Deal sheet 📄 Offer letter ✓ Due diligence
Listing remarks
Live the Southern California dream in this charming beach cottage just steps from the sand! Tucked in a private, quiet Carlsbad location with serene meadow views, this well-maintained 2-bedroom home with optional 3rd bedroom or office features numerous windows that fill the space with natural light, beautiful wood floors with inlays, and a flexible layout. Enjoy coastal living with ocean breezes, a wrap-around wood deck, private courtyard, and low-maintenance outdoor space—perfect for relaxing or entertaining. Additional features include a large storage shed, carport, and in-home laundry and community clubhouse, game room, sauna, pool and spa. Located in a desirable all-ages park surr
Key facts
- Community clubhouse
- Sauna
- Game room
Tags
Property features AI
Finance
- Other: Located in CARLSBAD SOUTH subdivision (Lanikai Lane building); Directions: Go past Visitor Center, hang left, then right towards back of the park. Unit 135.
- HOA & community: Community clubhouse; Meeting room; Picnic area; Barbecue area; Pool; Spa/Hot Tub; Fitness center; Recreation facilities; Security (included in association fees)
Exterior
- Parking: 2 parking spaces
- Security: Security guard; 24-hour security
- Utilities: Sewer connected; Water connected; Electricity available and connected; Natural gas available and connected
- Home design: Manufactured home; Single-story
- Construction: Vinyl siding; Composition roof
- Exterior features: Wrap-around deck; Partial fencing; Community pool; Spa/Hot tub; Shed(s)
Interior
- Kitchen: Microwave; Refrigerator; Gas oven; Ice maker; Gas range; Gas cooktop; Range hood
- Bedrooms: 3 possible bedrooms
- Bathrooms: 2 full bathrooms
- Heating & cooling: Forced air heating (natural gas); Wall/window cooling units
- Interior features: Sauna; Ceiling fans; Has view; Smoke detectors
Neighborhood map
What this means for you Summary
Snapshot
- This is a 2-bed/2.0-bath manufactured listed at $285k.
Deal economics
- At list price, monthly cash flow is $2k ($23k/yr) — positive.
- The deal already cash-flows at list — no discount required.
- Meets the 1% rule at list price ($4k rent vs $285k).
- Recommended offer: $281k (1.5% below list) — sets the bar for market timing.
- Cap rate 14.2% vs local median 2.1% in Carlsbad — top-decile yield for the area; either an underpriced asset or a hidden risk that comps aren't pricing in. Stress-test before assuming the spread holds.
Location & tenants
- Location reads 78/100 on livability (#67 in CA, #2,526 nationally) — a middle-class / working-renter tenant base. Strengths: schools A+, amenities A+, commute A+; Watch: health & safety D+, cost of living F.
- Carlsbad Unified (urban): math 68% / reading 76% proficiency, ranked #87 of 1,400 in CA (top 6%) — strong family-tenant draw, lease renewals of 3-5y typical; only 18% free/reduced lunch — higher-income household profile.
- Market conditions: Rents rising (+3.5%/yr); 96 active listings in the ZIP; 17 comparable units currently listed for rent nearby; rentals lingering (median 44d on market — plan ~5-8 weeks vacancy on turnover, expect pricing pressure); 53% of comp listings sitting > 30 days — soft ceiling on asking rent; high-income renter base; 11,759 units permitted in San Diego County in 2024 (7,244 in 5+ unit buildings).
- This rent runs 34% of the median local income ($159k/yr) — at the standard rent-burdened threshold; future hikes will face affordability resistance.
Forward outlook
- In year one you build about $7k of equity ($2k loan paydown + $5k appreciation (1.8% local appreciation)).
- San Diego County population projected at +20% by 2050 — long-run rental-demand tailwind backs the buy-and-hold thesis.
- At projected returns (1.8% appreciation + 3.5% rent growth), your $80k cash investment doubles in ~3 years — after that, you're playing with house money.
- By year 5, paydown + projected appreciation supports a ~$31k cash-out refi (75% LTV) — recoverable capital for the next deal without selling this one.
Negotiation context
- It's been on market 17 days — a 2% lower offer ($281k) is reasonable based on typical stale-listing flexibility.
- 12 sale attempts since 8y ago with the ask held roughly flat each time — persistent listings suggest the price (not the market) is what's stuck; bring a comps-based counter.
Risks & watch-outs
- Climate carrying-cost: extreme-heat days projected 7→21/yr by 2055 (HVAC capex compounding) — expect insurance premiums to compound above CPI over the hold.
Questions for the listing agent
- Is there a deadline driving the sale (1031 exchange, divorce, estate, relocation)? That informs how much negotiation room exists.
- Schools are A-rated — typically a magnet for longer-tenancy family renters. What's the average tenant stay here, and is there a school-zone premium baked into asking?
- What's the average days-on-market for RENTAL listings here right now (not sales)? A rising rental-DOM trend means longer vacancies and softer asking-rent achievability than the comps imply.
- What's the recent tenant-quality profile in this submarket — average credit score on applications, eviction rate, late-payment / NSF rate, and stable-employment percentage? A property-management company in the area should have these aggregated.
- How much new for-sale + rental construction is in the pipeline within 1–3 miles? Heavy new supply typically softens prices + rents 12–24 months out; constrained supply supports both.
Investment metrics
- 1% rule
- 1.57% ✓
- Cap rate
- 14.19%
- Cash-on-cash
- 28.20%
- DSCR
- 2.25
- GRM
- 5.3
CMA / ARV
- ARV (median comp)
- $292,929
- List price
- $285,000
- Delta
- -2.71%
- Verdict
- FAIR
- Comps
- 14 within 1.0 mi
Show comp detail 6 sales within ~0.75 mi
| Address | Dist | Beds/Ba | Sqft | Sold | Price | $/sf | Match |
|---|---|---|---|---|---|---|---|
| 6550 Ponto Dr #135 | 0.00mi | 2/2.0 | 1,152 (0%) | 1mo | $265,000 | $230 | 99 |
| 6550 Ponto Dr #110 | 0.04mi | 2/1.5 | 1,100 (-4%) | 3mo | $310,000 | $282 | 86 |
| 6550 Ponto Dr #34 | 0.04mi | 2/2.0 | 1,040 (-10%) | 13mo | $150,000 | $144 | 72 |
| 6550 Ponto Dr #83 | 0.00mi | 3/2.0 (+1) | 1,200 (+4%) | 22mo | $295,000 | $246 | 70 |
| 6550 Ponto Dr #143 | 0.04mi | 3/2.0 (+1) | 1,200 (+4%) | 21mo | $200,000 | $167 | 68 |
| 7028 San Bartolo St | 0.58mi | 2/2.0 | 1,248 (+8%) | 18mo | $308,000 | $247 | 44 |
Match score weights: distance 35% · size 25% · config 20% · recency 20%. Top-matched comps best support the ARV.
Projected returns pro-forma
1.75% appreciation · 3.54% rent growth · sell at horizon
- IRR
- 32.3%
- Equity multiple
- 2.73×
- Total profit
- $137,671
- Equity at exit
- $108,557
- IRR
- 34.1%
- Equity multiple
- 5.39×
- Total profit
- $350,308
- Equity at exit
- $153,414
Cash invested: $79,800 (down + closing). Projections, not guarantees.
Landlord ↔ Tenant lean methodology
- Overall (STATE)
- 18 Strongly Tenant-Friendly
- State California
- 18 Strongly Tenant-Friendly · D+13
- County
- — inherits STATE
- City
- — inherits STATE
ZIP-level market 92011
- Home prices YoY
- 0.4%
- Rents YoY
- 3.5%
- Active inventory
- 96
- Price-to-rent
- 5.3×
Monthly cashflow live
- Estimated rent
- $4,482 high interval (Pro) →
- Mortgage (P&I)
- −$1,495
- Tax from tax record
- −$53 /mo · $631/yr
- Insurance
- −$119
- HOA
- −$0
- Vacancy / Maint / Mgmt
- −$941
- Net cashflow
- $1,875
Break-even live
UW: 25.0% down · 7.5% · 30yr · 1.5% tax · 5.0% vac · 8.0% maint · 8.0% mgmt
Financing live
Cash to close
- Down payment
- $71,250
- Closing costs
- $8,550
- Reserves months
- —
- Total cash needed
- —
Loan-product check · same deal, 3 products live
Conventional
25% down · 7.5% · 30yr
- Down + closing
- —
- Monthly P&I
- —
- Monthly cashflow
- —
- DSCR
- —
- Eligible?
- —
Personal DTI + credit; lowest rate.
DSCR
20% down · 8.5% · 30yr
- Down + closing
- —
- Monthly P&I
- —
- Monthly cashflow
- —
- DSCR
- —
- Eligible?
- —
No personal income docs; deal must DSCR.
Hard money
10% down · 12.0% · 12mo
- Down + closing
- —
- Monthly P&I
- —
- Monthly cashflow
- —
- DSCR
- —
- Eligible?
- —
Short-term bridge; refi at stabilization.
Rent comps 17 comps
| Address | Beds | Baths | Sqft | Rent | $/sqft | DOM | Units | Dist |
|---|---|---|---|---|---|---|---|---|
| 6790 Embarcadero Ln Carlsbad, CA | 1.0–2.0 | 2.0–2.5 | 2104 | $5,750 | $2.73 | 5d | 1 | 0.17mi |
| 820 Windcrest Dr Carlsbad, CA | 3.0 | 2.0 | 1404 | $5,581 | $3.98 | 18d | 1 | 0.43mi |
| 6923 Whitecap Dr Carlsbad, CA | 3.0 | 2.0 | 1246 | $5,250 | $4.21 | 43d | 1 | 0.57mi |
| 902 Caminito Madrigal Unit B Carlsbad, CA | 2.0 | 1.0 | 897 | $3,200 | $3.57 | 10d | 1 | 0.64mi |
| 916 Caminito Estrada Unit B Carlsbad, CA | 2.0 | 2.0 | 1188 | $3,650 | $3.07 | 43d | 1 | 0.66mi |
| 908 Caminito Madrigal Carlsbad, CA | 2.0 | 2.0 | 897 | $4,500 | $5.02 | 43d | 1 | 0.68mi |
| 908 Caminito Madrigal Unit D Carlsbad, CA | 2.0 | 1.5 | 897 | $4,500 | $5.02 | 43d | 1 | 0.69mi |
| 6675 Paseo del Norte Unit B Carlsbad, CA | 2.0 | 2.0 | 959 | $4,300 | $4.48 | 43d | 1 | 0.70mi |
| 6675 Paseo del Norte Unit A Carlsbad, CA | 2.0 | 2.0 | 959 | $3,850 | $4.01 | 5d | 1 | 0.70mi |
| 6677 Paseo Del Norte Carlsbad, CA | 2.0 | 2.0 | 959 | $4,500 | $4.69 | 43d | 1 | 0.71mi |
| 6677 Paseo del Norte Unit B Carlsbad, CA | 2.0 | 1.0 | 959 | $3,950 | $4.12 | 43d | 1 | 0.71mi |
| 6555 Sea Gate Rd Carlsbad, CA | 2.0 | 2.0 | 1114 | $4,095 | $3.67 | 1d | 3 | 0.75mi |
| 925 Wind Drift Dr Carlsbad, CA | 2.0 | 2.5 | 1110 | $3,895 | $3.51 | 43d | 1 | 0.76mi |
| 6938 Seascape Dr Carlsbad, CA | 1.0–2.0 | 1.0–2.0 | 810 | $3,775 | $4.66 | 3d | 9 | 0.84mi |
| 6811 Alderwood Dr Carlsbad, CA | 2.0 | 2.0 | 1292 | $3,850 | $2.98 | 43d | 1 | 0.88mi |
| 6910 Peachtree Rd Unit 1546353P Carlsbad, CA | 3.0 | 2.0 | 1399 | $6,129 | $4.38 | 16d | 1 | 0.99mi |
| 1205 Aviara Pkwy Carlsbad, CA | 1.0–2.0 | 1.0–2.0 | 917 | $4,880 | $5.32 | 2d | 42 | 1.37mi |
Listing history 36 events
-
2026-05-12status Pending 1168-char remark
-
2026-04-23$285,000 Active 1168-char remark
-
2025-05-20historical
-
2025-03-29price $359,000
-
2025-02-23$369,000 Active
-
2025-02-12historical
-
2024-10-04price $379,000
-
2024-09-08price $389,999
-
2024-07-19$399,000 Active
-
2019-12-30soldstatus $62,000 Sold
-
2019-12-30soldstatus $62,000 Closed Sale
-
2019-12-11status Pending Sale
-
2019-12-11status Pending
-
2019-11-06status Active
-
2019-11-06status Active
-
2019-10-23status Pending Sale
-
2019-10-23status Pending
-
2019-07-02status Active
-
2019-07-02status Active
-
2019-07-01historical
-
2019-06-30historical
-
2019-06-25price $70,000
-
2019-06-25price $70,000
-
2019-03-27price $119,888
-
2019-03-27price $119,888
-
2019-03-07price $125,000
-
2019-03-07price $125,000
-
2019-03-05$149,000 Active
-
2019-03-05$149,000 Active
-
2019-03-02historical
-
2019-03-02historical
-
2019-01-16$150,000 Active
-
2019-01-16$150,000 Active
-
2018-12-22historical
-
2018-12-11price $150,000
-
2018-11-05$175,000 Active
ⓘ Source: listings_history table (triggers on properties + properties_extension) + one-shot
backfill from property_details.listing_events for pre-trigger history.
Tax reassessment forecast CA · Resets to sale price
- Current annual tax
- $631 · $53/mo
- Projected year-2 tax
- $2,166 · $180/mo
- Expected delta
- +$1,535/yr (+$128/mo · 243.3%)
ⓘ Screening estimate from a state-policy table — verify with the county assessor before closing.
Climate risk First Street
- Flood 1/10 Low FEMA zone X (unshaded) · 0% chance over 30 yrs
- Wildfire 1/10 Low
- Heat 5/10 Major 7 d/yr ≥82°F today · 21 d/yr by 30 yrs out
- Wind 1/10 Low
- Air quality 3/10 Moderate 4 unhealthy d/yr today · 4 by 30 yrs out
Nearby sold comps map
Loading sold comps map…
Walkable amenities ~0.75 mi
Loading nearby amenities…
Taxation est. · year 1
- Rental income
- $53,787
- − Mortgage interest
- −$15,964
- − Property taxes
- −$631
- − Insurance
- −$1,425
- − Repairs & maintenance
- −$4,303
- − Management
- −$4,303
- − Depreciation
- −$8,291
- Taxable income
- $18,870
- Est. tax owed @ 24.0%
- −$4,529
- After-tax cash flow
- $17,972/yr
For passive investors: Depreciation is non-cash, so a rental often shows a tax loss while cash-flowing — sheltering income. Rental losses are passive: they offset passive income freely, and up to $25,000/yr can offset ordinary (W-2) income if you actively participate and your MAGI is under $100k (phasing out to $0 by $150k); unused losses carry forward. On sale, claimed depreciation is recaptured at up to 25%, and gains may owe capital-gains tax (a 1031 exchange can defer both). Figures are a year-1 estimate at your 24.0% rate — not tax advice; consult a CPA.
Schools (NCES district)
- District
- Carlsbad Unified
- NCES district ID
- 0607500
- Math proficiency
- 68% ▲ 2.00%
- Reading proficiency
- 76% ▲ 2.00%
- Median HH income
- $81,200
- Composite
- 65.11/100
- National rank
- #1068
- State rank
- #87 of 1400 in CA
Livability — Carlsbad
- Score
- 78/100
- State rank
- #67
- US rank
- #2526
Category grades
Schools grade is shown separately in the Schools card above.
Census & demographics
- Census place
- Carlsbad, CA
- County
- San Diego County · 3,178,799 people
- City population
- 114,373
- Metro
- San Diego-Chula Vista-Carlsbad, CA
- Population (ZIP)
- 23,190
- Household income
- $159,235
- Rent vs Own
- Severe rent burden
- 714.0
Population outlook (San Diego County) Hauer SSP2
- Today (2025)
- 3,678,185 people
- By 2030
- 3,856,546 · +4.8%
- By 2040
- 4,171,407 · +13.4%
- By 2050
- 4,421,607 · +20.2%
- By 2075
- 4,831,599 · +31.4%
- By 2100
- 4,832,502 · +31.4%
Race, ethnicity, and origin ACS 2023
- Neighborhood character
- Majority White (64%)
- Race & ethnicity
- White 64% Hispanic / Latino 17% Two or more races 15% Asian 12%
- Hispanic origin (detail)
- Mexican 12%
- Common ancestry
- Portuguese 4% Slovak 3% Italian 3%
- Foreign-born
- 16% · Canada, China, Vietnam
- Languages at home
- 82% English-only · Spanish 6% Chinese 4% German/W. Germanic 2%
Political lean MEDSL · San Diego
- 2024 margin
- D (+16.8) · D 56.9% · R 40.1% · Other 2.9%
- 2008→2024 swing
- +6.6pp toward D · 2008: 10.2pp · 2024: 16.8pp
- All cycles
- 2024: D+16.8 2020: D+22.8 2016: D+17.8 2012: D+5.1 2008: D+10.2
Not yet ingested
- Civics
- —
Market trends
- HPI YoY
- ▲ 1.75%
- Current HPI
- 399.8502
- Rent YoY
- ▲ 3.54%
- Metro
- San Diego-Chula Vista-Carlsbad, CA
- State GDP YoY
- ▲ 3.21%
- F500 in state
- 116
Industry mix (Fortune 500 HQ in CA)
| Industry | F500 HQs | Revenue |
|---|---|---|
| Technology | 27 | $1,492B |
|
||
| Financial Services | 3 | $174B |
|
||
| Retail | 3 | $44B |
|
||
| Insurance | 3 | $26B |
|
||
| Media / Entertainment | 2 | $115B |
|
||
| Pharmaceuticals / Biotech | 2 | $62B |
|
||
Price history
+51.4% since first listed37 events — show timeline
- 2026-05-29 Sold (MLS) $265,000 SDMLS
- 2026-05-12 Pending — SDMLS
- 2026-04-23 Listed $285,000 SDMLS
- 2025-05-20 Listing Removed — CRMLS
- 2025-03-29 Price Changed $359,000 CRMLS
- 2025-02-23 Listed $369,000 CRMLS
- 2025-02-12 Listing Removed — CRMLS
- 2024-10-04 Price Changed $379,000 CRMLS
- 2024-09-08 Price Changed $389,999 CRMLS
- 2024-07-19 Listed $399,000 CRMLS
- 2019-12-30 Sold (MLS) $62,000 SDMLS
- 2019-12-30 Sold (MLS) $62,000 CRMLS
- 2019-12-11 Pending — CRMLS
- 2019-12-11 Pending — SDMLS
- 2019-11-06 Relisted — CRMLS
- 2019-11-06 Relisted — SDMLS
- 2019-10-23 Pending — CRMLS
- 2019-10-23 Pending — SDMLS
- 2019-07-02 Relisted — CRMLS
- 2019-07-02 Relisted — SDMLS
- 2019-07-01 Listing Removed — SDMLS
- 2019-06-30 Listing Removed — CRMLS
- 2019-06-25 Price Changed $70,000 CRMLS
- 2019-06-25 Price Changed $70,000 SDMLS
- 2019-03-27 Price Changed $119,888 SDMLS
- 2019-03-27 Price Changed $119,888 CRMLS
- 2019-03-07 Price Changed $125,000 SDMLS
- 2019-03-07 Price Changed $125,000 CRMLS
- 2019-03-05 Listed $149,000 SDMLS
- 2019-03-05 Listed $149,000 CRMLS
- 2019-03-02 Listing Removed — CRMLS
- 2019-03-02 Listing Removed — SDMLS
- 2019-01-16 Listed $150,000 CRMLS
- 2019-01-16 Listed $150,000 SDMLS
- 2018-12-22 Listing Removed — CRMLS
- 2018-12-11 Price Changed $150,000 CRMLS
- 2018-11-05 Listed $175,000 CRMLS
Property tax history
+2.1%/yrLatest (2013): $631 · +1.9% YoY. Source: county tax records.
Cash-flow waterfall
monthlySold comps — $/sqft
last 12 mo · ≤1 miLoading sold comps…