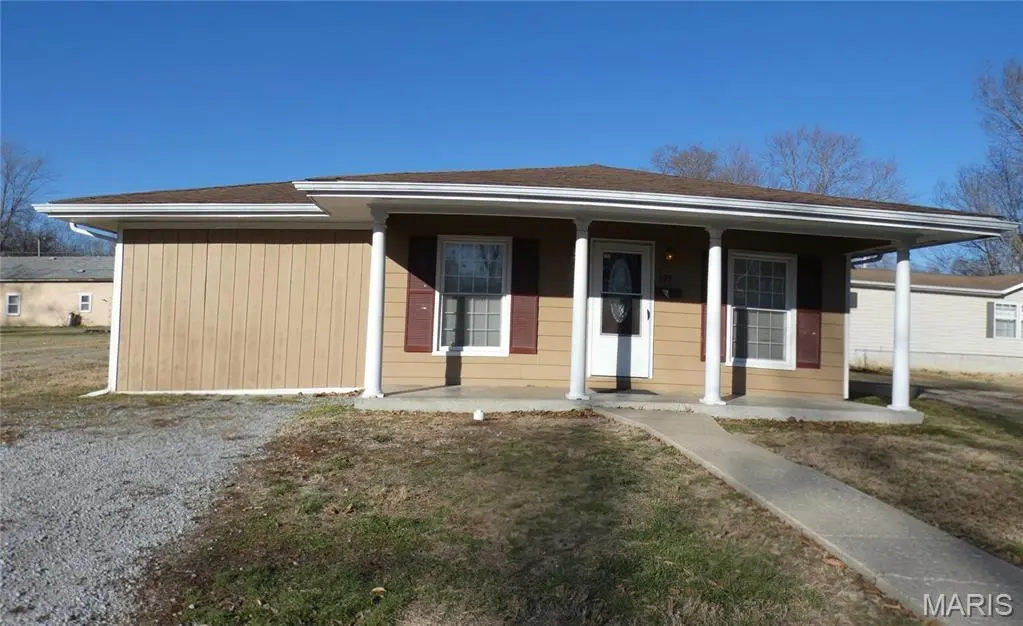
409 E Mound St · Sparta, IL
Flood risk 1/10 · Minimal
- FEMA flood zone
- X (unshaded)
- Chance of flooding over 30 yrs
- 0.0%
- Est. flood insurance / yr
- $473 – $860
Fire risk 1/10 · Minimal
- Est. fire insurance / yr
- $804 – $1,492
Heat risk 5/10 · Moderate
- Hot days now (above 106°F)
- 7 days/yr
- Hot days in 30 yrs
- 21 days/yr
Wind risk 2/10 · Minimal
- Chance of severe wind over 30 yrs
- 1.0%
Air-quality risk 2/10 · Minimal
- Unhealthy air days now
- 0 days/yr
- Unhealthy air days in 30 yrs
- 1 days/yr
Risk factors via First Street. Map © Google.
Why this score? — see what drove the D grade
The composite is a weighted blend of 9 inputs, each scored 0–100. Each bar is that input's sub-score; the figure is the points it added to the 100-point composite (weight × sub-score).
- Cash flow +20.1/30.0
- DSCR +6.4/10.0
- 1% rule +5.1/10.0
- Livability +2.9/5.0
- Rent growth +2.5/5.0
- Condition / age +2.5/5.0
- Schools +1.2/10.0
- ARV discount +0.0/15.0
- Appreciation +0.0/10.0
$79,900
🖨 Deal sheet 📄 Offer letter ✓ Due diligence
Listing remarks MLS
3-bedroom, 1-bath all-electric home, recently vacated and ready for its next owner! Previously used as a rental, this property offers a versatile storage area that could easily be reopened as a 1-car garage or transformed into additional living space, such as a master suite, home office, or hobby room. Comfortable living areas, functional layout, and the opportunity to customize or expand make this home perfect for buyers looking for move-in ready convenience with room to grow.
Key facts
- All electric home
- 6,969 sq ft lot
- Built 1960
Tags
Neighborhood map
What this means for you Summary
Snapshot
- This is a 3-bed/1.0-bath single-family listed at $80k.
Deal economics
- At list price, monthly cash flow is $99 ($1k/yr) — positive.
- The deal already cash-flows at list — no discount required.
- Meets the 1% rule at list price ($809 rent vs $80k).
- Recommended offer: $70k (12.0% below list) — sets the bar for market timing.
Location & tenants
- Location reads 58/100 on livability (#1,090 in IL) — a working-class tenant base; expect higher turnover. Strengths: cost of living A+, housing A+, crime B+; Watch: employment C-, schools F, amenities F.
- Sparta CUSD 140 (town): math 13% / reading 14% proficiency, ranked #535 of 620 in IL (top 86%) — low school quality limits family demand, transient renter base, plan for 1-2y turnover.
- Market conditions: 31 active listings in the ZIP; 3 units permitted in Randolph County in 2024 (0 in 5+ unit buildings).
Forward outlook
- Local home prices are declining (-3.0%/yr); year-one equity from $552 of loan paydown is wiped out by about $2k of value loss. Plan a longer hold.
- Randolph County population projected at -14% by 2050 — secular population decline; favor cash flow + early exit over multi-decade hold.
Negotiation context
- It's been on market 156 days — a 12% lower offer ($70k) is reasonable based on typical stale-listing flexibility.
Risks & watch-outs
- Climate carrying-cost: extreme-heat days projected 7→21/yr by 2055 (HVAC capex compounding) — expect insurance premiums to compound above CPI over the hold.
Questions for the listing agent
- It's been on market 156 days. Have you received any prior offers? Is the seller open to a 12% concession, seller financing, or rate buy-down credit?
- Built in 1960 — when were the roof, HVAC, electrical panel, plumbing, and water heater last replaced?
- Why hasn't it sold? Are there any deal-killer items the seller is aware of (foundation, flood, title, zoning, code violations)?
- Is there a deadline driving the sale (1031 exchange, divorce, estate, relocation)? That informs how much negotiation room exists.
- Schools are F-rated, which usually means shorter tenancies and higher turnover. Who's the typical renter profile here, and what's been the actual vacancy rate?
- The area grade is low — what's the realistic commute time and amenity access for the typical tenant pool here? Any planned neighborhood developments (good or bad) we should know about?
- What's the average days-on-market for RENTAL listings here right now (not sales)? A rising rental-DOM trend means longer vacancies and softer asking-rent achievability than the comps imply.
- What's the recent tenant-quality profile in this submarket — average credit score on applications, eviction rate, late-payment / NSF rate, and stable-employment percentage? A property-management company in the area should have these aggregated.
- How much new for-sale + rental construction is in the pipeline within 1–3 miles? Heavy new supply typically softens prices + rents 12–24 months out; constrained supply supports both.
Investment metrics
- 1% rule
- 1.01% ✓
- Cap rate
- 7.78%
- Cash-on-cash
- 5.30%
- DSCR
- 1.24
- GRM
- 8.2
CMA / ARV
- ARV (median comp)
- $59,427
- List price
- $79,900
- Delta
- 34.45%
- Verdict
- OVERPRICED
- Comps
- 20 within 1.0 mi
Show comp detail 12 sales within ~0.75 mi
| Address | Dist | Beds/Ba | Sqft | Sold | Price | $/sf | Match |
|---|---|---|---|---|---|---|---|
| 408 E Mound St | 0.02mi | 3/1.0 | 998 (+4%) | 3mo | $79,900 | $80 | 90 |
| 520 E Mound St | 0.11mi | 2/1.0 (-1) | 924 (-4%) | 6mo | $70,000 | $76 | 79 |
| 510 E Main St | 0.32mi | 2/1.0 (-1) | 1,000 (+4%) | 2mo | $48,000 | $48 | 72 |
| 305 N James St | 0.51mi | 3/1.0 | 884 (-8%) | 2mo | $117,500 | $133 | 62 |
| 109 S Washington St | 0.38mi | 2/1.0 (-1) | 1,072 (+12%) | 1mo | $14,000 | $13 | 57 |
| 206 S Dewey St | 0.45mi | 3/1.5 | 1,080 (+12%) | 2mo | $155,000 | $144 | 54 |
| 317 N Washington St | 0.18mi | 2/1.0 (-1) | 1,100 (+15%) | 10mo | $32,100 | $29 | 54 |
| 419 W Park Ave | 0.69mi | 2/1.0 (-1) | 950 (-1%) | 8mo | $76,000 | $80 | 54 |
| 1009 Meadow Dr | 0.66mi | 3/1.0 | 944 (-2%) | 20mo | $120,000 | $127 | 50 |
| 401 N James St | 0.50mi | 3/1.0 | 1,040 (+8%) | 16mo | $87,500 | $84 | 49 |
| 907 E Harrison St | 0.35mi | 2/2.0 (-1) | 840 (-12%) | 14mo | $47,500 | $57 | 42 |
| 331 S Market | 0.63mi | 3/1.0 | 1,104 (+15%) | 14mo | $60,000 | $54 | 34 |
Match score weights: distance 35% · size 25% · config 20% · recency 20%. Top-matched comps best support the ARV.
Projected returns pro-forma
-3.0% appreciation · 3.0% rent growth · sell at horizon
- IRR
- -8.1%
- Equity multiple
- 0.70×
- Total profit
- $-6,655
- Equity at exit
- $11,913
- IRR
- 1.5%
- Equity multiple
- 1.10×
- Total profit
- $2,321
- Equity at exit
- $6,908
Cash invested: $22,372 (down + closing). Projections, not guarantees.
Landlord ↔ Tenant lean methodology
- Overall (STATE)
- 43 Moderately Tenant-Leaning
- State Illinois
- 43 Moderately Tenant-Leaning · D+7
- County
- — inherits STATE
- City
- — inherits STATE
ZIP-level market 62286
- Home prices YoY
- -31.0%
- Active inventory
- 31
- Price-to-rent
- 8.2×
Monthly cashflow live
- Estimated rent
- $809 medium interval (Pro) →
- Mortgage (P&I)
- −$419
- Tax from tax record
- −$88 /mo · $1,053/yr
- Insurance
- −$33
- HOA
- −$0
- Vacancy / Maint / Mgmt
- −$170
- Net cashflow
- $99
Break-even live
UW: 25.0% down · 7.5% · 30yr · 1.5% tax · 5.0% vac · 8.0% maint · 8.0% mgmt
Financing live
Cash to close
- Down payment
- $19,975
- Closing costs
- $2,397
- Reserves months
- —
- Total cash needed
- —
Loan-product check · same deal, 3 products live
Conventional
25% down · 7.5% · 30yr
- Down + closing
- —
- Monthly P&I
- —
- Monthly cashflow
- —
- DSCR
- —
- Eligible?
- —
Personal DTI + credit; lowest rate.
DSCR
20% down · 8.5% · 30yr
- Down + closing
- —
- Monthly P&I
- —
- Monthly cashflow
- —
- DSCR
- —
- Eligible?
- —
No personal income docs; deal must DSCR.
Hard money
10% down · 12.0% · 12mo
- Down + closing
- —
- Monthly P&I
- —
- Monthly cashflow
- —
- DSCR
- —
- Eligible?
- —
Short-term bridge; refi at stabilization.
Listing history 16 events
-
2026-06-18days on market $79,900 Active 156 DOM
-
2026-06-17days on market $79,900 Active 155 DOM
-
2026-06-16days on market $79,900 Active 154 DOM
-
2026-06-15days on market $79,900 Active 153 DOM
-
2026-06-13days on market $79,900 Active 151 DOM
-
2026-06-12days on market $79,900 Active 150 DOM
-
2026-06-09days on market $79,900 Active 147 DOM
-
2026-06-08days on market $79,900 Active 146 DOM
-
2026-06-07days on market $79,900 Active 145 DOM
-
2026-06-07days on market $79,900 Active 144 DOM
-
2026-06-04days on market $79,900 Active 141 DOM
-
2026-06-02days on market $79,900 Active 140 DOM
-
2026-06-01days on market $79,900 Active 139 DOM
-
2026-05-31days on market $79,900 Active 138 DOM
-
2026-05-31days on market $79,900 Active 137 DOM
-
2026-01-13$79,900 Active 482-char remark
Show marketing remark (482 chars)
3-bedroom, 1-bath all-electric home, recently vacated and ready for its next owner! Previously used as a rental, this property offers a versatile storage area that could easily be reopened as a 1-car garage or transformed into additional living space, such as a master suite, home office, or hobby room. Comfortable living areas, functional layout, and the opportunity to customize or expand make this home perfect for buyers looking for move-in ready convenience with room to grow.
ⓘ Source: listings_history table (triggers on properties + properties_extension) + one-shot
backfill from property_details.listing_events for pre-trigger history.
Tax reassessment forecast IL · Partial reset (capped growth)
- Current annual tax
- $1,053 · $88/mo
- Projected year-2 tax
- $1,434 · $119/mo
- Expected delta
- +$380/yr (+$32/mo · 36.1%)
ⓘ Screening estimate from a state-policy table — verify with the county assessor before closing.
Climate risk First Street
- Flood 1/10 Low FEMA zone X (unshaded) · 0% chance over 30 yrs
- Wildfire 1/10 Low
- Heat 5/10 Major 7 d/yr ≥106°F today · 21 d/yr by 30 yrs out
- Wind 2/10 Low 100% chance of damaging wind over 30 yrs
- Air quality 2/10 Low 0 unhealthy d/yr today · 1 by 30 yrs out
Nearby sold comps map
Loading sold comps map…
Walkable amenities ~0.75 mi
Loading nearby amenities…
Taxation est. · year 1
- Rental income
- $9,703
- − Mortgage interest
- −$4,476
- − Property taxes
- −$1,053
- − Insurance
- −$400
- − Repairs & maintenance
- −$776
- − Management
- −$776
- − Depreciation
- −$2,324
- Taxable loss
- −$102
- Est. tax savings @ 24.0%
- +$25
- After-tax cash flow
- $1,209/yr
For passive investors: Depreciation is non-cash, so a rental often shows a tax loss while cash-flowing — sheltering income. Rental losses are passive: they offset passive income freely, and up to $25,000/yr can offset ordinary (W-2) income if you actively participate and your MAGI is under $100k (phasing out to $0 by $150k); unused losses carry forward. On sale, claimed depreciation is recaptured at up to 25%, and gains may owe capital-gains tax (a 1031 exchange can defer both). Figures are a year-1 estimate at your 24.0% rate — not tax advice; consult a CPA.
Schools (NCES district)
- District
- Sparta CUSD 140
- NCES district ID
- 1736900
- Math proficiency
- 13% ▼ -10.00%
- Reading proficiency
- 14% ▼ -13.00%
- Median HH income
- $43,992
- Composite
- 11.95/100
- National rank
- #9668
- State rank
- #535 of 620 in IL
Livability — Sparta
- Score
- 58/100
- State rank
- #1090
- US rank
- #20732
Category grades
Schools grade is shown separately in the Schools card above.
Census & demographics
- Census place
- Sparta, IL
- City population
- 5,482
- Population (ZIP)
- 5,482
Population outlook (Randolph County) Hauer SSP2
- Today (2025)
- 31,417 people
- By 2030
- 30,519 · -2.9%
- By 2040
- 28,841 · -8.2%
- By 2050
- 27,150 · -13.6%
- By 2075
- 22,569 · -28.2%
- By 2100
- 16,584 · -47.2%
Race, ethnicity, and origin ACS 2023
- Neighborhood character
- Predominantly White (82%)
- Race & ethnicity
- White 82% Black 10% Two or more races 7% Hispanic / Latino 3%
- Common ancestry
- Serbian 9% Lithuanian 2% Slovak 2%
- Languages at home
- 99% English-only · French/Haitian/Cajun 1%
Political lean MEDSL · Randolph
- 2024 margin
- Solid R (+50.0) · D 24.1% · R 74.1% · Other 1.7%
- 2008→2024 swing
- -49.0pp toward R · 2008: -0.9pp · 2024: -50.0pp
- All cycles
- 2024: R+50.0 2020: R+50.2 2016: R+46.8 2012: R+17.6 2008: R+0.9
Not yet ingested
- Civics
- —
Market trends
- HPI YoY
- ▼ -52.47%
- Current HPI
- 116.6798
- Rent YoY
- —
- Metro
- —
- State GDP YoY
- ▲ 1.59%
- F500 in state
- 60
Industry mix (Fortune 500 HQ in IL)
| Industry | F500 HQs | Revenue |
|---|---|---|
| Insurance | 4 | $201B |
|
||
| Consumer Goods | 4 | $87B |
|
||
| Industrial Machinery | 3 | $64B |
|
||
| Healthcare | 2 | $55B |
|
||
| Retail / Pharmacy | 1 | $148B |
|
||
| Agriculture / Food | 1 | $86B |
|
||
Price history
1 event — show timeline
- 2026-01-13 Listed $79,900 MARIS as Distributed by MLS Grid
Property tax history
+17.5%/yrLatest (2024): $1,053 · +1.4% YoY. Source: county tax records.
Cash-flow waterfall
monthlySold comps — $/sqft
last 12 mo · ≤1 miLoading sold comps…