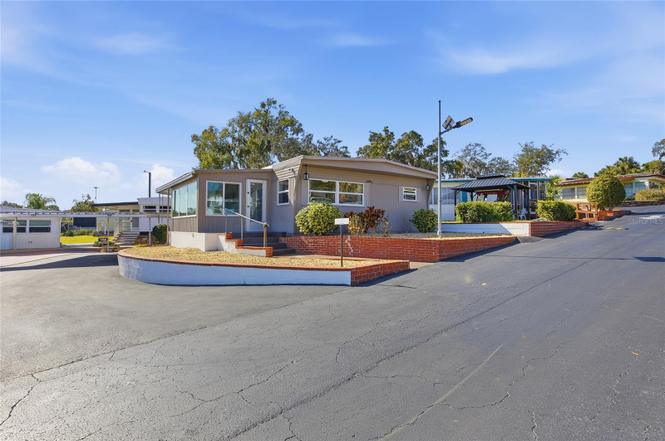
3896 Picciola Rd #224 · Fruitland Park, FL
Flood risk 6/10 · Moderate
- FEMA flood zone
- X (unshaded)
- Chance of flooding over 30 yrs
- 0.74%
- Est. flood insurance / yr
- $507 – $1,088
Fire risk 4/10 · Minor
- Est. fire insurance / yr
- $947 – $1,759
Heat risk 8/10 · Major
- Hot days now (above 107°F)
- 7 days/yr
- Hot days in 30 yrs
- 22 days/yr
Wind risk 10/10 · Severe
- Chance of severe wind over 30 yrs
- 99.0%
Air-quality risk 2/10 · Minimal
- Unhealthy air days now
- 1 days/yr
- Unhealthy air days in 30 yrs
- 1 days/yr
Risk factors via First Street. Map © Google.
Why this score? — see what drove the C- grade
The composite is a weighted blend of 9 inputs, each scored 0–100. Each bar is that input's sub-score; the figure is the points it added to the 100-point composite (weight × sub-score).
- Cash flow +20.5/30.0
- ARV discount +7.5/15.0
- 1% rule +7.3/10.0
- DSCR +6.5/10.0
- Schools +4.2/10.0
- Livability +3.5/5.0
- Rent growth +2.5/5.0
- Condition / age +2.5/5.0
- Appreciation +0.0/10.0
$119,000
🖨 Deal sheet 📄 Offer letter ✓ Due diligence
Listing remarks
Wake up to views of LAKE GRIFFIN in this charming FURNISHED 2-bedroom, 1.5-bath home located in a sought-after 55+ community, Griffin Co-Op, in Fruitland Park, Florida. Perfectly positioned to capture peaceful water scenery, this home offers a bright, functional layout designed for comfortable Florida living. Enjoy your morning coffee while overlooking the lake, or unwind in the evenings with tranquil sunsets right outside your door. The community provides a relaxed, low-maintenance lifestyle, ideal for full-time residents or seasonal homeowners looking to escape the cold. This home is perfectly positioned for those who love the water, relaxation, and active Florida living. A standout featu
Key facts
- Shuffleboard courts
- Walk in storage room
- Community clubhouse
Tags
Property features AI
Finance
- Other: Furnished; Near marina with lake view and lake access (Lake Griffin, chain of lakes); assigned boat slip, boathouse, fishing pier, covered lift; private lake dues required; Lot features: Near marina, one-way street, paved; Road surface: Asphalt/paved on public maintained road; Total acreage: Less than 1/4 acre
- Financial info: Total monthly fees $181; total annual fees $2,172
- HOA & community: HOA required (monthly fee $181); Association amenities: Cable TV, Clubhouse, Maintenance, Recreation facilities, Shuffleboard court; Association fee includes common area taxes, pool, escrow reserves, structure and grounds maintenance, management, private road, recreational facilities, sewer, trash and water; Community features: Clubhouse, Community mailbox, Deed restrictions, Golf carts allowed, Pool, Special community restrictions; Senior community; Pets allowed with number limit
Exterior
- Parking: Boat parking; Common parking; Covered parking; Golf cart parking; Guest parking; Carport (1 space)
- Utilities: Public water; Private sewer; Cable connected; Electricity connected; Natural gas connected; Water connected
- Home design: Mobile home (double wide); One story; North facing
- Construction: Metal siding; Membrane roof; Pillar/post/pier foundation; Built as double wide
- Exterior features: Covered, enclosed and rear/side porches; Porch; Storage; Boat house; Gazebo; Other exterior structures
Interior
- Kitchen: Range; Range hood; Microwave; Refrigerator
- Bedrooms: 2 bedrooms
- Flooring: Carpet; Laminate
- Bathrooms: 1 full bath; 1 half bath
- Heating & cooling: Central heating (natural gas); Central air conditioning
- Interior features: Built-in features; Ceiling fans; Eat-in kitchen; Thermostat; Bonus room; Florida room; Storage rooms
- Laundry & utility: Washer; Dryer; Laundry inside
Neighborhood map
What this means for you Summary
Snapshot
- This is a 2-bed/1.5-bath condo listed at $119k.
Deal economics
- At list price, monthly cash flow is $156 ($2k/yr) — positive.
- The deal already cash-flows at list — no discount required.
- Meets the 1% rule at list price ($1k rent vs $119k).
- Recommended offer: $105k (12.0% below list) — sets the bar for market timing.
- Cap rate 7.9% vs local median 4.0% in Fruitland Park — top-decile yield for the area; either an underpriced asset or a hidden risk that comps aren't pricing in. Stress-test before assuming the spread holds.
Location & tenants
- Location reads 70/100 on livability (#447 in FL) — a middle-class / working-renter tenant base. Strengths: housing A+, crime A, health & safety A-; Watch: schools D, amenities F, commute F.
- Lake (suburban): math 49% / reading 50% proficiency, ranked #37 of 73 in FL (top 51%) — families likely to look elsewhere, expect single-tenant / working-renter base with shorter leases.
- Market conditions: 165 active listings in the ZIP; 6 comparable units currently listed for rent nearby; rentals at typical pace (median 24d on market — plan ~3-4 weeks tenant-placement turnaround); 4,799 units permitted in Lake County in 2024 (814 in 5+ unit buildings).
Forward outlook
- Local home prices are declining (-3.0%/yr); year-one equity from $823 of loan paydown is wiped out by about $4k of value loss. Plan a longer hold.
- Lake County population projected at +37% by 2050 — long-run rental-demand tailwind backs the buy-and-hold thesis.
Negotiation context
- It's been on market 138 days — a 12% lower offer ($105k) is reasonable based on typical stale-listing flexibility.
- 2 sale attempts since 21y ago; this cycle's ask has dropped $23k (16%) from the opening price — seller is motivated, your offer sets the floor, not the list.
Risks & watch-outs
- Climate carrying-cost: major flood risk; severe wind risk, 99% chance of damaging wind over 30y; extreme-heat days projected 7→22/yr by 2055 (HVAC capex compounding) — expect insurance premiums to compound above CPI over the hold.
Questions for the listing agent
- It's been on market 138 days. Have you received any prior offers? Is the seller open to a 12% concession, seller financing, or rate buy-down credit?
- Built in 1968 — when were the roof, HVAC, electrical panel, plumbing, and water heater last replaced?
- What does the HOA fee cover, when was the last increase, and are there any pending special assessments or reserve-fund shortfalls?
- Any open or pending special assessments — roof, HVAC, plumbing, elevator, façade? What's the per-unit balance and payoff schedule, and is the seller paying it off at close or rolling it to the buyer?
- Why hasn't it sold? Are there any deal-killer items the seller is aware of (foundation, flood, title, zoning, code violations)?
- Is there a deadline driving the sale (1031 exchange, divorce, estate, relocation)? That informs how much negotiation room exists.
- Schools are D-rated, which usually means shorter tenancies and higher turnover. Who's the typical renter profile here, and what's been the actual vacancy rate?
- What's the average days-on-market for RENTAL listings here right now (not sales)? A rising rental-DOM trend means longer vacancies and softer asking-rent achievability than the comps imply.
- What's the recent tenant-quality profile in this submarket — average credit score on applications, eviction rate, late-payment / NSF rate, and stable-employment percentage? A property-management company in the area should have these aggregated.
- How much new apartment / multifamily construction is in the pipeline within 1–3 miles? Heavy new supply (>2% of stock underway) typically softens rents 12–24 months out; light construction supports rent growth.
Investment metrics
- 1% rule
- 1.23% ✓
- Cap rate
- 7.87%
- Cash-on-cash
- 5.63%
- DSCR
- 1.25
- GRM
- 6.8
CMA / ARV
No comps found within radius.
Projected returns pro-forma
-3.0% appreciation · 3.0% rent growth · sell at horizon
- IRR
- -7.5%
- Equity multiple
- 0.72×
- Total profit
- $-9,202
- Equity at exit
- $17,743
- IRR
- 2.2%
- Equity multiple
- 1.16×
- Total profit
- $5,338
- Equity at exit
- $10,289
Cash invested: $33,320 (down + closing). Projections, not guarantees.
Landlord ↔ Tenant lean methodology
- Overall (STATE)
- 87 Strongly Landlord-Friendly
- State Florida
- 87 Strongly Landlord-Friendly · R+3
- County
- — inherits STATE
- City
- — inherits STATE
ZIP-level market 34731
- Home prices YoY
- -10.1%
- Active inventory
- 165
- Price-to-rent
- 6.8×
Monthly cashflow live
- Estimated rent
- $1,468 high interval (Pro) →
- Mortgage (P&I)
- −$624
- Tax est. 1.5%
- −$149 /mo · $1,785/yr
- Insurance
- −$50
- HOA
- −$181
- Vacancy / Maint / Mgmt
- −$308
- Net cashflow
- $156
Break-even live
UW: 25.0% down · 7.5% · 30yr · 1.5% tax · 5.0% vac · 8.0% maint · 8.0% mgmt
Financing live
Cash to close
- Down payment
- $29,750
- Closing costs
- $3,570
- Reserves months
- —
- Total cash needed
- —
Loan-product check · same deal, 3 products live
Conventional
25% down · 7.5% · 30yr
- Down + closing
- —
- Monthly P&I
- —
- Monthly cashflow
- —
- DSCR
- —
- Eligible?
- —
Personal DTI + credit; lowest rate.
DSCR
20% down · 8.5% · 30yr
- Down + closing
- —
- Monthly P&I
- —
- Monthly cashflow
- —
- DSCR
- —
- Eligible?
- —
No personal income docs; deal must DSCR.
Hard money
10% down · 12.0% · 12mo
- Down + closing
- —
- Monthly P&I
- —
- Monthly cashflow
- —
- DSCR
- —
- Eligible?
- —
Short-term bridge; refi at stabilization.
Rent comps 6 comps
| Address | Beds | Baths | Sqft | Rent | $/sqft | DOM | Units | Dist |
|---|---|---|---|---|---|---|---|---|
| 1414 N Lake View Ave Leesburg, FL | 4.0 | 1.0–3.0 | 1700 | $1,440 | $0.85 | 2d | 3 | 0.37mi |
| 2117 Citrus Blvd Unit 6 Leesburg, FL | 2.0 | 1.0 | 800 | $1,000 | $1.25 | 1d | 1 | 0.71mi |
| 2511 Sennett Dr Leesburg, FL | 2.0–4.0 | 2.0 | 1215 | $1,508 | $1.24 | 23d | 1 | 0.83mi |
| 2400 Silver Pointe Cir Leesburg, FL | 1.0–2.0 | 1.0 | 837 | $1,050 | $1.25 | 23d | 1 | 0.90mi |
| 1 Herald Dr Leesburg, FL | 2.0 | 1.0–1.5 | 970 | $1,524 | $1.57 | 4d | 4 | 1.43mi |
| 1223 Pamela St Leesburg, FL | 2.0 | 1.0 | 894 | $1,399 | $1.56 | 23d | 1 | 1.49mi |
HOA detail condo
- Monthly dues
- $181 · $2,172/yr
- Likely covers
- water
- Assessments
- None detected in remarks — confirm with the listing agent.
Listing history 18 events
-
2026-06-18days on market $119,000 Active 138 DOM
-
2026-06-17days on market $119,000 Active 137 DOM
-
2026-06-16days on market $119,000 Active 136 DOM
-
2026-06-15days on market $119,000 Active 135 DOM
-
2026-06-13days on market $119,000 Active 133 DOM
-
2026-06-09days on market $119,000 Active 129 DOM
-
2026-06-08days on market $119,000 Active 128 DOM
-
2026-06-07days on market $119,000 Active 127 DOM
-
2026-06-04days on market $119,000 Active 124 DOM
-
2026-06-03days on market $119,000 Active 123 DOM
-
2026-06-02days on market $119,000 Active 122 DOM
-
2026-06-02days on market $119,000 Active 121 DOM
-
2026-05-31days on market $119,000 Active 120 DOM
-
2026-03-25price $119,000
-
2026-03-11price $129,000
-
2026-02-17price $134,000
-
2026-02-01$142,000 Active
-
2005-02-18$39,900
ⓘ Source: listings_history table (triggers on properties + properties_extension) + one-shot
backfill from property_details.listing_events for pre-trigger history.
Climate risk First Street
- Flood 6/10 Major FEMA zone X (unshaded) · 74% chance over 30 yrs
- Wildfire 4/10 Moderate
- Heat 8/10 Severe 7 d/yr ≥107°F today · 22 d/yr by 30 yrs out
- Wind 10/10 Extreme 99% chance of damaging wind over 30 yrs
- Air quality 2/10 Low 1 unhealthy d/yr today · 1 by 30 yrs out
Nearby sold comps map
Loading sold comps map…
Walkable amenities ~0.75 mi
Loading nearby amenities…
Taxation est. · year 1
- Rental income
- $17,614
- − Mortgage interest
- −$6,666
- − Property taxes
- −$1,785
- − Insurance
- −$595
- − Repairs & maintenance
- −$1,409
- − Management
- −$1,409
- − HOA
- −$2,172
- − Depreciation
- −$3,462
- Taxable income
- $116
- Est. tax owed @ 24.0%
- −$28
- After-tax cash flow
- $1,846/yr
For passive investors: Depreciation is non-cash, so a rental often shows a tax loss while cash-flowing — sheltering income. Rental losses are passive: they offset passive income freely, and up to $25,000/yr can offset ordinary (W-2) income if you actively participate and your MAGI is under $100k (phasing out to $0 by $150k); unused losses carry forward. On sale, claimed depreciation is recaptured at up to 25%, and gains may owe capital-gains tax (a 1031 exchange can defer both). Figures are a year-1 estimate at your 24.0% rate — not tax advice; consult a CPA.
Schools (NCES district)
- District
- Lake
- NCES district ID
- 1201050
- Math proficiency
- 49% ▼ -7.00%
- Reading proficiency
- 50% ▼ -4.00%
- Median HH income
- $46,632
- Composite
- 42.05/100
- National rank
- #3327
- State rank
- #37 of 73 in FL
Livability — Fruitland Park
- Score
- 70/100
- State rank
- #447
- US rank
- #8098
Category grades
Schools grade is shown separately in the Schools card above.
Census & demographics
- County
- Lake County · 364,602 people
- City population
- 12,196
- Metro
- Orlando-Kissimmee-Sanford, FL
- Population (ZIP)
- 12,196
- Household income
- $66,300
- Rent vs Own
- Severe rent burden
- 269.0
Population outlook (Lake County) Hauer SSP2
- Today (2025)
- 386,640 people
- By 2030
- 417,107 · +7.9%
- By 2040
- 476,676 · +23.3%
- By 2050
- 531,296 · +37.4%
- By 2075
- 648,303 · +67.7%
- By 2100
- 698,530 · +80.7%
Race, ethnicity, and origin ACS 2023
- Neighborhood character
- Predominantly White (76%)
- Race & ethnicity
- White 76% Black 11% Two or more races 11% Hispanic / Latino 3%
- Common ancestry
- Romanian 3% Serbian 2% Iranian 2%
- Foreign-born
- 5% · Canada
- Languages at home
- 98% English-only · Spanish 1% German/W. Germanic 1%
Political lean MEDSL · Lake
- 2024 margin
- Strong R (+24.7) · D 37.3% · R 62.0%
- 2008→2024 swing
- -11.2pp toward R · 2008: -13.5pp · 2024: -24.7pp
- All cycles
- 2024: R+24.7 2020: R+20.0 2016: R+23.1 2012: R+17.1 2008: R+13.5
Not yet ingested
- Civics
- —
Market trends
- HPI YoY
- ▼ -35.91%
- Current HPI
- 318.8206
- Rent YoY
- —
- Metro
- Orlando-Kissimmee-Sanford, FL
- State GDP YoY
- ▲ 3.28%
- F500 in state
- 36
Industry mix (Fortune 500 HQ in FL)
| Industry | F500 HQs | Revenue |
|---|---|---|
| Industrial Technology | 2 | $29B |
|
||
| Insurance | 2 | $17B |
|
||
| Retail | 1 | $60B |
|
||
| Technology Distribution | 1 | $58B |
|
||
| Homebuilding | 1 | $35B |
|
||
| Technology Manufacturing | 1 | $35B |
|
||
Price history
+198.2% since first listed5 events — show timeline
- 2026-03-25 Price Changed $119,000 Stellar MLS as Distributed by MLS Grid
- 2026-03-11 Price Changed $129,000 Stellar MLS as Distributed by MLS Grid
- 2026-02-17 Price Changed $134,000 Stellar MLS as Distributed by MLS Grid
- 2026-02-01 Listed $142,000 Stellar MLS as Distributed by MLS Grid
- 2005-02-18 Listed $39,900 Stellar MLS as Distributed by MLS Grid
Cash-flow waterfall
monthlySold comps — $/sqft
last 12 mo · ≤1 miLoading sold comps…