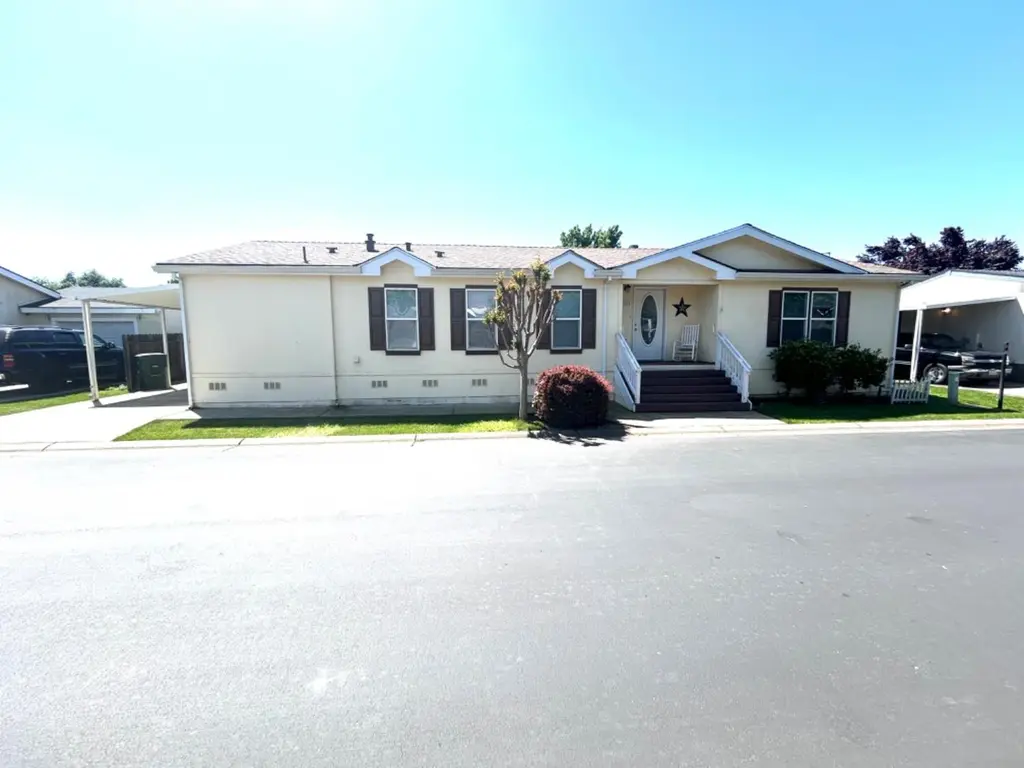
1400 W Marlette St #21 · Ione, CA
Flood risk No data
- FEMA flood zone
- —
- Chance of flooding over 30 yrs
- —
- Est. flood insurance / yr
- —
Fire risk No data
- Est. fire insurance / yr
- —
Heat risk No data
- Hot days now (above threshold)
- —
- Hot days in 30 yrs
- —
Wind risk No data
- Chance of severe wind over 30 yrs
- —
Air-quality risk No data
- Unhealthy air days now
- —
- Unhealthy air days in 30 yrs
- —
Risk factors via First Street. Map © Google.
Why this score? — see what drove the C+ grade
The composite is a weighted blend of 9 inputs, each scored 0–100. Each bar is that input's sub-score; the figure is the points it added to the 100-point composite (weight × sub-score).
- Cash flow +30.0/30.0
- DSCR +10.0/10.0
- 1% rule +8.8/10.0
- Livability +3.1/5.0
- ARV discount +2.7/15.0
- Schools +2.7/10.0
- Rent growth +2.5/5.0
- Condition / age +2.5/5.0
- Appreciation +0.0/10.0
$190,000
🖨 Deal sheet (PDF) 📄 Offer letter ✓ Due diligence
Listing remarks
Welcome to Castle Village Mobile Home Park!! 3 bedroom, 2 bath with large bedrooms and walk in closets. Beautiful vaulted ceiling, warm inviting open concept living room, kitchen and dining room. And solar! Perfect for entertaining! This park has so much to offer. The clubhouse is available for your events but they also put on Bingo, Bunco, Card/game nights, music, sewing, chair exercise, the list goes on! You also get use of the pool and basketball court. Outside the community it's close to shopping, fishing, food, Casinos.
Key facts
- Clubhouse
- Vaulted ceiling
- Basketball court
Tags
Neighborhood map
What this means for you Summary
Snapshot
- This is a 3-bed/2.0-bath manufactured listed at $190k.
Deal economics
- At list price, monthly cash flow is $928 ($11k/yr) — positive.
- The deal already cash-flows at list — no discount required.
- Meets the 1% rule at list price ($3k rent vs $190k).
- Recommended offer: $179k (6.0% below list) — sets the bar for market timing.
- Cap rate 12.2% vs local median 3.3% in Ione — top-decile yield for the area; either an underpriced asset or a hidden risk that comps aren't pricing in. Stress-test before assuming the spread holds.
Location & tenants
- Location reads 62/100 on livability (#490 in CA) — a middle-class / working-renter tenant base. Strengths: housing A+, employment A-, crime B+; Watch: schools F, amenities F, commute F.
- Amador County Unified (town): math 23% / reading 37% proficiency, ranked #330 of 517 in CA (top 64%) — families likely to look elsewhere, expect single-tenant / working-renter base with shorter leases.
- Market conditions: 120 active listings in the ZIP; 3 comparable units currently listed for rent nearby; rentals leasing fast (median 5d on market — plan ~1-2 weeks tenant-placement turnaround); 66 units permitted in Amador County in 2024 (0 in 5+ unit buildings).
Forward outlook
- Local home prices are declining (-3.0%/yr); year-one equity from $1k of loan paydown is wiped out by about $6k of value loss. Plan a longer hold.
- Amador County population projected at -15% by 2050 — secular population decline; favor cash flow + early exit over multi-decade hold.
- At projected returns (-3.0% appreciation + 3.0% rent growth), your $53k cash investment doubles in ~6 years — after that, you're playing with house money.
Negotiation context
- It's been on market 62 days — a 6% lower offer ($179k) is reasonable based on typical stale-listing flexibility.
Questions for the listing agent
- It's been on market 62 days. Have you received any prior offers? Is the seller open to a 6% concession, seller financing, or rate buy-down credit?
- Why hasn't it sold? Are there any deal-killer items the seller is aware of (foundation, flood, title, zoning, code violations)?
- Is there a deadline driving the sale (1031 exchange, divorce, estate, relocation)? That informs how much negotiation room exists.
- Schools are F-rated, which usually means shorter tenancies and higher turnover. Who's the typical renter profile here, and what's been the actual vacancy rate?
- What's the average days-on-market for RENTAL listings here right now (not sales)? A rising rental-DOM trend means longer vacancies and softer asking-rent achievability than the comps imply.
- What's the recent tenant-quality profile in this submarket — average credit score on applications, eviction rate, late-payment / NSF rate, and stable-employment percentage? A property-management company in the area should have these aggregated.
- How much new for-sale + rental construction is in the pipeline within 1–3 miles? Heavy new supply typically softens prices + rents 12–24 months out; constrained supply supports both.
Investment metrics
- 1% rule
- 1.38% ✓
- Cap rate
- 12.16%
- Cash-on-cash
- 20.94%
- DSCR
- 1.93
- GRM
- 6.0
CMA / ARV
- ARV (median comp)
- $171,631
- List price
- $190,000
- Delta
- 10.70%
- Verdict
- OVERPRICED
- Comps
- 6 within 1.0 mi
Show comp detail 2 sales within ~0.75 mi
| Address | Dist | Beds/Ba | Sqft | Sold | Price | $/sf | Match |
|---|---|---|---|---|---|---|---|
| 1400 W Marlette St #1 | 0.00mi | 3/2.0 | 2,400 (0%) | 5mo | $217,000 | $90 | 96 |
| 1400 W Marlette St #10 | 0.00mi | 3/2.0 | 2,080 (-13%) | 12mo | $225,000 | $108 | 68 |
Match score weights: distance 35% · size 25% · config 20% · recency 20%. Top-matched comps best support the ARV.
Projected returns pro-forma
-3.0% appreciation · 3.0% rent growth · sell at horizon
- IRR
- 13.3%
- Equity multiple
- 1.53×
- Total profit
- $28,273
- Equity at exit
- $28,330
- IRR
- 22.2%
- Equity multiple
- 2.89×
- Total profit
- $100,483
- Equity at exit
- $16,428
Cash invested: $53,200 (down + closing). Projections, not guarantees.
Landlord ↔ Tenant lean methodology
- Overall (STATE)
- 18 Strongly Tenant-Friendly
- State California
- 18 Strongly Tenant-Friendly · D+13
- County
- — inherits STATE
- City
- — inherits STATE
ZIP-level market 95640
- Active inventory
- 120
- Price-to-rent
- 6.0×
Monthly cashflow live
- Estimated rent
- $2,617 medium interval (Pro) →
- Mortgage (P&I)
- −$996
- Tax from tax record
- −$64 /mo · $764/yr
- Insurance
- −$79
- HOA
- −$0
- Vacancy / Maint / Mgmt
- −$550
- Net cashflow
- $928
Break-even live
Sensitivity live
| Price | -10% $1,036 | -5% $982 | +0% $928 | +5% $875 | +10% $821 |
|---|---|---|---|---|---|
| Rent | -10% $722 | -5% $825 | +0% $928 | +5% $1,032 | +10% $1,135 |
| Rate | -1.0pp $1,024 | -0.5pp $977 | base $928 | +0.5pp $879 | +1.0pp $829 |
UW: 25.0% down · 7.5% · 30yr · 1.5% tax · 5.0% vac · 8.0% maint · 8.0% mgmt
Financing live
Cash to close
- Down payment
- $47,500
- Closing costs
- $5,700
- Reserves months
- —
- Total cash needed
- —
Loan-product check · same deal, 3 products live
Conventional
25% down · 7.5% · 30yr
- Down + closing
- —
- Monthly P&I
- —
- Monthly cashflow
- —
- DSCR
- —
- Eligible?
- —
Personal DTI + credit; lowest rate.
DSCR
20% down · 8.5% · 30yr
- Down + closing
- —
- Monthly P&I
- —
- Monthly cashflow
- —
- DSCR
- —
- Eligible?
- —
No personal income docs; deal must DSCR.
Hard money
10% down · 12.0% · 12mo
- Down + closing
- —
- Monthly P&I
- —
- Monthly cashflow
- —
- DSCR
- —
- Eligible?
- —
Short-term bridge; refi at stabilization.
Rent comps 3 comps
| Address | Beds | Baths | Sqft | Rent | $/sqft | DOM | Units | Dist |
|---|---|---|---|---|---|---|---|---|
| 303 Pelican Hill Ct Ione, CA | 4.0 | 2.0 | 1877 | $2,600 | $1.39 | 45d | 1 | 0.40mi |
| 107 Ashworth Dr Ione, CA | 3.0 | 2.0 | 1671 | $2,495 | $1.49 | 4d | 1 | 0.46mi |
| 664 Morning Glory Cir Ione, CA | 4.0 | 2.5 | 2018 | $2,975 | $1.47 | 4d | 1 | 1.38mi |
Listing history 15 events
-
2026-06-21days on market $190,000 Active 62 DOM
-
2026-06-18days on market $190,000 Active 59 DOM
-
2026-06-17days on market $190,000 Active 58 DOM
-
2026-06-16days on market $190,000 Active 57 DOM
-
2026-06-15days on market $190,000 Active 56 DOM
-
2026-06-13days on market $190,000 Active 54 DOM
-
2026-06-13pricedays on market $190,000 Active 53 DOM
-
2026-06-09days on market $195,000 Active 50 DOM
-
2026-06-08days on market $195,000 Active 49 DOM
-
2026-06-07days on market $195,000 Active 48 DOM
-
2026-06-05days on market $195,000 Active 45 DOM
-
2026-06-03days on market $195,000 Active 44 DOM
-
2026-06-02days on market $195,000 Active 43 DOM
-
2026-06-01days on market $195,000 Active 42 DOM
-
2026-05-31days on market $195,000 Active 41 DOM
ⓘ Source: listings_history table (triggers on properties + properties_extension) + one-shot
backfill from property_details.listing_events for pre-trigger history.
Tax reassessment forecast CA · Resets to sale price
- Current annual tax
- $764 · $64/mo
- Projected year-2 tax
- $1,444 · $120/mo
- Expected delta
- +$680/yr (+$57/mo · 88.9%)
ⓘ Screening estimate from a state-policy table — verify with the county assessor before closing.
Nearby sold comps map
Loading sold comps map…
Walkable amenities ~0.75 mi
Loading nearby amenities…
Taxation est. · year 1
- Rental income
- $31,407
- − Mortgage interest
- −$10,643
- − Property taxes
- −$764
- − Insurance
- −$950
- − Repairs & maintenance
- −$2,513
- − Management
- −$2,513
- − Depreciation
- −$5,527
- Taxable income
- $8,497
- Est. tax owed @ 24.0%
- −$2,039
- After-tax cash flow
- $9,101/yr
For passive investors: Depreciation is non-cash, so a rental often shows a tax loss while cash-flowing — sheltering income. Rental losses are passive: they offset passive income freely, and up to $25,000/yr can offset ordinary (W-2) income if you actively participate and your MAGI is under $100k (phasing out to $0 by $150k); unused losses carry forward. On sale, claimed depreciation is recaptured at up to 25%, and gains may owe capital-gains tax (a 1031 exchange can defer both). Figures are a year-1 estimate at your 24.0% rate — not tax advice; consult a CPA.
Schools (NCES district)
- District
- Amador County Unified
- NCES district ID
- 0602450
- Math proficiency
- 23% ▼ -9.00%
- Reading proficiency
- 37% ▼ -10.00%
- Median HH income
- $55,428
- Composite
- 26.67/100
- National rank
- #7163
- State rank
- #330 of 517 in CA
Livability — Ione
- Score
- 62/100
- State rank
- #490
- US rank
- #16616
Category grades
Schools grade is shown separately in the Schools card above.
Census & demographics
- Census place
- Ione, CA
- City population
- 12,811
- Population (ZIP)
- 12,811
Population outlook (Amador County) Hauer SSP2
- Today (2025)
- 35,295 people
- By 2030
- 34,147 · -3.3%
- By 2040
- 31,618 · -10.4%
- By 2050
- 29,913 · -15.2%
- By 2075
- 27,308 · -22.6%
- By 2100
- 23,465 · -33.5%
Race, ethnicity, and origin ACS 2023
- Neighborhood character
- Majority White (64%)
- Race & ethnicity
- White 64% Hispanic / Latino 21% Two or more races 17% Black 4% Native American 2%
- Hispanic origin (detail)
- Mexican 14%
- Common ancestry
- Italian 3% Slovak 3% Romanian 2%
- Foreign-born
- 7% · Canada
- Languages at home
- 85% English-only · Spanish 11% Arabic 2%
Political lean MEDSL · Amador
- 2024 margin
- Strong R (+27.8) · D 34.7% · R 62.6% · Other 2.7%
- 2008→2024 swing
- -13.2pp toward R · 2008: -14.6pp · 2024: -27.8pp
- All cycles
- 2024: R+27.8 2020: R+24.4 2016: R+25.2 2012: R+19.0 2008: R+14.6
Not yet ingested
- Civics
- —
Market trends
- HPI YoY
- ▼ -144.63%
- Current HPI
- 169.9705
- Rent YoY
- —
- Metro
- —
- State GDP YoY
- ▲ 3.21%
- F500 in state
- 116
Industry mix (Fortune 500 HQ in CA)
| Industry | F500 HQs | Revenue |
|---|---|---|
| Technology | 27 | $1,492B |
|
||
| Financial Services | 3 | $174B |
|
||
| Retail | 3 | $44B |
|
||
| Insurance | 3 | $26B |
|
||
| Media / Entertainment | 2 | $115B |
|
||
| Pharmaceuticals / Biotech | 2 | $62B |
|
||
Property tax history
-1.0%/yrLatest (2025): $764 · +15.7% YoY. Source: county tax records.
Cash-flow waterfall
monthlySold comps — $/sqft
last 12 mo · ≤1 miLoading sold comps…