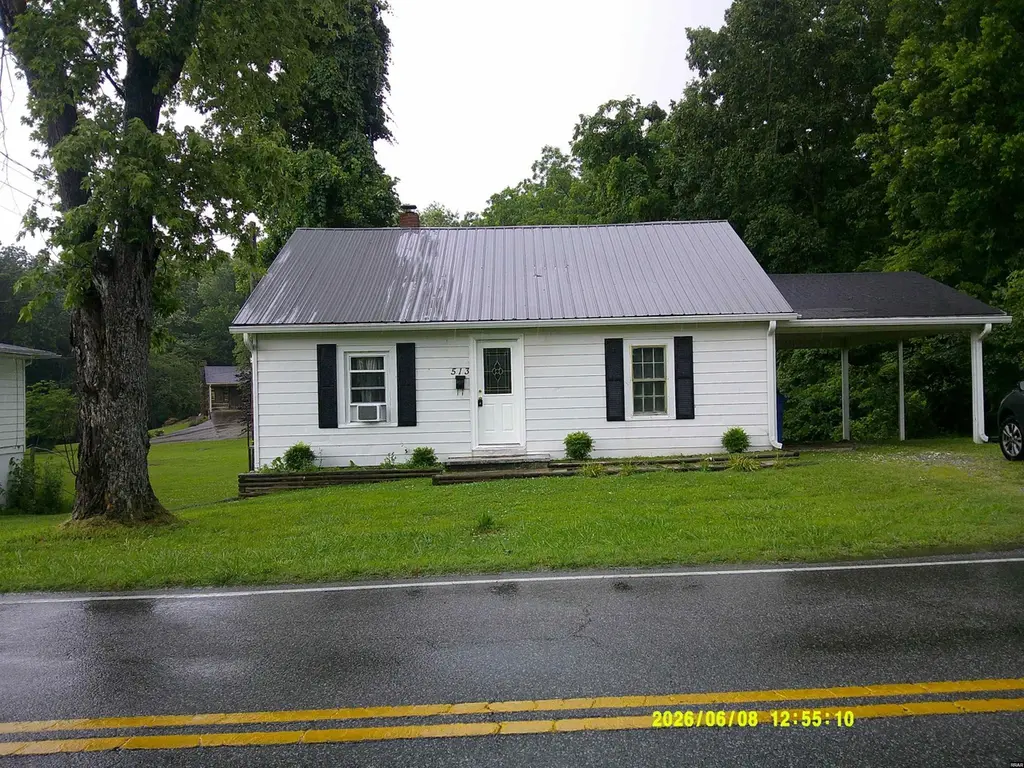
513 Mayfield Rd · Clinton, KY
Flood risk 1/10 · Minimal
- FEMA flood zone
- X (unshaded)
- Chance of flooding over 30 yrs
- 0.0%
- Est. flood insurance / yr
- $473 – $860
Fire risk 1/10 · Minimal
- Est. fire insurance / yr
- $839 – $1,559
Heat risk 5/10 · Moderate
- Hot days now (above 108°F)
- 7 days/yr
- Hot days in 30 yrs
- 21 days/yr
Wind risk 4/10 · Minor
- Chance of severe wind over 30 yrs
- 8.0%
Air-quality risk 1/10 · Minimal
- Unhealthy air days now
- 0 days/yr
- Unhealthy air days in 30 yrs
- 0 days/yr
Risk factors via First Street. Map © Google.
Why this score? — see what drove the C+ grade
The composite is a weighted blend of 9 inputs, each scored 0–100. Each bar is that input's sub-score; the figure is the points it added to the 100-point composite (weight × sub-score).
- Cash flow +25.7/30.0
- ARV discount +9.8/15.0
- DSCR +8.6/10.0
- 1% rule +5.6/10.0
- Schools +3.7/10.0
- Appreciation +3.3/10.0
- Livability +3.1/5.0
- Rent growth +2.5/5.0
- Condition / age +2.5/5.0
$82,000
🖨 Deal sheet (PDF) 📄 Offer letter ✓ Due diligence
Listing remarks MLS
This charming and budget-friendly 2-bedroom, 1-bath home in Clinton, KY offers both comfort and opportunity. With recent updates including a new roof in 2022 and a new hot water heater in 2024, this home is move-in ready with peace of mind. Ideal for first-time buyers, investors, or those looking to downsize, the home features a bright and inviting living area, a functional eat-in kitchen, and two generously sized bedrooms. The full, unfinished basement provides endless possibilities—whether you need storage, a workshop, or future finished space.
Key facts
- Laminate flooring
- Metal roof
- Sump pump
Tags
Property features AI
Exterior
- Parking: Attached garage; 1 garage space; Carport
- Utilities: Public water; Public sewer
- Home design: Single-family residence; Residential property
- Construction: Aluminum siding; Asphalt and metal roof; Other foundation
- Exterior features: Rolling slope lot; Paved road access
Interior
- Kitchen: Refrigerator
- Bedrooms: Total rooms: 5
- Flooring: Carpet; Laminate
- Bathrooms: 1 full bathroom
- Heating & cooling: Natural gas heating; Ceiling fan(s); Cooling not specified
- Interior features: Storm windows; Fireplace with insert
- Laundry & utility: Washer; Dryer
Neighborhood map
What this means for you Summary
Snapshot
- This is a 2-bed/1.0-bath single-family listed at $82k.
Deal economics
- At list price, monthly cash flow is $196 ($2k/yr) — positive.
- The deal already cash-flows at list — no discount required.
- Meets the 1% rule at list price ($868 rent vs $82k).
Location & tenants
- Location reads 61/100 on livability (#369 in KY) — a middle-class / working-renter tenant base. Strengths: crime A+, cost of living A+, housing A+; Watch: amenities F, commute F, employment F.
- Hickman County (rural): math 41% / reading 49% proficiency, ranked #24 of 165 in KY (top 14%) — families likely to look elsewhere, expect single-tenant / working-renter base with shorter leases.
- Zoned schools: Hickman County Elementary School (math 42% / reading 47%, grade F, #148 of 676 statewide, top 24%, 421 students, 58% FRL); Hickman County High School (math 37% / reading 47%, grade F, #32 of 254 statewide, top 13%, 302 students, 57% FRL).
- Market conditions: 22 active listings in the ZIP.
Forward outlook
- Local home prices are declining (-3.0%/yr); year-one equity from $567 of loan paydown is wiped out by about $2k of value loss. Plan a longer hold.
- Hickman County population projected at -29% by 2050 — secular population decline; favor cash flow + early exit over multi-decade hold.
Negotiation context
- Only 12 days on market — expect competitive offers; lowballing is unlikely to land.
- 3 sale attempts since 5y ago with the ask held roughly flat each time — persistent listings suggest the price (not the market) is what's stuck; bring a comps-based counter.
- Current owner paid $47k; list at $82k implies a 74% gain — meaningful room to come down on a strong offer.
Risks & watch-outs
- Climate carrying-cost: extreme-heat days projected 7→21/yr by 2055 (HVAC capex compounding) — expect insurance premiums to compound above CPI over the hold.
Questions for the listing agent
- Is there a deadline driving the sale (1031 exchange, divorce, estate, relocation)? That informs how much negotiation room exists.
- Schools are D-rated, which usually means shorter tenancies and higher turnover. Who's the typical renter profile here, and what's been the actual vacancy rate?
- What's the average days-on-market for RENTAL listings here right now (not sales)? A rising rental-DOM trend means longer vacancies and softer asking-rent achievability than the comps imply.
- What's the recent tenant-quality profile in this submarket — average credit score on applications, eviction rate, late-payment / NSF rate, and stable-employment percentage? A property-management company in the area should have these aggregated.
- How much new for-sale + rental construction is in the pipeline within 1–3 miles? Heavy new supply typically softens prices + rents 12–24 months out; constrained supply supports both.
Investment metrics
- 1% rule
- 1.06% ✓
- Cap rate
- 9.16%
- Cash-on-cash
- 10.23%
- DSCR
- 1.46
- GRM
- 7.9
CMA / ARV
- ARV (on-the-fly)
- $86,400
- Comps found
- 4
Show comp detail 4 sales within ~0.75 mi
| Address | Dist | Beds/Ba | Sqft | Sold | Price | $/sf | Match |
|---|---|---|---|---|---|---|---|
| 513 Mayfield Rd | 0.00mi | 2/1.0 | 960 (0%) | 10mo | $47,000 | $49 | 92 |
| 512 Elm St | 0.25mi | 2/1.0 | 918 (-4%) | 1mo | $89,000 | $97 | 80 |
| 413 Mayfield Highway Rd | 0.20mi | 1/1.0 (-1) | 927 (-3%) | 12mo | $65,000 | $70 | 70 |
| 528 Elm | 0.27mi | 2/1.0 | 1,061 (+10%) | 11mo | $95,000 | $90 | 61 |
Match score weights: distance 35% · size 25% · config 20% · recency 20%. Top-matched comps best support the ARV.
Projected returns pro-forma
-3.0% appreciation · 3.0% rent growth · sell at horizon
- IRR
- -1.0%
- Equity multiple
- 0.96×
- Total profit
- $-855
- Equity at exit
- $12,226
- IRR
- 8.7%
- Equity multiple
- 1.66×
- Total profit
- $15,171
- Equity at exit
- $7,090
Cash invested: $22,960 (down + closing). Projections, not guarantees.
Landlord ↔ Tenant lean methodology
- Overall (STATE)
- 83 Strongly Landlord-Friendly
- State Kentucky
- 83 Strongly Landlord-Friendly · R+16
- County
- — inherits STATE
- City
- — inherits STATE
ZIP-level market 42031
- Home prices YoY
- -1.3%
- Active inventory
- 22
- Price-to-rent
- 7.9×
Monthly cashflow live
- Estimated rent
- $868 medium interval (Pro) →
- Mortgage (P&I)
- −$430
- Tax from tax record
- −$26 /mo · $314/yr
- Insurance
- −$34
- HOA
- −$0
- Vacancy / Maint / Mgmt
- −$182
- Net cashflow
- $196
Break-even live
Sensitivity live
| Price | -10% $242 | -5% $219 | +0% $196 | +5% $173 | +10% $149 |
|---|---|---|---|---|---|
| Rent | -10% $127 | -5% $161 | +0% $196 | +5% $230 | +10% $264 |
| Rate | -1.0pp $237 | -0.5pp $217 | base $196 | +0.5pp $174 | +1.0pp $153 |
UW: 25.0% down · 7.5% · 30yr · 1.5% tax · 5.0% vac · 8.0% maint · 8.0% mgmt
Financing live
Cash to close
- Down payment
- $20,500
- Closing costs
- $2,460
- Reserves months
- —
- Total cash needed
- —
Loan-product check · same deal, 3 products live
Conventional
25% down · 7.5% · 30yr
- Down + closing
- —
- Monthly P&I
- —
- Monthly cashflow
- —
- DSCR
- —
- Eligible?
- —
Personal DTI + credit; lowest rate.
DSCR
20% down · 8.5% · 30yr
- Down + closing
- —
- Monthly P&I
- —
- Monthly cashflow
- —
- DSCR
- —
- Eligible?
- —
No personal income docs; deal must DSCR.
Hard money
10% down · 12.0% · 12mo
- Down + closing
- —
- Monthly P&I
- —
- Monthly cashflow
- —
- DSCR
- —
- Eligible?
- —
Short-term bridge; refi at stabilization.
Listing history 10 events
-
2026-06-21days on market $82,000 Active 12 DOM
-
2026-06-21days on market $82,000 Active 11 DOM
-
2026-06-18days on market $82,000 Active 9 DOM
-
2026-06-17days on market $82,000 Active 8 DOM
-
2026-06-16days on market $82,000 Active 7 DOM
-
2026-06-15days on market $82,000 Active 6 DOM
-
2026-06-13days on market $82,000 Active 4 DOM
-
2026-06-12days on market $82,000 Active 3 DOM
-
2026-06-09remarks 213-char remark
-
2026-06-09$82,000 Active 1 DOM
ⓘ Source: listings_history table (triggers on properties + properties_extension) + one-shot
backfill from property_details.listing_events for pre-trigger history.
Tax reassessment forecast KY · Resets to sale price
- Current annual tax
- $314 · $26/mo
- Projected year-2 tax
- $705 · $59/mo
- Expected delta
- +$391/yr (+$33/mo · 124.5%)
ⓘ Screening estimate from a state-policy table — verify with the county assessor before closing.
Climate risk First Street
- Flood 1/10 Low FEMA zone X (unshaded) · 0% chance over 30 yrs
- Wildfire 1/10 Low
- Heat 5/10 Major 7 d/yr ≥108°F today · 21 d/yr by 30 yrs out
- Wind 4/10 Moderate 8% chance of damaging wind over 30 yrs
- Air quality 1/10 Low 0 unhealthy d/yr today · 0 by 30 yrs out
Nearby sold comps map
Loading sold comps map…
Walkable amenities ~0.75 mi
Loading nearby amenities…
Taxation est. · year 1
- Rental income
- $10,422
- − Mortgage interest
- −$4,593
- − Property taxes
- −$314
- − Insurance
- −$410
- − Repairs & maintenance
- −$834
- − Management
- −$834
- − Depreciation
- −$2,385
- Taxable income
- $1,051
- Est. tax owed @ 24.0%
- −$252
- After-tax cash flow
- $2,096/yr
For passive investors: Depreciation is non-cash, so a rental often shows a tax loss while cash-flowing — sheltering income. Rental losses are passive: they offset passive income freely, and up to $25,000/yr can offset ordinary (W-2) income if you actively participate and your MAGI is under $100k (phasing out to $0 by $150k); unused losses carry forward. On sale, claimed depreciation is recaptured at up to 25%, and gains may owe capital-gains tax (a 1031 exchange can defer both). Figures are a year-1 estimate at your 24.0% rate — not tax advice; consult a CPA.
Schools (NCES district)
- District
- Hickman County
- NCES district ID
- 2102790
- Math proficiency
- 41% ▼ -10.00%
- Reading proficiency
- 49% ▼ -5.00%
- Median HH income
- $37,542
- Composite
- 37.42/100
- National rank
- #4421
- State rank
- #24 of 165 in KY
Livability — Clinton
- Score
- 61/100
- State rank
- #369
- US rank
- #17542
Category grades
Schools grade is shown separately in the Schools card above.
Census & demographics
- Census place
- Clinton, KY
- Population (ZIP)
- 3,388
Population outlook (Hickman County) Hauer SSP2
- Today (2025)
- 4,255 people
- By 2030
- 4,018 · -5.6%
- By 2040
- 3,511 · -17.5%
- By 2050
- 3,026 · -28.9%
- By 2075
- 2,090 · -50.9%
- By 2100
- 1,322 · -68.9%
Race, ethnicity, and origin ACS 2023
- Neighborhood character
- Predominantly White (84%)
- Race & ethnicity
- White 84% Black 12% Two or more races 3%
- Common ancestry
- Lithuanian 1% Scottish 1% Slovak 1%
- Foreign-born
- 0%
- Languages at home
- 99% English-only · Spanish 1%
Political lean MEDSL · Hickman
- 2024 margin
- Solid R (+61.0) · D 19.0% · R 80.0%
- 2008→2024 swing
- -34.6pp toward R · 2008: -26.4pp · 2024: -61.0pp
- All cycles
- 2024: R+61.0 2020: R+57.1 2016: R+56.0 2012: R+34.8 2008: R+26.4
Not yet ingested
- Civics
- —
Market trends
- HPI YoY
- ▼ -3.41%
- Current HPI
- 260.197
- Rent YoY
- —
- Metro
- —
- State GDP YoY
- ▲ 1.81%
- F500 in state
- 4
Industry mix (Fortune 500 HQ in KY)
| Industry | F500 HQs | Revenue |
|---|---|---|
| Healthcare | 1 | $118B |
|
||
| Food / Beverage | 1 | $7B |
|
||
Price history
+228.0% since first listed10 events — show timeline
- 2026-06-09 Listed $82,000 RRAR as distributed by MLS GRID
- 2026-03-17 Price Changed $77,500 RRAR as distributed by MLS GRID
- 2025-08-22 Sold (Public Records) $47,000 Public Records
- 2025-08-22 Sold (MLS) $47,000 WKRMLS
- 2025-07-18 Listed $67,500 WKRMLS
- 2021-09-17 Sold (Public Records) $25,000 Public Records
- 2021-09-17 Sold (MLS) $25,000 RRAR as distributed by MLS GRID
- 2021-07-31 Listed $27,500 RRAR as distributed by MLS GRID
- 2007-03-01 Sold (Public Records) $32,685 Public Records
- 1995-08-01 Sold (Public Records) $25,000 Public Records
Property tax history
+1.1%/yrLatest (2025): $314 · +9.4% YoY. Source: county tax records.
Cash-flow waterfall
monthlySold comps — $/sqft
last 12 mo · ≤1 miLoading sold comps…