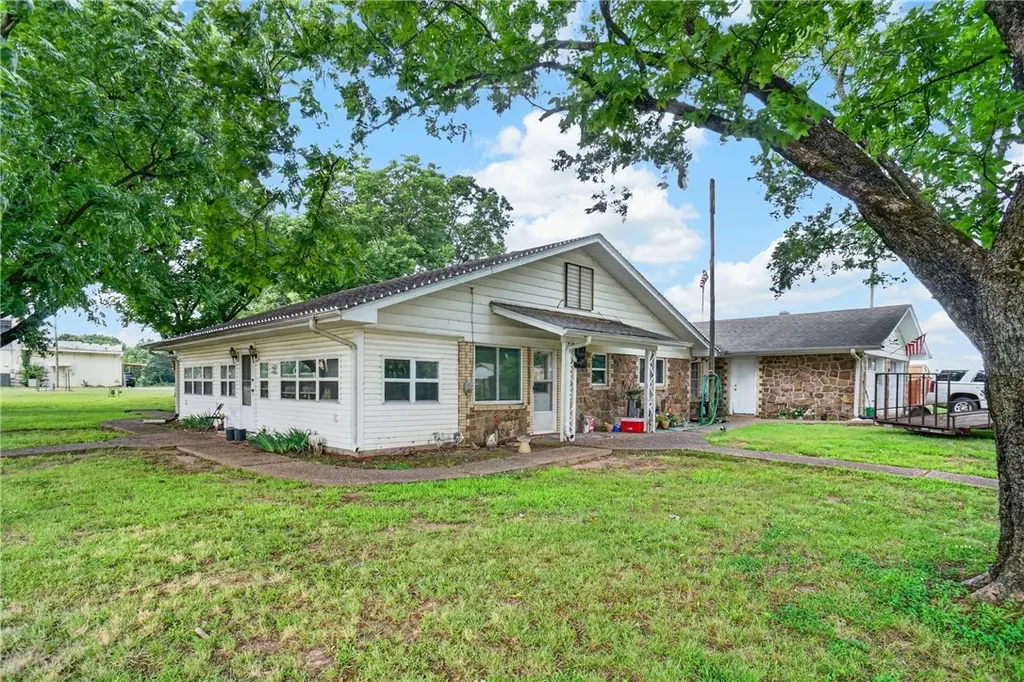
108 N Park Ave · Scranton, AR
Flood risk 1/10 · Minimal
- FEMA flood zone
- X (unshaded)
- Chance of flooding over 30 yrs
- 0.0%
- Est. flood insurance / yr
- $507 – $1,088
Fire risk 3/10 · Minor
- Est. fire insurance / yr
- $1,499 – $2,785
Heat risk 7/10 · Major
- Hot days now (above 111°F)
- 7 days/yr
- Hot days in 30 yrs
- 21 days/yr
Wind risk 2/10 · Minimal
- Chance of severe wind over 30 yrs
- 2.0%
Air-quality risk 1/10 · Minimal
- Unhealthy air days now
- 0 days/yr
- Unhealthy air days in 30 yrs
- 0 days/yr
Risk factors via First Street. Map © Google.
Why this score? — see what drove the C grade
The composite is a weighted blend of 9 inputs, each scored 0–100. Each bar is that input's sub-score; the figure is the points it added to the 100-point composite (weight × sub-score).
- Cash flow +20.8/30.0
- ARV discount +7.5/15.0
- DSCR +6.6/10.0
- Appreciation +5.0/10.0
- 1% rule +4.3/10.0
- Schools +3.1/10.0
- Livability +3.1/5.0
- Rent growth +2.5/5.0
- Condition / age +2.5/5.0
$129,900
🖨 Deal sheet (PDF) 📄 Offer letter ✓ Due diligence
Listing remarks
This charming 1,920 square foot rock home offers the perfect blend of comfort and character. Featuring 3 bedrooms and 1.5 bathrooms, the home includes a large living room ideal for family gatherings, a formal dining room perfect for entertaining, and a spacious kitchen with plenty of room for meal preparation and storage. Outside, you'll find a beautiful yard accented by mature pecan trees and a lovely gazebo, creating the perfect setting to relax and enjoy the outdoors. This property is full of warmth and ready to welcome its next owners home.
Key facts
- Mature pecan trees
- Formal dining room
- Spacious kitchen
Tags
Property features AI
Finance
- HOA & community: Monthly association fee; Near national forest and state park; Near trails/paths; Near schools
Exterior
- Parking: Attached 2-car garage
- Utilities: Electricity available; Natural gas available; Sewer available
- Home design: Single-story home; Rock exterior; Architectural shingle roof; Foundation: Block; Home is 25 years old or older
- Construction: Rock construction; Architectural shingle roof; Block foundation
- Exterior features: Concrete driveway; Covered patio/porch; Cleared, level city lot in a subdivision; Public road frontage
Interior
- Kitchen: Dishwasher
- Flooring: Carpet; Laminate
- Bathrooms: One full bathroom; One half bathroom
- Heating & cooling: Central heating; Central air conditioning
- Interior features: No notable interior features listed
- Laundry & utility: Electric water heater
Neighborhood map
What this means for you Summary
Snapshot
- This is a 3-bed/1.5-bath single-family listed at $130k.
Deal economics
- At list price, monthly cash flow is $179 ($2k/yr) — positive.
- The deal already cash-flows at list — no discount required.
- To meet the 1% rule (rent ≥ 1% of price), the offer needs to be $121k (7.1% below list).
- Recommended offer: $121k (7.1% below list) — sets the bar for 1% rule.
Location & tenants
- Location reads 61/100 on livability (#229 in AR) — a middle-class / working-renter tenant base. Strengths: cost of living A+, housing A; Watch: crime F, amenities F, commute F.
- Scranton School District (rural): math 35% / reading 38% proficiency, ranked #105 of 238 in AR (top 44%) — families likely to look elsewhere, expect single-tenant / working-renter base with shorter leases.
- Zoned schools: Scranton Elementary School (math 37% / reading 32%, grade F, #254 of 454 statewide, top 59%, 239 students, 56% FRL); Scranton High School (math 32% / reading 47%, grade F, #48 of 292 statewide, top 19%, 198 students, 43% FRL).
- Market conditions: 11 active listings in the ZIP; 11 units permitted in Logan County in 2024 (0 in 5+ unit buildings).
Forward outlook
- In year one you build about $5k of equity ($898 loan paydown + $4k appreciation (3.0% local appreciation)).
- Logan County population projected at -13% by 2050 — secular population decline; favor cash flow + early exit over multi-decade hold.
- At projected returns (3.0% appreciation + 3.0% rent growth), your $36k cash investment doubles in ~5 years — after that, you're playing with house money.
- By year 7, paydown + projected appreciation supports a ~$30k cash-out refi (75% LTV) — recoverable capital for the next deal without selling this one.
Negotiation context
- Only 9 days on market — expect competitive offers; lowballing is unlikely to land.
- Current owner paid $110k; 18% above their basis — modest negotiation headroom, anchor on the comps not their cost.
Risks & watch-outs
- Watch-outs: built in 1941 — expect roof / HVAC / electrical / plumbing capex.
- Climate carrying-cost: extreme-heat days projected 7→21/yr by 2055 (HVAC capex compounding) — expect insurance premiums to compound above CPI over the hold.
Questions for the listing agent
- Built in 1941 — when were the roof, HVAC, electrical panel, plumbing, and water heater last replaced?
- Is there a deadline driving the sale (1031 exchange, divorce, estate, relocation)? That informs how much negotiation room exists.
- Schools are B-rated — typically a magnet for longer-tenancy family renters. What's the average tenant stay here, and is there a school-zone premium baked into asking?
- Crime grade is F in this area — have there been break-ins, vandalism, or insurance claims at this property in the last 3 years? What carrier currently insures it and at what premium?
- What's the average days-on-market for RENTAL listings here right now (not sales)? A rising rental-DOM trend means longer vacancies and softer asking-rent achievability than the comps imply.
- What's the recent tenant-quality profile in this submarket — average credit score on applications, eviction rate, late-payment / NSF rate, and stable-employment percentage? A property-management company in the area should have these aggregated.
- How much new for-sale + rental construction is in the pipeline within 1–3 miles? Heavy new supply typically softens prices + rents 12–24 months out; constrained supply supports both.
Investment metrics
- 1% rule
- 0.93% ✗
- Cap rate
- 7.95%
- Cash-on-cash
- 5.92%
- DSCR
- 1.26
- GRM
- 9.0
CMA / ARV
No comps found within radius.
Projected returns pro-forma
3.0% appreciation · 3.0% rent growth · sell at horizon
- IRR
- 13.0%
- Equity multiple
- 1.74×
- Total profit
- $27,010
- Equity at exit
- $58,409
- IRR
- 14.9%
- Equity multiple
- 3.20×
- Total profit
- $80,089
- Equity at exit
- $90,015
Cash invested: $36,372 (down + closing). Projections, not guarantees.
Landlord ↔ Tenant lean methodology
- Overall (STATE)
- 92 Strongly Landlord-Friendly
- State Arkansas
- 92 Strongly Landlord-Friendly · R+14
- County
- — inherits STATE
- City
- — inherits STATE
ZIP-level market 72863
- Active inventory
- 11
- Price-to-rent
- 9.0×
Monthly cashflow live
- Estimated rent
- $1,206 medium interval (Pro) →
- Mortgage (P&I)
- −$681
- Tax from tax record
- −$38 /mo · $462/yr
- Insurance
- −$54
- HOA
- −$0
- Vacancy / Maint / Mgmt
- −$253
- Net cashflow
- $179
Break-even live
Sensitivity live
| Price | -10% $253 | -5% $216 | +0% $179 | +5% $143 | +10% $106 |
|---|---|---|---|---|---|
| Rent | -10% $84 | -5% $132 | +0% $179 | +5% $227 | +10% $275 |
| Rate | -1.0pp $245 | -0.5pp $212 | base $179 | +0.5pp $146 | +1.0pp $111 |
UW: 25.0% down · 7.5% · 30yr · 1.5% tax · 5.0% vac · 8.0% maint · 8.0% mgmt
Financing live
Cash to close
- Down payment
- $32,475
- Closing costs
- $3,897
- Reserves months
- —
- Total cash needed
- —
Loan-product check · same deal, 3 products live
Conventional
25% down · 7.5% · 30yr
- Down + closing
- —
- Monthly P&I
- —
- Monthly cashflow
- —
- DSCR
- —
- Eligible?
- —
Personal DTI + credit; lowest rate.
DSCR
20% down · 8.5% · 30yr
- Down + closing
- —
- Monthly P&I
- —
- Monthly cashflow
- —
- DSCR
- —
- Eligible?
- —
No personal income docs; deal must DSCR.
Hard money
10% down · 12.0% · 12mo
- Down + closing
- —
- Monthly P&I
- —
- Monthly cashflow
- —
- DSCR
- —
- Eligible?
- —
Short-term bridge; refi at stabilization.
Listing history 8 events
-
2026-06-21statusdays on market $129,900 Pending 9 DOM
-
2026-06-19days on market $129,900 Active 7 DOM
-
2026-06-18days on market $129,900 Active 6 DOM
-
2026-06-17days on market $129,900 Active 5 DOM
-
2026-06-16days on market $129,900 Active 4 DOM
-
2026-06-15days on market $129,900 Active 3 DOM
-
2026-06-12remarks 550-char remark
-
2026-06-12$129,900 Active 1 DOM
ⓘ Source: listings_history table (triggers on properties + properties_extension) + one-shot
backfill from property_details.listing_events for pre-trigger history.
Tax reassessment forecast AR · Resets to sale price
- Current annual tax
- $462 · $38/mo
- Projected year-2 tax
- $831 · $69/mo
- Expected delta
- +$370/yr (+$31/mo · 80.0%)
ⓘ Screening estimate from a state-policy table — verify with the county assessor before closing.
Climate risk First Street
- Flood 1/10 Low FEMA zone X (unshaded) · 0% chance over 30 yrs
- Wildfire 3/10 Moderate
- Heat 7/10 Severe 7 d/yr ≥111°F today · 21 d/yr by 30 yrs out
- Wind 2/10 Low 2% chance of damaging wind over 30 yrs
- Air quality 1/10 Low 0 unhealthy d/yr today · 0 by 30 yrs out
Nearby sold comps map
Loading sold comps map…
Walkable amenities ~0.75 mi
Loading nearby amenities…
Taxation est. · year 1
- Rental income
- $14,478
- − Mortgage interest
- −$7,276
- − Property taxes
- −$462
- − Insurance
- −$650
- − Repairs & maintenance
- −$1,158
- − Management
- −$1,158
- − Depreciation
- −$3,779
- Taxable loss
- −$5
- Est. tax savings @ 24.0%
- +$1
- After-tax cash flow
- $2,153/yr
For passive investors: Depreciation is non-cash, so a rental often shows a tax loss while cash-flowing — sheltering income. Rental losses are passive: they offset passive income freely, and up to $25,000/yr can offset ordinary (W-2) income if you actively participate and your MAGI is under $100k (phasing out to $0 by $150k); unused losses carry forward. On sale, claimed depreciation is recaptured at up to 25%, and gains may owe capital-gains tax (a 1031 exchange can defer both). Figures are a year-1 estimate at your 24.0% rate — not tax advice; consult a CPA.
Schools (NCES district)
- District
- Scranton School District
- NCES district ID
- 0512180
- Math proficiency
- 35% ▼ -18.00%
- Reading proficiency
- 38% ▼ -17.00%
- Median HH income
- $41,076
- Composite
- 30.73/100
- National rank
- #6163
- State rank
- #105 of 238 in AR
Livability — Scranton
- Score
- 61/100
- State rank
- #229
- US rank
- #17326
Category grades
Schools grade is shown separately in the Schools card above.
Census & demographics
- Census place
- Scranton, AR
- Population (ZIP)
- 1,678
Population outlook (Logan County) Hauer SSP2
- Today (2025)
- 21,046 people
- By 2030
- 20,537 · -2.4%
- By 2040
- 19,443 · -7.6%
- By 2050
- 18,220 · -13.4%
- By 2075
- 16,164 · -23.2%
- By 2100
- 14,858 · -29.4%
Race, ethnicity, and origin ACS 2023
- Neighborhood character
- Predominantly White (89%)
- Race & ethnicity
- White 89% Hispanic / Latino 4% Two or more races 4% Asian 3% Black 3%
- Common ancestry
- Lithuanian 2% Slovak 1% Serbian 1%
- Foreign-born
- 3%
- Languages at home
- 95% English-only · Other Asian/Pacific 3% Spanish 1%
Political lean MEDSL · Logan
- 2024 margin
- Solid R (+62.2) · D 17.8% · R 80.0% · Other 2.1%
- 2008→2024 swing
- -23.5pp toward R · 2008: -38.8pp · 2024: -62.2pp
- All cycles
- 2024: R+62.2 2020: R+59.5 2016: R+51.4 2012: R+41.9 2008: R+38.8
Not yet ingested
- Civics
- —
Market trends
- HPI YoY
- —
- Current HPI
- —
- Rent YoY
- —
- Metro
- —
- State GDP YoY
- ▲ 3.80%
- F500 in state
- 10
Industry mix (Fortune 500 HQ in AR)
| Industry | F500 HQs | Revenue |
|---|---|---|
| Retail | 1 | $681B |
|
||
| Food / Agriculture | 1 | $53B |
|
||
| Retail / Energy | 1 | $22B |
|
||
| Transportation / Logistics | 1 | $12B |
|
||
| Energy | 1 | $4B |
|
||
Price history
+18.1% since first listed2 events — show timeline
- 2026-06-12 Listed $129,900 NWARMLS
- 2025-04-11 Sold (Public Records) $110,000 Public Records
Property tax history
-3.5%/yrLatest (2025): $462 · -9.6% YoY. Source: county tax records.
Cash-flow waterfall
monthlySold comps — $/sqft
last 12 mo · ≤1 miLoading sold comps…