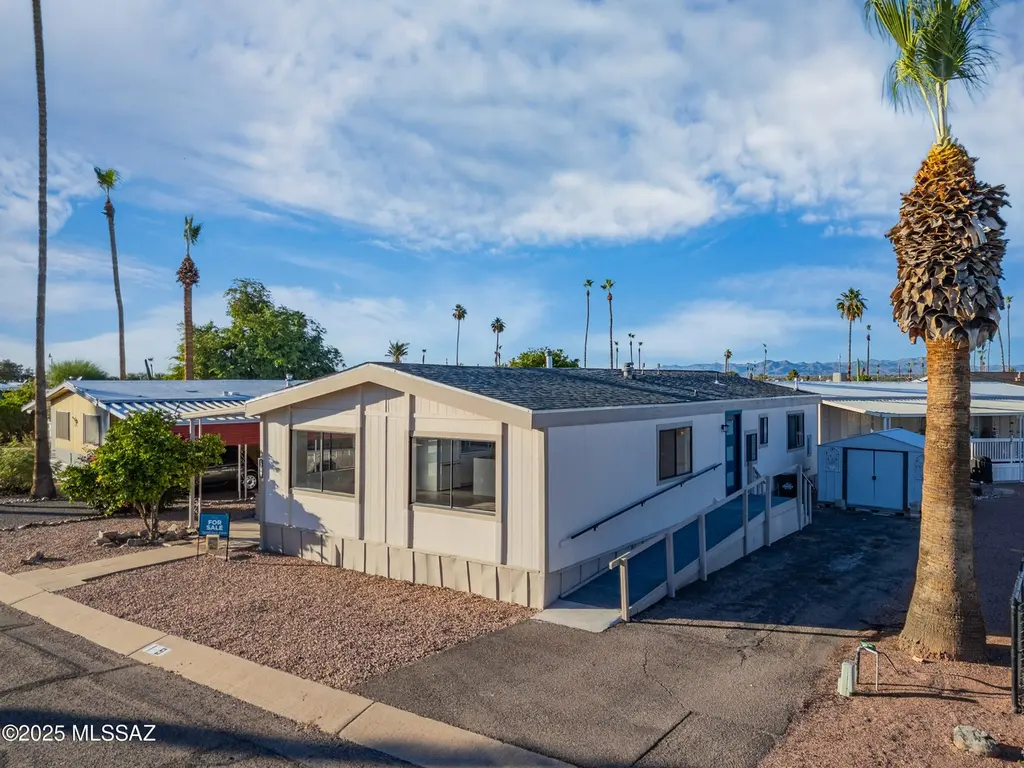
2305 W Ruthrauff Rd · Flowing Wells, AZ
Flood risk 1/10 · Minimal
- FEMA flood zone
- X (unshaded)
- Chance of flooding over 30 yrs
- 0.0%
- Est. flood insurance / yr
- $507 – $1,088
Fire risk 5/10 · Moderate
- Est. fire insurance / yr
- $610 – $1,132
Heat risk 8/10 · Major
- Hot days now (above 107°F)
- 6 days/yr
- Hot days in 30 yrs
- 16 days/yr
Wind risk 1/10 · Minimal
- Chance of severe wind over 30 yrs
- —
Air-quality risk 1/10 · Minimal
- Unhealthy air days now
- 0 days/yr
- Unhealthy air days in 30 yrs
- 0 days/yr
Risk factors via First Street. Map © Google.
Why this score? — see what drove the B- grade
The composite is a weighted blend of 9 inputs, each scored 0–100. Each bar is that input's sub-score; the figure is the points it added to the 100-point composite (weight × sub-score).
- Cash flow +30.0/30.0
- 1% rule +10.0/10.0
- DSCR +10.0/10.0
- ARV discount +7.5/15.0
- Livability +3.7/5.0
- Rent growth +2.6/5.0
- Condition / age +2.5/5.0
- Schools +2.2/10.0
- Appreciation +0.0/10.0
$99,000
🖨 Deal sheet 📄 Offer letter ✓ Due diligence
Listing remarks MLS
Beautifully remodeled 3-bed, 2-bath home in the highly desirable Bella Capri 55+ gated community Lot # I9. This sale is for the mobile home only—home is located on leased land. Enjoy brand-new updates throughout including a new roof, AC, dual-pane windows, flooring, kitchen and bath cabinets, countertops, paint, skirting, and fully remodeled bathrooms. Bella Capri offers resort-style amenities including a pool, spa, clubhouse, billiards, shuffleboard, laundry facilities, and planned social events—all within a friendly, active neighborhood. With wide paved streets, off-street parking, and a prime Tucson location near shopping, dining, and golf, this community provides both comfort and convenience. Seller financing available!
Key facts
- Remodeled
- Dual-pane windows
- New flooring
Tags
Neighborhood map
What this means for you Summary
Snapshot
- This is a 3-bed/2.0-bath land listed at $99k.
Deal economics
- At list price, monthly cash flow is $702 ($8k/yr) — positive.
- The deal already cash-flows at list — no discount required.
- Meets the 1% rule at list price ($2k rent vs $99k).
- Recommended offer: $87k (12.0% below list) — sets the bar for market timing.
- Cap rate 14.8% vs local median 6.1% in Flowing Wells — top-decile yield for the area; either an underpriced asset or a hidden risk that comps aren't pricing in. Stress-test before assuming the spread holds.
Location & tenants
- Location reads 73/100 on livability (#21 in AZ) — a middle-class / working-renter tenant base. Strengths: commute A+, cost of living A+, health & safety A+; Watch: schools D+, crime F, amenities F.
- Flowing Wells Unified District (4405) (suburban): math 23% / reading 30% proficiency, ranked #143 of 249 in AZ (top 57%) — low school quality limits family demand, transient renter base, plan for 1-2y turnover; 64% free/reduced lunch — lower-income household profile, screen leases tightly.
- Market conditions: Rents flat; 177 active listings in the ZIP; 13 comparable units currently listed for rent nearby; rentals leasing fast (median 3d on market — plan ~1-2 weeks tenant-placement turnaround); lower-income renter base — watch delinquency; 5,268 units permitted in Pima County in 2024 (996 in 5+ unit buildings).
- At $1,755/mo this rent would consume 57% of the median local household income ($37k/yr) (locally 4240% of renters already pay >50% of income on rent) — very limited rent-growth headroom before tenants either downsize or default.
Forward outlook
- Local home prices are declining (-3.0%/yr); year-one equity from $684 of loan paydown is wiped out by about $3k of value loss. Plan a longer hold.
- Pima County population projected at +8% by 2050 — modest demand growth; plan on rents tracking national, not racing it.
- At projected returns (-3.0% appreciation + 0.3% rent growth), your $28k cash investment doubles in ~5 years — after that, you're playing with house money.
Negotiation context
- It's been on market 241 days — a 12% lower offer ($87k) is reasonable based on typical stale-listing flexibility.
- 5 sale attempts since 7y ago; this cycle's ask has dropped $26k (21%) from the opening price — seller is motivated, your offer sets the floor, not the list.
Risks & watch-outs
- Climate carrying-cost: moderate wildfire risk; extreme-heat days projected 6→16/yr by 2055 (HVAC capex compounding) — expect insurance premiums to compound above CPI over the hold.
Questions for the listing agent
- It's been on market 241 days. Have you received any prior offers? Is the seller open to a 12% concession, seller financing, or rate buy-down credit?
- Why hasn't it sold? Are there any deal-killer items the seller is aware of (foundation, flood, title, zoning, code violations)?
- Is there a deadline driving the sale (1031 exchange, divorce, estate, relocation)? That informs how much negotiation room exists.
- Schools are D-rated, which usually means shorter tenancies and higher turnover. Who's the typical renter profile here, and what's been the actual vacancy rate?
- Crime grade is F in this area — have there been break-ins, vandalism, or insurance claims at this property in the last 3 years? What carrier currently insures it and at what premium?
- What's the average days-on-market for RENTAL listings here right now (not sales)? A rising rental-DOM trend means longer vacancies and softer asking-rent achievability than the comps imply.
- What's the recent tenant-quality profile in this submarket — average credit score on applications, eviction rate, late-payment / NSF rate, and stable-employment percentage? A property-management company in the area should have these aggregated.
- How much new for-sale + rental construction is in the pipeline within 1–3 miles? Heavy new supply typically softens prices + rents 12–24 months out; constrained supply supports both.
Investment metrics
- 1% rule
- 1.77% ✓
- Cap rate
- 14.80%
- Cash-on-cash
- 30.39%
- DSCR
- 2.35
- GRM
- 4.7
CMA / ARV
- ARV (median comp)
- $226,307
- List price
- $99,000
- Delta
- -56.25%
- Verdict
- UNDERPRICED
- Comps
- 11 within 1.0 mi
Projected returns pro-forma
-3.0% appreciation · 0.3% rent growth · sell at horizon
- IRR
- 22.0%
- Equity multiple
- 1.87×
- Total profit
- $24,052
- Equity at exit
- $14,761
- IRR
- 28.2%
- Equity multiple
- 3.19×
- Total profit
- $60,577
- Equity at exit
- $8,560
Cash invested: $27,720 (down + closing). Projections, not guarantees.
Landlord ↔ Tenant lean methodology
- Overall (STATE)
- 87 Strongly Landlord-Friendly
- State Arizona
- 87 Strongly Landlord-Friendly · R+3
- County
- — inherits STATE
- City
- — inherits STATE
ZIP-level market 85705
- Rents YoY
- 0.3%
- Active inventory
- 177
- Price-to-rent
- 4.7×
Monthly cashflow live
- Estimated rent
- $1,755 high interval (Pro) →
- Mortgage (P&I)
- −$519
- Tax est. 1.5%
- −$124 /mo · $1,485/yr
- Insurance
- −$41
- HOA
- −$0
- Vacancy / Maint / Mgmt
- −$368
- Net cashflow
- $702
Break-even live
UW: 25.0% down · 7.5% · 30yr · 1.5% tax · 5.0% vac · 8.0% maint · 8.0% mgmt
Financing live
Cash to close
- Down payment
- $24,750
- Closing costs
- $2,970
- Reserves months
- —
- Total cash needed
- —
Loan-product check · same deal, 3 products live
Conventional
25% down · 7.5% · 30yr
- Down + closing
- —
- Monthly P&I
- —
- Monthly cashflow
- —
- DSCR
- —
- Eligible?
- —
Personal DTI + credit; lowest rate.
DSCR
20% down · 8.5% · 30yr
- Down + closing
- —
- Monthly P&I
- —
- Monthly cashflow
- —
- DSCR
- —
- Eligible?
- —
No personal income docs; deal must DSCR.
Hard money
10% down · 12.0% · 12mo
- Down + closing
- —
- Monthly P&I
- —
- Monthly cashflow
- —
- DSCR
- —
- Eligible?
- —
Short-term bridge; refi at stabilization.
Rent comps 13 comps
| Address | Beds | Baths | Sqft | Rent | $/sqft | DOM | Units | Dist |
|---|---|---|---|---|---|---|---|---|
| 4861 N River Vista Dr Tucson, AZ | 3.0 | 2.0 | 1144 | $1,500 | $1.31 | 3d | 1 | 0.66mi |
| 2001 W La Osa Dr Tucson, AZ | 4.0 | 2.0 | 1866 | $2,045 | $1.10 | 43d | 1 | 0.74mi |
| 1925 W River Rd Tucson, AZ | 1.0–3.0 | 1.0–2.0 | 1049 | $2,076 | $1.98 | 1d | 32 | 0.96mi |
| 5132 Prairie Clover Trl Tucson, AZ | 3.0–4.0 | 2.0–2.5 | 1604 | $1,897 | $1.18 | 1d | 13 | 1.03mi |
| 5416 N Bramble Brook Ln Tucson, AZ | 3.0 | 2.0 | 1483 | $1,850 | $1.25 | 3d | 1 | 1.09mi |
| 5077 N Fortune Teller Way Tucson, AZ | 3.0 | 2.5 | 1370 | $1,875 | $1.37 | 17d | 1 | 1.15mi |
| 5021 N Kevy Pl Tucson, AZ | 3.0 | 2.0 | 1350 | $1,650 | $1.22 | 43d | 1 | 1.25mi |
| 2774 W Firebrook Rd Tucson, AZ | 2.0 | 2.0 | 1066 | $1,550 | $1.45 | 3d | 1 | 1.30mi |
| 2531 W Glenbrook Way Tucson, AZ | 2.0 | 2.0 | 1066 | $1,795 | $1.68 | 43d | 1 | 1.31mi |
| 4751 N Flowing Wells Rd Tucson, AZ | 3.0 | 3.0 | 1500 | $1,500 | $1.00 | 43d | 1 | 1.38mi |
| 2356 W Ian Pl Tucson, AZ | 3.0 | 2.0 | 1595 | $2,200 | $1.38 | 1d | 1 | 1.39mi |
| 5841 N Belbrook Dr Tucson, AZ | 3.0 | 2.5 | 1619 | $2,200 | $1.36 | 16d | 1 | 1.40mi |
| 5750 N La Cholla Blvd Tucson, AZ | 2.0–3.0 | 2.0 | 1453 | $2,172 | $1.49 | 1d | 11 | 1.41mi |
Listing history 27 events
-
2026-06-18days on market $99,000 Active 241 DOM
-
2026-06-17days on market $99,000 Active 240 DOM
-
2026-06-16days on market $99,000 Active 239 DOM
-
2026-06-15days on market $99,000 Active 238 DOM
-
2026-06-13days on market $99,000 Active 236 DOM
-
2026-06-10days on market $99,000 Active 233 DOM
-
2026-06-09days on market $99,000 Active 232 DOM
-
2026-06-08days on market $99,000 Active 231 DOM
-
2026-06-07days on market $99,000 Active 230 DOM
-
2026-06-05days on market $99,000 Active 227 DOM
-
2026-06-03days on market $99,000 Active 226 DOM
-
2026-06-02days on market $99,000 Active 225 DOM
-
2026-06-01days on market $99,000 Active 224 DOM
-
2026-05-31days on market $99,000 Active 223 DOM
-
2026-01-22price $99,000 746-char remark
Show marketing remark (746 chars)
Beautifully remodeled 3-bed, 2-bath home in the highly desirable Bella Capri 55+ gated community Lot # I9. This sale is for the mobile home only—home is located on leased land. Enjoy brand-new updates throughout including a new roof, AC, dual-pane windows, flooring, kitchen and bath cabinets, countertops, paint, skirting, and fully remodeled bathrooms. Bella Capri offers resort-style amenities including a pool, spa, clubhouse, billiards, shuffleboard, laundry facilities, and planned social events—all within a friendly, active neighborhood. With wide paved streets, off-street parking, and a prime Tucson location near shopping, dining, and golf, this community provides both comfort and convenience. Seller financing available!
-
2025-10-20$124,999 Active 746-char remark
Show marketing remark (746 chars)
Beautifully remodeled 3-bed, 2-bath home in the highly desirable Bella Capri 55+ gated community Lot # I9. This sale is for the mobile home only—home is located on leased land. Enjoy brand-new updates throughout including a new roof, AC, dual-pane windows, flooring, kitchen and bath cabinets, countertops, paint, skirting, and fully remodeled bathrooms. Bella Capri offers resort-style amenities including a pool, spa, clubhouse, billiards, shuffleboard, laundry facilities, and planned social events—all within a friendly, active neighborhood. With wide paved streets, off-street parking, and a prime Tucson location near shopping, dining, and golf, this community provides both comfort and convenience. Seller financing available!
-
2023-04-14historical
-
2023-03-29historical
-
2023-03-11price $49,900
-
2023-02-13status Active
-
2023-02-03status Pending
-
2023-02-01price $56,000
-
2023-01-23$52,000 Active
-
2023-01-09$56,500 Active
-
2019-08-14soldstatus $18,500,000
-
2019-03-11historical
-
2019-01-09$68,655 Active
ⓘ Source: listings_history table (triggers on properties + properties_extension) + one-shot
backfill from property_details.listing_events for pre-trigger history.
Climate risk First Street
- Flood 1/10 Low FEMA zone X (unshaded) · 0% chance over 30 yrs
- Wildfire 5/10 Major
- Heat 8/10 Severe 6 d/yr ≥107°F today · 16 d/yr by 30 yrs out
- Wind 1/10 Low
- Air quality 1/10 Low 0 unhealthy d/yr today · 0 by 30 yrs out
Nearby sold comps map
Loading sold comps map…
Walkable amenities ~0.75 mi
Loading nearby amenities…
Taxation est. · year 1
- Rental income
- $21,055
- − Mortgage interest
- −$5,546
- − Property taxes
- −$1,485
- − Insurance
- −$495
- − Repairs & maintenance
- −$1,684
- − Management
- −$1,684
- − Depreciation
- −$2,880
- Taxable income
- $7,281
- Est. tax owed @ 24.0%
- −$1,747
- After-tax cash flow
- $6,676/yr
For passive investors: Depreciation is non-cash, so a rental often shows a tax loss while cash-flowing — sheltering income. Rental losses are passive: they offset passive income freely, and up to $25,000/yr can offset ordinary (W-2) income if you actively participate and your MAGI is under $100k (phasing out to $0 by $150k); unused losses carry forward. On sale, claimed depreciation is recaptured at up to 25%, and gains may owe capital-gains tax (a 1031 exchange can defer both). Figures are a year-1 estimate at your 24.0% rate — not tax advice; consult a CPA.
Schools (NCES district)
- District
- Flowing Wells Unified District (4405)
- NCES district ID
- 0403010
- Math proficiency
- 23% ▼ -19.00%
- Reading proficiency
- 30% ▼ -14.00%
- Median HH income
- $33,361
- Composite
- 21.69/100
- National rank
- #8271
- State rank
- #143 of 249 in AZ
Livability — Flowing Wells
- Score
- 73/100
- State rank
- #21
- US rank
- #5288
Category grades
Schools grade is shown separately in the Schools card above.
Census & demographics
- Census place
- Flowing Wells, AZ
- County
- Pima County · 1,012,107 people
- Metro
- Tucson, AZ
- Population (ZIP)
- 54,700
- Household income
- $37,194
- Rent vs Own
- Severe rent burden
- 4240.0
Population outlook (Pima County) Hauer SSP2
- Today (2025)
- 1,066,056 people
- By 2030
- 1,086,684 · +1.9%
- By 2040
- 1,117,160 · +4.8%
- By 2050
- 1,149,778 · +7.9%
- By 2075
- 1,271,480 · +19.3%
- By 2100
- 1,321,160 · +23.9%
Race, ethnicity, and origin ACS 2023
- Neighborhood character
- Diverse neighborhood (Simpson 0.63)
- Race & ethnicity
- Hispanic / Latino 45% White 41% Two or more races 18% Asian 4% Black 3% Native American 3%
- Hispanic origin (detail)
- Mexican 41%
- Common ancestry
- Portuguese 2% Romanian 2% Lithuanian 2%
- Foreign-born
- 18% · Canada, China, Vietnam
- Languages at home
- 65% English-only · Spanish 30% Chinese 1% Vietnamese 1%
Political lean MEDSL · Pima
- 2024 margin
- D (+15.2) · D 57.0% · R 41.8% · Other 1.2%
- 2008→2024 swing
- +9.1pp toward D · 2008: 6.1pp · 2024: 15.2pp
- All cycles
- 2024: D+15.2 2020: D+18.7 2016: D+13.5 2012: D+5.8 2008: D+6.1
Not yet ingested
- Civics
- —
Market trends
- HPI YoY
- ▼ -163.31%
- Current HPI
- 283.0647
- Rent YoY
- ▲ 0.30%
- Metro
- Tucson, AZ
- State GDP YoY
- ▲ 4.54%
- F500 in state
- 20
Industry mix (Fortune 500 HQ in AZ)
| Industry | F500 HQs | Revenue |
|---|---|---|
| Technology | 2 | $13B |
|
||
| Mining / Metals | 1 | $23B |
|
||
| Environmental Services | 1 | $16B |
|
||
| Metals / Steel | 1 | $14B |
|
||
| Technology Distribution | 1 | $9B |
|
||
| Homebuilding | 1 | $8B |
|
||
Price history
+44.2% since first listed13 events — show timeline
- 2026-01-22 Price Changed $99,000 MLSSAZ
- 2025-10-20 Listed $124,999 MLSSAZ
- 2023-04-14 Listing Removed — ARMLS
- 2023-03-29 Listing Removed — ARMLS
- 2023-03-11 Price Changed $49,900 ARMLS
- 2023-02-13 Relisted — ARMLS
- 2023-02-03 Pending — ARMLS
- 2023-02-01 Price Changed $56,000 ARMLS
- 2023-01-23 Listed $52,000 ARMLS
- 2023-01-09 Listed $56,500 ARMLS
- 2019-08-14 Sold (Public Records) $18,500,000 Public Records
- 2019-03-11 Listing Removed — MLSSAZ
- 2019-01-09 Listed $68,655 MLSSAZ
Property tax history
+2.1%/yrLatest (2025): $15,595 · +4.4% YoY. Source: county tax records.
Cash-flow waterfall
monthlySold comps — $/sqft
last 12 mo · ≤1 miLoading sold comps…