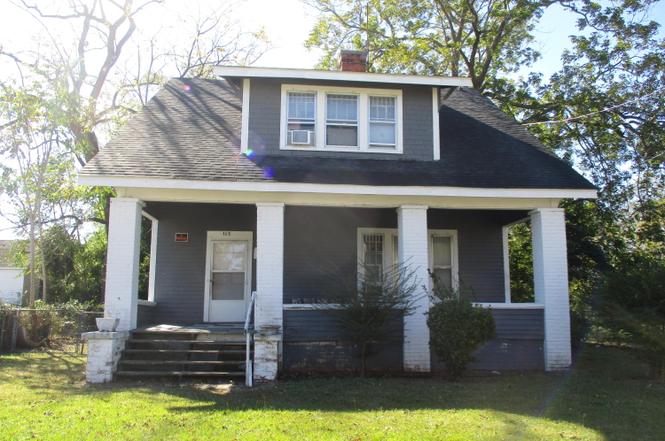
113 E Bright St · Kinston, NC
Flood risk 1/10 · Minimal
- FEMA flood zone
- X (unshaded)
- Chance of flooding over 30 yrs
- 0.0%
- Est. flood insurance / yr
- $507 – $1,088
Fire risk 2/10 · Minimal
- Est. fire insurance / yr
- $906 – $1,684
Heat risk 8/10 · Major
- Hot days now (above 105°F)
- 7 days/yr
- Hot days in 30 yrs
- 18 days/yr
Wind risk 8/10 · Major
- Chance of severe wind over 30 yrs
- 80.0%
Air-quality risk 2/10 · Minimal
- Unhealthy air days now
- 2 days/yr
- Unhealthy air days in 30 yrs
- 2 days/yr
Risk factors via First Street. Map © Google.
Why this score? — see what drove the B- grade
The composite is a weighted blend of 9 inputs, each scored 0–100. Each bar is that input's sub-score; the figure is the points it added to the 100-point composite (weight × sub-score).
- Cash flow +30.0/30.0
- 1% rule +10.0/10.0
- DSCR +10.0/10.0
- ARV discount +7.5/15.0
- Livability +2.8/5.0
- Rent growth +2.5/5.0
- Schools +2.5/10.0
- Condition / age +2.5/5.0
- Appreciation +0.0/10.0
$80,000
🖨 Deal sheet 📄 Offer letter ✓ Due diligence
Listing remarks
This is a great opportunity investment with many possibilities and ideal for a large, growing family. Home offers a living room, dining room 5 bedrooms and 2 full baths. Bedroom and bath downstairs creating many guest or elderly parents. Needs some TLC but would make someone a very nice home. Large front porch and huge backyard. Appliances, space heaters and AC units remain at not value. Being sold ''AS IS'' SSELLER NOT MAKING ANY REPAIRS.
Key facts
- Large front porch
- Huge backyard
- 0.31 acre lot
Tags
Property features AI
Finance
- Other: Property type: Residential, Single Family Residence; Lot is approximately 0.31 acres (lot size quoted in source but retained as descriptive); Road frontage on city street and state road; paved road surface
- Financial info: No investor or income/expense details provided
- HOA & community: No HOA information listed
Exterior
- Parking: On-site unpaved parking; No designated garage
- Security: No security features listed
- Utilities: Public water; Public sewer; Natural gas connected; Water connected; Sewer connected
- Home design: Single family residence; Two levels
- Construction: Wood siding frame construction; Composition roof; Block raised foundation; Built as residential single family (year built not specified)
- Exterior features: Covered porch; Porch; Chain link fencing in back yard; No additional exterior features listed
Interior
- Kitchen: No specific kitchen appliances listed
- Bedrooms: 8 total rooms (bedroom count not specified)
- Flooring: Wood flooring
- Bathrooms: 2 full bathrooms
- Heating & cooling: Wall furnace heating; Space heater; Natural gas heating; Wall/window air conditioning units
- Interior features: Unfurnished; Electric water heater
- Laundry & utility: No laundry appliances specified
Neighborhood map
What this means for you Summary
Snapshot
- This is a 6-bed/2.0-bath single-family listed at $80k.
Deal economics
- At list price, monthly cash flow is $762 ($9k/yr) — positive.
- The deal already cash-flows at list — no discount required.
- Meets the 1% rule at list price ($2k rent vs $80k).
- Recommended offer: $70k (12.0% below list) — sets the bar for market timing.
- Cap rate 17.7% vs local median 3.8% in Kinston — top-decile yield for the area; either an underpriced asset or a hidden risk that comps aren't pricing in. Stress-test before assuming the spread holds.
Location & tenants
- Location reads 55/100 on livability (#640 in NC) — a working-class tenant base; expect higher turnover. Strengths: cost of living A+, health & safety A+, housing B+; Watch: crime F, amenities F, commute F.
- Lenoir County Public Schools (rural): math 29% / reading 32% proficiency, ranked #147 of 178 in NC (top 83%) — families likely to look elsewhere, expect single-tenant / working-renter base with shorter leases; 65% free/reduced lunch — lower-income household profile, screen leases tightly.
- Zoned schools: Southeast Elementary (math 8% / reading 17%, grade F, #1,362 of 1,410 statewide, top 97%, 190 students, 97% FRL); Rochelle Middle (math 9% / reading 20%, grade F, #462 of 475 statewide, top 98%, 466 students, 98% FRL); Kinston High (math 22% / reading 37%, grade F, #459 of 535 statewide, top 87%, 713 students, 100% FRL) — zoned schools average 98% FRL vs 65% district-wide (34 pts higher); higher-poverty schools than district average — tighter screening recommended.
- Market conditions: 95 active listings in the ZIP; 148 units permitted in Lenoir County in 2024 (0 in 5+ unit buildings).
Forward outlook
- Local home prices are declining (-3.0%/yr); year-one equity from $553 of loan paydown is wiped out by about $2k of value loss. Plan a longer hold.
- Lenoir County population projected at -18% by 2050 — secular population decline; favor cash flow + early exit over multi-decade hold.
- At projected returns (-3.0% appreciation + 3.0% rent growth), your $22k cash investment doubles in ~3 years — after that, you're playing with house money.
Negotiation context
- It's been on market 187 days — a 12% lower offer ($70k) is reasonable based on typical stale-listing flexibility.
- 2 sale attempts with the ask held roughly flat each time — persistent listings suggest the price (not the market) is what's stuck; bring a comps-based counter.
Risks & watch-outs
- Watch-outs: built in 1945 — expect roof / HVAC / electrical / plumbing capex.
- Climate carrying-cost: severe wind risk, 80% chance of damaging wind over 30y; extreme-heat days projected 7→18/yr by 2055 (HVAC capex compounding) — expect insurance premiums to compound above CPI over the hold.
Questions for the listing agent
- It's been on market 187 days. Have you received any prior offers? Is the seller open to a 12% concession, seller financing, or rate buy-down credit?
- Built in 1945 — when were the roof, HVAC, electrical panel, plumbing, and water heater last replaced?
- Why hasn't it sold? Are there any deal-killer items the seller is aware of (foundation, flood, title, zoning, code violations)?
- Is there a deadline driving the sale (1031 exchange, divorce, estate, relocation)? That informs how much negotiation room exists.
- Schools are F-rated, which usually means shorter tenancies and higher turnover. Who's the typical renter profile here, and what's been the actual vacancy rate?
- Crime grade is F in this area — have there been break-ins, vandalism, or insurance claims at this property in the last 3 years? What carrier currently insures it and at what premium?
- What's the average days-on-market for RENTAL listings here right now (not sales)? A rising rental-DOM trend means longer vacancies and softer asking-rent achievability than the comps imply.
- What's the recent tenant-quality profile in this submarket — average credit score on applications, eviction rate, late-payment / NSF rate, and stable-employment percentage? A property-management company in the area should have these aggregated.
- How much new for-sale + rental construction is in the pipeline within 1–3 miles? Heavy new supply typically softens prices + rents 12–24 months out; constrained supply supports both.
Investment metrics
- 1% rule
- 2.10% ✓
- Cap rate
- 17.72%
- Cash-on-cash
- 40.82%
- DSCR
- 2.82
- GRM
- 4.0
CMA / ARV
No comps found within radius.
Projected returns pro-forma
-3.0% appreciation · 3.0% rent growth · sell at horizon
- IRR
- 37.3%
- Equity multiple
- 2.59×
- Total profit
- $35,606
- Equity at exit
- $11,928
- IRR
- 43.9%
- Equity multiple
- 5.18×
- Total profit
- $93,643
- Equity at exit
- $6,917
Cash invested: $22,400 (down + closing). Projections, not guarantees.
Landlord ↔ Tenant lean methodology
- Overall (STATE)
- 85 Strongly Landlord-Friendly
- State North Carolina
- 85 Strongly Landlord-Friendly · R+3
- County
- — inherits STATE
- City
- — inherits STATE
ZIP-level market 28501
- Home prices YoY
- -18.9%
- Active inventory
- 95
- Price-to-rent
- 4.0×
Monthly cashflow live
- Estimated rent
- $1,684 medium interval (Pro) →
- Mortgage (P&I)
- −$420
- Tax from tax record
- −$115 /mo · $1,384/yr
- Insurance
- −$33
- HOA
- −$0
- Vacancy / Maint / Mgmt
- −$354
- Net cashflow
- $762
Break-even live
UW: 25.0% down · 7.5% · 30yr · 1.5% tax · 5.0% vac · 8.0% maint · 8.0% mgmt
Financing live
Cash to close
- Down payment
- $20,000
- Closing costs
- $2,400
- Reserves months
- —
- Total cash needed
- —
Loan-product check · same deal, 3 products live
Conventional
25% down · 7.5% · 30yr
- Down + closing
- —
- Monthly P&I
- —
- Monthly cashflow
- —
- DSCR
- —
- Eligible?
- —
Personal DTI + credit; lowest rate.
DSCR
20% down · 8.5% · 30yr
- Down + closing
- —
- Monthly P&I
- —
- Monthly cashflow
- —
- DSCR
- —
- Eligible?
- —
No personal income docs; deal must DSCR.
Hard money
10% down · 12.0% · 12mo
- Down + closing
- —
- Monthly P&I
- —
- Monthly cashflow
- —
- DSCR
- —
- Eligible?
- —
Short-term bridge; refi at stabilization.
Listing history 4 events
-
2026-05-06status Pending
-
2026-04-18status Active
-
2026-04-17historical
-
2025-10-29$80,000 Active
ⓘ Source: listings_history table (triggers on properties + properties_extension) + one-shot
backfill from property_details.listing_events for pre-trigger history.
Tax reassessment forecast NC · Resets to sale price
- Current annual tax
- $1,384 · $115/mo
- Projected year-2 tax
- $1,384 · $115/mo
- Expected delta
- $0/yr ($0/mo · 0.0%)
ⓘ Screening estimate from a state-policy table — verify with the county assessor before closing.
Climate risk First Street
- Flood 1/10 Low FEMA zone X (unshaded) · 0% chance over 30 yrs
- Wildfire 2/10 Low
- Heat 8/10 Severe 7 d/yr ≥105°F today · 18 d/yr by 30 yrs out
- Wind 8/10 Severe 80% chance of damaging wind over 30 yrs
- Air quality 2/10 Low 2 unhealthy d/yr today · 2 by 30 yrs out
Nearby sold comps map
Loading sold comps map…
Walkable amenities ~0.75 mi
Loading nearby amenities…
Taxation est. · year 1
- Rental income
- $20,206
- − Mortgage interest
- −$4,481
- − Property taxes
- −$1,384
- − Insurance
- −$400
- − Repairs & maintenance
- −$1,616
- − Management
- −$1,616
- − Depreciation
- −$2,327
- Taxable income
- $8,381
- Est. tax owed @ 24.0%
- −$2,011
- After-tax cash flow
- $7,133/yr
For passive investors: Depreciation is non-cash, so a rental often shows a tax loss while cash-flowing — sheltering income. Rental losses are passive: they offset passive income freely, and up to $25,000/yr can offset ordinary (W-2) income if you actively participate and your MAGI is under $100k (phasing out to $0 by $150k); unused losses carry forward. On sale, claimed depreciation is recaptured at up to 25%, and gains may owe capital-gains tax (a 1031 exchange can defer both). Figures are a year-1 estimate at your 24.0% rate — not tax advice; consult a CPA.
Schools (NCES district)
- District
- Lenoir County Public Schools
- NCES district ID
- 3702610
- Math proficiency
- 29% ▲ 1.00%
- Reading proficiency
- 32% ▼ -4.00%
- Median HH income
- $34,958
- Composite
- 25.17/100
- National rank
- #7515
- State rank
- #147 of 178 in NC
Livability — Kinston
- Score
- 55/100
- State rank
- #640
- US rank
- #23267
Category grades
Schools grade is shown separately in the Schools card above.
Census & demographics
- Census place
- Kinston, NC
- City population
- 20,407
- Population (ZIP)
- 18,112
Population outlook (Lenoir County) Hauer SSP2
- Today (2025)
- 55,002 people
- By 2030
- 53,048 · -3.6%
- By 2040
- 49,041 · -10.8%
- By 2050
- 45,136 · -17.9%
- By 2075
- 36,547 · -33.6%
- By 2100
- 27,731 · -49.6%
Race, ethnicity, and origin ACS 2023
- Neighborhood character
- Majority Black (62%)
- Race & ethnicity
- Black 62% White 26% Two or more races 6% Hispanic / Latino 5%
- Common ancestry
- Serbian 1% Italian 1%
- Foreign-born
- 2% · Canada, China
- Languages at home
- 95% English-only · Spanish 5%
Political lean MEDSL · Lenoir
- 2024 margin
- Lean R (+6.8) · D 46.2% · R 53.0%
- 2008→2024 swing
- -6.7pp toward R · 2008: -0.1pp · 2024: -6.8pp
- All cycles
- 2024: R+6.8 2020: R+3.5 2016: R+6.3 2012: R+1.5 2008: R+0.1
Not yet ingested
- Civics
- —
Market trends
- HPI YoY
- ▼ -45.17%
- Current HPI
- 193.3213
- Rent YoY
- —
- Metro
- —
- State GDP YoY
- ▲ 3.28%
- F500 in state
- 26
Industry mix (Fortune 500 HQ in NC)
| Industry | F500 HQs | Revenue |
|---|---|---|
| Financial Services | 2 | $213B |
|
||
| Retail | 2 | $95B |
|
||
| Industrial Conglomerate | 1 | $38B |
|
||
| Metals / Steel | 1 | $35B |
|
||
| Utilities | 1 | $30B |
|
||
| Industrial Machinery | 1 | $19B |
|
||
Price history
4 events — show timeline
- 2026-05-06 Pending — Hive MLS
- 2026-04-18 Relisted — Hive MLS
- 2026-04-17 Listing Removed — Hive MLS
- 2025-10-29 Listed $80,000 Hive MLS
Property tax history
+14.4%/yrLatest (2025): $1,384 · +671.4% YoY. Source: county tax records.
Cash-flow waterfall
monthlySold comps — $/sqft
last 12 mo · ≤1 miLoading sold comps…