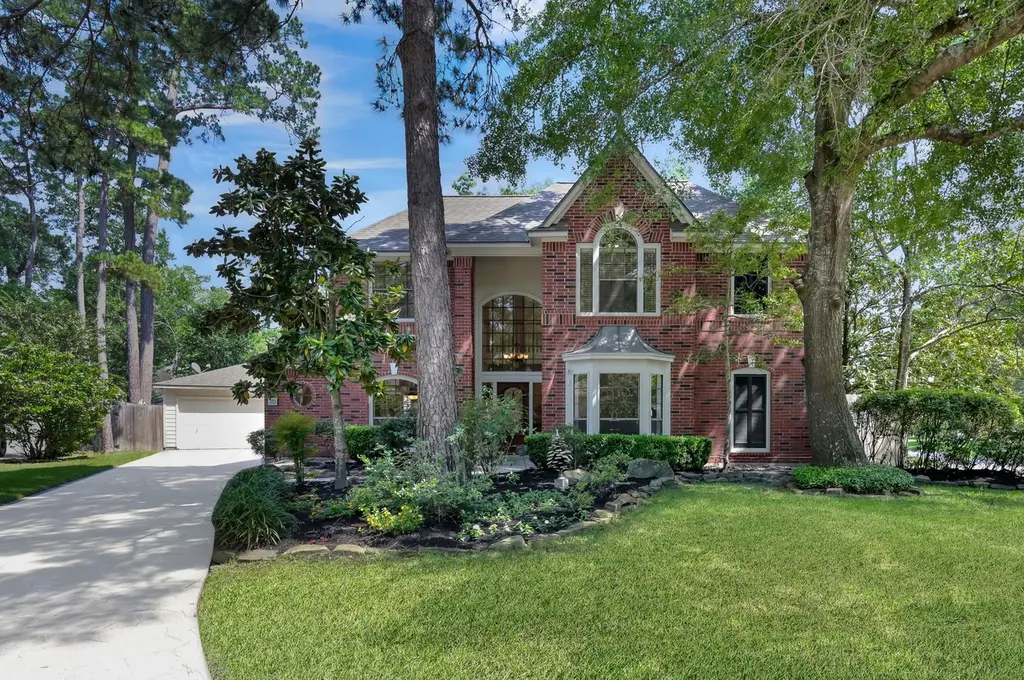
70 Amberglow Ct · The Woodlands, TX
Flood risk 1/10 · Minimal
- FEMA flood zone
- X (unshaded)
- Chance of flooding over 30 yrs
- 0.0%
- Est. flood insurance / yr
- $507 – $1,088
Fire risk 3/10 · Minor
- Est. fire insurance / yr
- $1,222 – $2,270
Heat risk 9/10 · Severe
- Hot days now (above 111°F)
- 7 days/yr
- Hot days in 30 yrs
- 24 days/yr
Wind risk 8/10 · Major
- Chance of severe wind over 30 yrs
- 99.0%
Air-quality risk 3/10 · Minor
- Unhealthy air days now
- 2 days/yr
- Unhealthy air days in 30 yrs
- 3 days/yr
Risk factors via First Street. Map © Google.
Why this score? — see what drove the D grade
The composite is a weighted blend of 9 inputs, each scored 0–100. Each bar is that input's sub-score; the figure is the points it added to the 100-point composite (weight × sub-score).
- Cash flow +11.7/30.0
- ARV discount +7.1/15.0
- Schools +5.1/10.0
- Livability +4.5/5.0
- 1% rule +3.5/10.0
- DSCR +3.5/10.0
- Rent growth +3.0/5.0
- Condition / age +2.5/5.0
- Appreciation +0.0/10.0
$575,000
🖨 Deal sheet 📄 Offer letter ✓ Due diligence
Listing remarks MLS
Come view your new home, Kitchen remodeled, Master bedroom down with remodeled Bath you won't want to leave. Study with built-ins and french doors. All 3 Bedrooms upstairs have walk-in closets. New carpet up, wood floors are from the entry to back of house. Backyard private with seating, plenty of shade tree's, grassy knoll and walkway to the detached garage. Garage has an Oversized extension to put bikes, etc.
Key facts
- 7,701 sq ft lot
- 2 garage spots
- Community pool
Property features AI
Finance
- HOA & community: Community pool
Exterior
- Parking: Detached oversized garage with garage door opener (2 car spaces)
- Security: Owned security system
- Utilities: Public water; Public sewer
- Home design: Residential property; Built in 1991; Slab foundation; Composition roof
- Construction: Brick, cement siding, and wood siding construction; Year built 1991
- Exterior features: Deck; Patio; Fence around backyard; Sprinkler / irrigation; Corner lot in a subdivision; Cul-de-sac lot
Interior
- Kitchen: Double oven; Dishwasher; Electric oven; Gas cooktop; Garbage disposal; Microwave; Pantry
- Bedrooms: Primary bedroom (First level); Bedroom (Second level) — 12 x 10; Bedroom (Second level) — 14 x 11; Bedroom (Second level) — 14 x 11
- Flooring: Carpet; Tile; Wood
- Bathrooms: 2 full bathrooms; 1 half bathroom
- Heating & cooling: Central heating (Gas); Central air conditioning (Electric)
- Interior features: Crown molding; Double vanity; Primary bathroom; Pantry; Tub with shower; Ceiling fans; Gas log fireplace (1)
Neighborhood map
What this means for you Summary
Snapshot
- This is a 4-bed/2.5-bath single-family listed at $575k.
Deal economics
- At list price, monthly cash flow is $-163 ($-2k/yr) — negative.
- To cash-flow at today's rent, offer at most $546k (5.0% below list).
- To meet the 1% rule (rent ≥ 1% of price), the offer needs to be $490k (14.8% below list).
- Recommended offer: $490k (14.8% below list) — sets the bar for 1% rule.
- Cap rate 6.0% vs local median 2.3% in The Woodlands — top-decile yield for the area; either an underpriced asset or a hidden risk that comps aren't pricing in. Stress-test before assuming the spread holds.
Location & tenants
- Location reads 91/100 on livability (#1 in TX, #47 nationally) — a professional / high-income tenant draw. Strengths: amenities A+, commute A+, employment A+; Watch: cost of living D-.
- Conroe ISD (other): math 57% / reading 57% proficiency, ranked #69 of 826 in TX (top 8%) — acceptable for families but not a draw, mixed tenant base, ~2y average lease.
- Zoned schools: Mccullough J H (math 82% / reading 81%, grade A+, #9 of 1,662 statewide, top 1%, 2,178 students, 14% FRL); The Woodlands H S (math 71% / reading 86%, grade A-, #53 of 1,632 statewide, top 3%, 4,361 students, 12% FRL) — zoned schools average 13% FRL vs 34% district-wide (21 pts lower); this property's tenant base skews higher-income than the district average.
- Zoned-school proficiency averages 80% at this address vs 57% district-wide (+23 pts) — the actual schools serving this property are materially stronger than the Conroe ISD average implies; a family-tenant draw the district grade alone would hide.
- Market conditions: Rents rising (+2.1%/yr); 252 active listings in the ZIP; 2 comparable units currently listed for rent nearby; high-income renter base; 13,259 units permitted in Montgomery County in 2024 (1,402 in 5+ unit buildings).
- This rent runs 41% of the median local income ($144k/yr) — at the standard rent-burdened threshold; future hikes will face affordability resistance.
Forward outlook
- Local home prices are declining (-3.0%/yr); year-one equity from $4k of loan paydown is wiped out by about $17k of value loss. Plan a longer hold.
- Montgomery County population projected at +65% by 2050 — long-run rental-demand tailwind backs the buy-and-hold thesis.
Negotiation context
- Only 9 days on market — expect competitive offers; lowballing is unlikely to land.
- 3 sale attempts since 9y ago with the ask held roughly flat each time — persistent listings suggest the price (not the market) is what's stuck; bring a comps-based counter.
Risks & watch-outs
- Climate carrying-cost: severe wind risk, 99% chance of damaging wind over 30y; extreme-heat days projected 7→24/yr by 2055 (HVAC capex compounding) — expect insurance premiums to compound above CPI over the hold.
Questions for the listing agent
- What do current leases actually rent for vs. the listed asking? Can we see a recent rent roll and the last 12 months of T-12 income?
- Is there a deadline driving the sale (1031 exchange, divorce, estate, relocation)? That informs how much negotiation room exists.
- Schools are A-rated — typically a magnet for longer-tenancy family renters. What's the average tenant stay here, and is there a school-zone premium baked into asking?
- The area grade is low — what's the realistic commute time and amenity access for the typical tenant pool here? Any planned neighborhood developments (good or bad) we should know about?
- What's the average days-on-market for RENTAL listings here right now (not sales)? A rising rental-DOM trend means longer vacancies and softer asking-rent achievability than the comps imply.
- What's the recent tenant-quality profile in this submarket — average credit score on applications, eviction rate, late-payment / NSF rate, and stable-employment percentage? A property-management company in the area should have these aggregated.
- How much new for-sale + rental construction is in the pipeline within 1–3 miles? Heavy new supply typically softens prices + rents 12–24 months out; constrained supply supports both.
Investment metrics
- 1% rule
- 0.85% ✗
- Cap rate
- 5.95%
- Cash-on-cash
- -1.22%
- DSCR
- 0.95
- GRM
- 9.8
CMA / ARV
- ARV (median comp)
- $569,933
- List price
- $575,000
- Delta
- 0.89%
- Verdict
- FAIR
- Comps
- 20 within 1.0 mi
Show comp detail 12 sales within ~0.75 mi
| Address | Dist | Beds/Ba | Sqft | Sold | Price | $/sf | Match |
|---|---|---|---|---|---|---|---|
| 70 Amberglow Ct | 0.00mi | 4/2.5 | 2,607 (-12%) | 0mo | $575,000 | $221 | 80 |
| 23 Sparklewood Pl | 0.39mi | 4/2.5 | 2,841 (-4%) | 1mo | $649,999 | $229 | 75 |
| 82 E Coldbrook Cir | 0.16mi | 3/2.5 (-1) | 2,611 (-12%) | 1mo | $619,900 | $237 | 67 |
| 11 Dovewing Pl | 0.75mi | 4/2.5 | 2,882 (-2%) | 0mo | $627,000 | $218 | 61 |
| 55 Pinepath Pl | 0.32mi | 4/2.5 | 2,523 (-15%) | 1mo | $565,000 | $224 | 60 |
| 50 E Greywing Cir | 0.58mi | 4/2.5 | 2,704 (-8%) | 2mo | $495,000 | $183 | 57 |
| 75 N Floral Leaf Cir | 0.37mi | 4/4.0 | 3,325 (+12%) | 2mo | $750,000 | $226 | 54 |
| 52 W Twinberry Pl | 0.64mi | 4/2.5 | 2,660 (-10%) | 1mo | $550,000 | $207 | 53 |
| 46 Indian Summer Pl | 0.60mi | 4/2.5 | 2,631 (-11%) | 1mo | $617,774 | $235 | 52 |
| 59 E Rumplecreek Pl | 0.63mi | 4/2.5 | 2,590 (-12%) | 1mo | $615,000 | $237 | 49 |
| 35 Classic Oaks Pl | 0.58mi | 5/3.5 (+1) | 3,250 (+10%) | 0mo | $795,000 | $245 | 47 |
| 34 Lost Pond Cir | 0.61mi | 4/4.0 | 3,383 (+14%) | 1mo | $915,000 | $270 | 41 |
Match score weights: distance 35% · size 25% · config 20% · recency 20%. Top-matched comps best support the ARV.
Projected returns pro-forma
-3.0% appreciation · 2.09% rent growth · sell at horizon
- IRR
- -19.3%
- Equity multiple
- 0.33×
- Total profit
- $-107,916
- Equity at exit
- $85,734
- IRR
- -14.0%
- Equity multiple
- 0.22×
- Total profit
- $-124,832
- Equity at exit
- $49,715
Cash invested: $161,000 (down + closing). Projections, not guarantees.
Landlord ↔ Tenant lean methodology
- Overall (STATE)
- 87 Strongly Landlord-Friendly
- State Texas
- 87 Strongly Landlord-Friendly · R+5
- County
- — inherits STATE
- City
- — inherits STATE
ZIP-level market 77381
- Home prices YoY
- -31.0%
- Rents YoY
- 2.1%
- Active inventory
- 252
- Price-to-rent
- 9.8×
Monthly cashflow live
- Estimated rent
- $4,899 medium interval (Pro) →
- Mortgage (P&I)
- −$3,015
- Tax from tax record
- −$779 /mo · $9,345/yr
- Insurance
- −$240
- HOA
- −$0
- Vacancy / Maint / Mgmt
- −$1,029
- Net cashflow
- $-163
Break-even live
UW: 25.0% down · 7.5% · 30yr · 1.5% tax · 5.0% vac · 8.0% maint · 8.0% mgmt
Financing live
Cash to close
- Down payment
- $143,750
- Closing costs
- $17,250
- Reserves months
- —
- Total cash needed
- —
Loan-product check · same deal, 3 products live
Conventional
25% down · 7.5% · 30yr
- Down + closing
- —
- Monthly P&I
- —
- Monthly cashflow
- —
- DSCR
- —
- Eligible?
- —
Personal DTI + credit; lowest rate.
DSCR
20% down · 8.5% · 30yr
- Down + closing
- —
- Monthly P&I
- —
- Monthly cashflow
- —
- DSCR
- —
- Eligible?
- —
No personal income docs; deal must DSCR.
Hard money
10% down · 12.0% · 12mo
- Down + closing
- —
- Monthly P&I
- —
- Monthly cashflow
- —
- DSCR
- —
- Eligible?
- —
Short-term bridge; refi at stabilization.
Rent comps 2 comps
| Address | Beds | Baths | Sqft | Rent | $/sqft | DOM | Units | Dist |
|---|---|---|---|---|---|---|---|---|
| 111 S Winterport Cir Spring, TX | 3.0 | 3.0 | 2386 | $2,850 | $1.19 | 43d | 1 | 0.86mi |
| 35 Alden Glen Dr Spring, TX | 5.0 | 3.0 | 2676 | $10,750 | $4.02 | 24d | 1 | 1.13mi |
Listing history 13 events
-
2026-05-10status Pending 1000-char remark
-
2026-05-02$575,000 Active 1000-char remark
-
2026-05-01historical $575,000 1000-char remark
-
2017-05-25soldstatus
-
2017-05-24soldstatus Sold 414-char remark
Show marketing remark (414 chars)
Come view your new home, Kitchen remodeled, Master bedroom down with remodeled Bath you won't want to leave. Study with built-ins and french doors. All 3 Bedrooms upstairs have walk-in closets. New carpet up, wood floors are from the entry to back of house. Backyard private with seating, plenty of shade tree's, grassy knoll and walkway to the detached garage. Garage has an Oversized extension to put bikes, etc.
-
2017-05-03status Pending 414-char remark
Show marketing remark (414 chars)
Come view your new home, Kitchen remodeled, Master bedroom down with remodeled Bath you won't want to leave. Study with built-ins and french doors. All 3 Bedrooms upstairs have walk-in closets. New carpet up, wood floors are from the entry to back of house. Backyard private with seating, plenty of shade tree's, grassy knoll and walkway to the detached garage. Garage has an Oversized extension to put bikes, etc.
-
2017-04-25status Option Pending 414-char remark
Show marketing remark (414 chars)
Come view your new home, Kitchen remodeled, Master bedroom down with remodeled Bath you won't want to leave. Study with built-ins and french doors. All 3 Bedrooms upstairs have walk-in closets. New carpet up, wood floors are from the entry to back of house. Backyard private with seating, plenty of shade tree's, grassy knoll and walkway to the detached garage. Garage has an Oversized extension to put bikes, etc.
-
2017-04-18$351,600 Active 414-char remark
Show marketing remark (414 chars)
Come view your new home, Kitchen remodeled, Master bedroom down with remodeled Bath you won't want to leave. Study with built-ins and french doors. All 3 Bedrooms upstairs have walk-in closets. New carpet up, wood floors are from the entry to back of house. Backyard private with seating, plenty of shade tree's, grassy knoll and walkway to the detached garage. Garage has an Oversized extension to put bikes, etc.
-
2017-04-08historical
-
2017-03-27price $359,900
-
2017-03-06price $374,990
-
2017-02-28$375,990 Active
-
1991-07-03soldstatus
ⓘ Source: listings_history table (triggers on properties + properties_extension) + one-shot
backfill from property_details.listing_events for pre-trigger history.
Tax reassessment forecast TX · Resets to sale price
- Current annual tax
- $9,345 · $779/mo
- Projected year-2 tax
- $10,522 · $877/mo
- Expected delta
- +$1,177/yr (+$98/mo · 12.6%)
ⓘ Screening estimate from a state-policy table — verify with the county assessor before closing.
Climate risk First Street
- Flood 1/10 Low FEMA zone X (unshaded) · 0% chance over 30 yrs
- Wildfire 3/10 Moderate
- Heat 9/10 Extreme 7 d/yr ≥111°F today · 24 d/yr by 30 yrs out
- Wind 8/10 Severe 99% chance of damaging wind over 30 yrs
- Air quality 3/10 Moderate 2 unhealthy d/yr today · 3 by 30 yrs out
Nearby sold comps map
Loading sold comps map…
Walkable amenities ~0.75 mi
Loading nearby amenities…
Taxation est. · year 1
- Rental income
- $58,790
- − Mortgage interest
- −$32,209
- − Property taxes
- −$9,345
- − Insurance
- −$2,875
- − Repairs & maintenance
- −$4,703
- − Management
- −$4,703
- − Depreciation
- −$16,727
- Taxable loss
- −$11,773
- Est. tax savings @ 24.0%
- +$2,826
- After-tax cash flow
- $865/yr
For passive investors: Depreciation is non-cash, so a rental often shows a tax loss while cash-flowing — sheltering income. Rental losses are passive: they offset passive income freely, and up to $25,000/yr can offset ordinary (W-2) income if you actively participate and your MAGI is under $100k (phasing out to $0 by $150k); unused losses carry forward. On sale, claimed depreciation is recaptured at up to 25%, and gains may owe capital-gains tax (a 1031 exchange can defer both). Figures are a year-1 estimate at your 24.0% rate — not tax advice; consult a CPA.
Schools (NCES district)
- District
- Conroe ISD
- NCES district ID
- 4815000
- Math proficiency
- 57% ▼ -6.00%
- Reading proficiency
- 57% ▼ -1.00%
- Median HH income
- $71,541
- Composite
- 50.65/100
- National rank
- #1833
- State rank
- #69 of 826 in TX
Livability — The Woodlands
- Score
- 91/100
- State rank
- #1
- US rank
- #47
Category grades
Schools grade is shown separately in the Schools card above.
Census & demographics
- Census place
- The Woodlands, TX
- County
- Montgomery County · 663,713 people
- City population
- 106,505
- Metro
- Houston-The Woodlands-Sugar Land, TX
- Population (ZIP)
- 36,139
- Household income
- $143,565
- Rent vs Own
- Severe rent burden
- 530.0
Population outlook (Montgomery County) Hauer SSP2
- Today (2025)
- 713,896 people
- By 2030
- 805,263 · +12.8%
- By 2040
- 992,708 · +39.1%
- By 2050
- 1,179,590 · +65.2%
- By 2075
- 1,628,084 · +128.1%
- By 2100
- 1,937,880 · +171.5%
Race, ethnicity, and origin ACS 2023
- Neighborhood character
- Predominantly White (73%)
- Race & ethnicity
- White 73% Hispanic / Latino 16% Two or more races 11% Asian 5% Black 2%
- Hispanic origin (detail)
- Mexican 8%
- Common ancestry
- Italian 4% Lithuanian 3% Serbian 3%
- Foreign-born
- 18% · Canada, China, Dominican Republic
- Languages at home
- 81% English-only · Spanish 11% Other Indo-European 2% Chinese 2%
Political lean MEDSL · Montgomery
- 2024 margin
- Solid R (+45.5) · D 26.8% · R 72.3%
- 2008→2024 swing
- +7.2pp toward D · 2008: -52.7pp · 2024: -45.5pp
- All cycles
- 2024: R+45.5 2020: R+43.8 2016: R+51.4 2012: R+60.7 2008: R+52.7
Not yet ingested
- Civics
- —
Market trends
- HPI YoY
- ▼ -122.06%
- Current HPI
- 271.7165
- Rent YoY
- ▲ 2.09%
- Metro
- Houston-The Woodlands-Sugar Land, TX
- State GDP YoY
- ▲ 3.95%
- F500 in state
- 110
Industry mix (Fortune 500 HQ in TX)
| Industry | F500 HQs | Revenue |
|---|---|---|
| Energy | 16 | $1,198B |
|
||
| Technology | 5 | $198B |
|
||
| Engineering / Construction | 4 | $72B |
|
||
| Energy Services | 3 | $60B |
|
||
| Utilities | 3 | $41B |
|
||
| Healthcare | 2 | $330B |
|
||
Price history
+52.9% since first listed14 events — show timeline
- 2026-06-04 Sold (MLS) — HARMLS
- 2026-05-10 Pending — HARMLS
- 2026-05-02 Listed $575,000 HARMLS
- 2026-05-01 Coming Soon $575,000 HARMLS
- 2017-05-25 Sold (Public Records) — Public Records
- 2017-05-24 Sold (MLS) — HARMLS
- 2017-05-03 Pending — HARMLS
- 2017-04-25 Pending — HARMLS
- 2017-04-18 Listed $351,600 HARMLS
- 2017-04-08 Listing Removed — HARMLS
- 2017-03-27 Price Changed $359,900 HARMLS
- 2017-03-06 Price Changed $374,990 HARMLS
- 2017-02-28 Listed $375,990 HARMLS
- 1991-07-03 Sold (Public Records) — Public Records
Property tax history
+4.7%/yrLatest (2025): $9,345 · +9.0% YoY. Source: county tax records.
Cash-flow waterfall
monthlySold comps — $/sqft
last 12 mo · ≤1 miLoading sold comps…