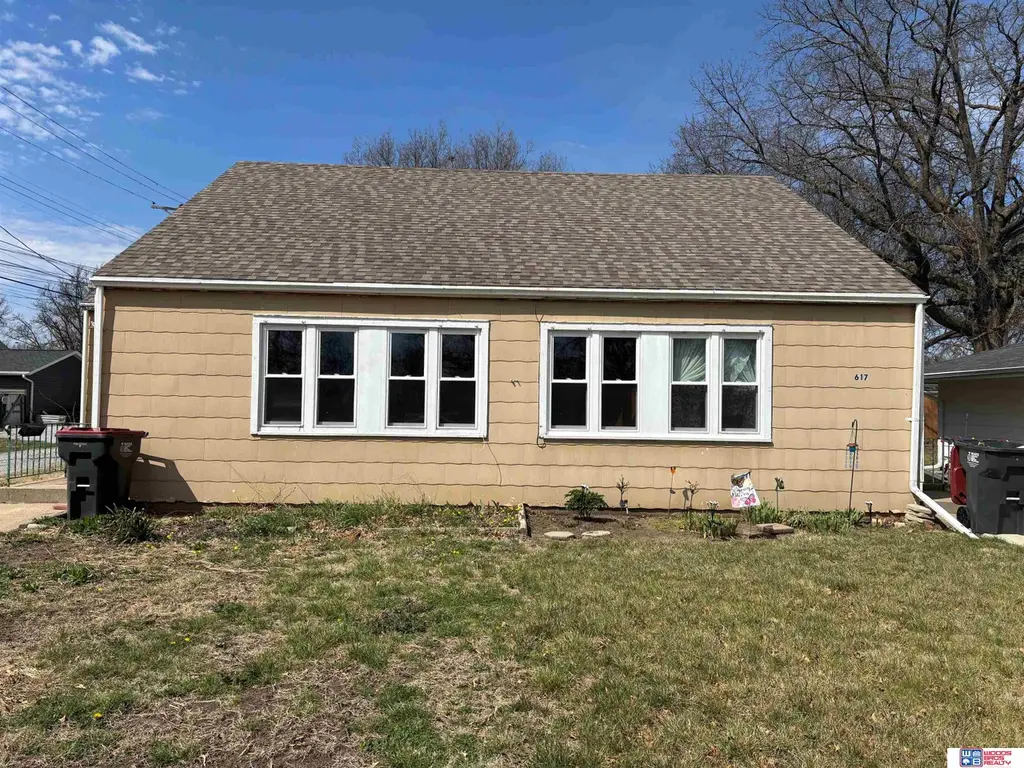
615-617 N 17th St · Beatrice, NE
Flood risk 1/10 · Minimal
- FEMA flood zone
- X (unshaded)
- Chance of flooding over 30 yrs
- 0.0%
- Est. flood insurance / yr
- $473 – $860
Fire risk 4/10 · Minor
- Est. fire insurance / yr
- $1,161 – $2,155
Heat risk 3/10 · Minor
- Hot days now (above 105°F)
- 7 days/yr
- Hot days in 30 yrs
- 16 days/yr
Wind risk 2/10 · Minimal
- Chance of severe wind over 30 yrs
- —
Air-quality risk 1/10 · Minimal
- Unhealthy air days now
- 0 days/yr
- Unhealthy air days in 30 yrs
- 0 days/yr
Risk factors via First Street. Map © Google.
Why this score? — see what drove the B grade
The composite is a weighted blend of 9 inputs, each scored 0–100. Each bar is that input's sub-score; the figure is the points it added to the 100-point composite (weight × sub-score).
- Cash flow +29.1/30.0
- ARV discount +15.0/15.0
- DSCR +10.0/10.0
- 1% rule +6.8/10.0
- Livability +4.0/5.0
- Schools +3.6/10.0
- Rent growth +2.5/5.0
- Condition / age +2.5/5.0
- Appreciation +0.0/10.0
$129,999
🖨 Deal sheet (PDF) 📄 Offer letter ✓ Due diligence
Listing remarks MLS
Great Investment Opportunity! Each unit has 2 bedrooms, 1 bath and built-in 1-car garage. New furnaces in each unit. Seller is ready to sell - Bring an offer.
Key facts
- Built-in garage
- New furnaces
- 8,550 sq ft lot
Tags
Neighborhood map
What this means for you Summary
Snapshot
- This is a 4-bed/2.0-bath single-family listed at $130k.
Deal economics
- At list price, monthly cash flow is $449 ($5k/yr) — positive.
- The deal already cash-flows at list — no discount required.
- Meets the 1% rule at list price ($2k rent vs $130k).
- Recommended offer: $122k (6.0% below list) — sets the bar for market timing.
- Cap rate 10.4% vs local median 4.7% in Beatrice — top-decile yield for the area; either an underpriced asset or a hidden risk that comps aren't pricing in. Stress-test before assuming the spread holds.
Location & tenants
- Location reads 80/100 on livability (#21 in NE, #1,637 nationally) — a professional / high-income tenant draw. Strengths: crime A+, cost of living A+, housing A+; Watch: schools C-, employment D+, commute F.
- Beatrice Public Schools (town): math 40% / reading 44% proficiency, ranked #92 of 111 in NE (top 83%) — families likely to look elsewhere, expect single-tenant / working-renter base with shorter leases.
- Market conditions: 112 active listings in the ZIP; 1 comparable units currently listed for rent nearby; 41 units permitted in Gage County in 2024 (14 in 5+ unit buildings).
- This rent runs 30% of the median local income ($61k/yr) — at the standard rent-burdened threshold; future hikes will face affordability resistance.
Forward outlook
- Local home prices are declining (-3.0%/yr); year-one equity from $899 of loan paydown is wiped out by about $4k of value loss. Plan a longer hold.
- Gage County population projected at -15% by 2050 — secular population decline; favor cash flow + early exit over multi-decade hold.
- At projected returns (-3.0% appreciation + 3.0% rent growth), your $36k cash investment doubles in ~8 years — after that, you're playing with house money.
Negotiation context
- It's been on market 71 days — a 6% lower offer ($122k) is reasonable based on typical stale-listing flexibility.
- 2 sale attempts; this cycle's ask has dropped $10k (7%) from the opening price — seller is motivated, your offer sets the floor, not the list.
Risks & watch-outs
- Watch-outs: built in 1940 — expect roof / HVAC / electrical / plumbing capex.
Questions for the listing agent
- It's been on market 71 days. Have you received any prior offers? Is the seller open to a 6% concession, seller financing, or rate buy-down credit?
- Built in 1940 — when were the roof, HVAC, electrical panel, plumbing, and water heater last replaced?
- Why hasn't it sold? Are there any deal-killer items the seller is aware of (foundation, flood, title, zoning, code violations)?
- Is there a deadline driving the sale (1031 exchange, divorce, estate, relocation)? That informs how much negotiation room exists.
- What's the average days-on-market for RENTAL listings here right now (not sales)? A rising rental-DOM trend means longer vacancies and softer asking-rent achievability than the comps imply.
- What's the recent tenant-quality profile in this submarket — average credit score on applications, eviction rate, late-payment / NSF rate, and stable-employment percentage? A property-management company in the area should have these aggregated.
- How much new for-sale + rental construction is in the pipeline within 1–3 miles? Heavy new supply typically softens prices + rents 12–24 months out; constrained supply supports both.
Investment metrics
- 1% rule
- 1.18% ✓
- Cap rate
- 10.44%
- Cash-on-cash
- 14.81%
- DSCR
- 1.66
- GRM
- 7.1
CMA / ARV
- ARV (median comp)
- $180,549
- List price
- $129,999
- Delta
- -28.00%
- Verdict
- UNDERPRICED
- Comps
- 6 within 1.0 mi
Show comp detail 12 sales within ~0.75 mi
| Address | Dist | Beds/Ba | Sqft | Sold | Price | $/sf | Match |
|---|---|---|---|---|---|---|---|
| 1419 Grant St | 0.24mi | 4/2.0 | 1,456 (-6%) | 3mo | $79,000 | $54 | 75 |
| 1536 Market St | 0.51mi | 4/2.0 | 1,612 (+4%) | 3mo | $188,000 | $117 | 68 |
| 1520 High St | 0.23mi | 4/2.0 | 1,738 (+12%) | 4mo | $220,000 | $127 | 67 |
| 915 N 20th St | 0.31mi | 3/1.5 (-1) | 1,482 (-5%) | 5mo | $208,000 | $140 | 66 |
| 1106 N 8 St | 0.73mi | 3/1.5 (-1) | 1,528 (-2%) | 1mo | $230,000 | $151 | 56 |
| 1912 Park St | 0.64mi | 3/2.0 (-1) | 1,656 (+6%) | 8mo | $204,000 | $123 | 48 |
| 1509 N 19th St | 0.66mi | 4/3.0 | 1,408 (-10%) | 4mo | $275,000 | $195 | 46 |
| 1101 N 8th St | 0.75mi | 4/2.0 | 1,694 (+9%) | 6mo | $170,000 | $100 | 46 |
| 819 Lincoln St | 0.60mi | 3/1.5 (-1) | 1,372 (-12%) | 2mo | $136,500 | $99 | 44 |
| 1223 Market St | 0.61mi | 3/2.0 (-1) | 1,328 (-15%) | 2mo | $140,000 | $105 | 40 |
| 1908 Park St | 0.64mi | 3/1.5 (-1) | 1,344 (-14%) | 9mo | $139,900 | $104 | 33 |
| 1607 N 18th St | 0.73mi | 3/1.5 (-1) | 1,736 (+12%) | 9mo | $210,000 | $121 | 32 |
Match score weights: distance 35% · size 25% · config 20% · recency 20%. Top-matched comps best support the ARV.
Projected returns pro-forma
-3.0% appreciation · 3.0% rent growth · sell at horizon
- IRR
- 5.3%
- Equity multiple
- 1.21×
- Total profit
- $7,480
- Equity at exit
- $19,383
- IRR
- 14.7%
- Equity multiple
- 2.18×
- Total profit
- $43,102
- Equity at exit
- $11,240
Cash invested: $36,400 (down + closing). Projections, not guarantees.
Landlord ↔ Tenant lean methodology
- Overall (STATE)
- 83 Strongly Landlord-Friendly
- State Nebraska
- 83 Strongly Landlord-Friendly · R+13
- County
- — inherits STATE
- City
- — inherits STATE
ZIP-level market 68310
- Home prices YoY
- -26.8%
- Active inventory
- 112
- Price-to-rent
- 7.1×
Monthly cashflow live
- Estimated rent
- $1,533 medium interval (Pro) →
- Mortgage (P&I)
- −$682
- Tax from tax record
- −$26 /mo · $315/yr
- Insurance
- −$54
- HOA
- −$0
- Vacancy / Maint / Mgmt
- −$322
- Net cashflow
- $449
Break-even live
Sensitivity live
| Price | -10% $523 | -5% $486 | +0% $449 | +5% $412 | +10% $376 |
|---|---|---|---|---|---|
| Rent | -10% $328 | -5% $389 | +0% $449 | +5% $510 | +10% $570 |
| Rate | -1.0pp $515 | -0.5pp $482 | base $449 | +0.5pp $415 | +1.0pp $381 |
UW: 25.0% down · 7.5% · 30yr · 1.5% tax · 5.0% vac · 8.0% maint · 8.0% mgmt
Financing live
Cash to close
- Down payment
- $32,500
- Closing costs
- $3,900
- Reserves months
- —
- Total cash needed
- —
Loan-product check · same deal, 3 products live
Conventional
25% down · 7.5% · 30yr
- Down + closing
- —
- Monthly P&I
- —
- Monthly cashflow
- —
- DSCR
- —
- Eligible?
- —
Personal DTI + credit; lowest rate.
DSCR
20% down · 8.5% · 30yr
- Down + closing
- —
- Monthly P&I
- —
- Monthly cashflow
- —
- DSCR
- —
- Eligible?
- —
No personal income docs; deal must DSCR.
Hard money
10% down · 12.0% · 12mo
- Down + closing
- —
- Monthly P&I
- —
- Monthly cashflow
- —
- DSCR
- —
- Eligible?
- —
Short-term bridge; refi at stabilization.
Rent comps 1 comps
| Address | Beds | Baths | Sqft | Rent | $/sqft | DOM | Units | Dist |
|---|---|---|---|---|---|---|---|---|
| 1215 N 10th St Beatrice, NE | 3.0 | 2.0 | 1464 | $1,500 | $1.02 | 44d | 1 | 0.68mi |
Listing history 18 events
-
2026-06-19days on market $129,999 Active 71 DOM
-
2026-06-18days on market $129,999 Active 70 DOM
-
2026-06-17days on market $129,999 Active 69 DOM
-
2026-06-16days on market $129,999 Active 68 DOM
-
2026-06-15days on market $129,999 Active 67 DOM
-
2026-06-14days on market $129,999 Active 65 DOM
-
2026-06-12days on market $129,999 Active 64 DOM
-
2026-06-09days on market $129,999 Active 61 DOM
-
2026-06-08days on market $129,999 Active 60 DOM
-
2026-06-07days on market $129,999 Active 59 DOM
-
2026-06-04days on market $129,999 Active 55 DOM
-
2026-06-02days on market $129,999 Active 54 DOM
-
2026-06-01days on market $129,999 Active 53 DOM
-
2026-05-31days on market $129,999 Active 52 DOM
-
2026-05-31days on market $129,999 Active 51 DOM
-
2026-04-08$140,000 New 158-char remark
Show marketing remark (158 chars)
Great Investment Opportunity! Each unit has 2 bedrooms, 1 bath and built-in 1-car garage. New furnaces in each unit. Seller is ready to sell - Bring an offer.
-
2025-09-26historical
-
2025-06-25$149,000 New
ⓘ Source: listings_history table (triggers on properties + properties_extension) + one-shot
backfill from property_details.listing_events for pre-trigger history.
Tax reassessment forecast NE · Resets to sale price
- Current annual tax
- $315 · $26/mo
- Projected year-2 tax
- $2,249 · $187/mo
- Expected delta
- +$1,934/yr (+$161/mo · 612.9%)
ⓘ Screening estimate from a state-policy table — verify with the county assessor before closing.
Climate risk First Street
- Flood 1/10 Low FEMA zone X (unshaded) · 0% chance over 30 yrs
- Wildfire 4/10 Moderate
- Heat 3/10 Moderate 7 d/yr ≥105°F today · 16 d/yr by 30 yrs out
- Wind 2/10 Low
- Air quality 1/10 Low 0 unhealthy d/yr today · 0 by 30 yrs out
Nearby sold comps map
Loading sold comps map…
Walkable amenities ~0.75 mi
Loading nearby amenities…
Taxation est. · year 1
- Rental income
- $18,400
- − Mortgage interest
- −$7,282
- − Property taxes
- −$315
- − Insurance
- −$650
- − Repairs & maintenance
- −$1,472
- − Management
- −$1,472
- − Depreciation
- −$3,782
- Taxable income
- $3,427
- Est. tax owed @ 24.0%
- −$822
- After-tax cash flow
- $4,567/yr
For passive investors: Depreciation is non-cash, so a rental often shows a tax loss while cash-flowing — sheltering income. Rental losses are passive: they offset passive income freely, and up to $25,000/yr can offset ordinary (W-2) income if you actively participate and your MAGI is under $100k (phasing out to $0 by $150k); unused losses carry forward. On sale, claimed depreciation is recaptured at up to 25%, and gains may owe capital-gains tax (a 1031 exchange can defer both). Figures are a year-1 estimate at your 24.0% rate — not tax advice; consult a CPA.
Schools (NCES district)
- District
- Beatrice Public Schools
- NCES district ID
- 3103600
- Math proficiency
- 40% ▼ -12.00%
- Reading proficiency
- 44% ▼ -6.00%
- Median HH income
- $44,020
- Composite
- 35.57/100
- National rank
- #4899
- State rank
- #92 of 111 in NE
Livability — Beatrice
- Score
- 80/100
- State rank
- #21
- US rank
- #1637
Category grades
Schools grade is shown separately in the Schools card above.
Census & demographics
- Census place
- Beatrice, NE
- County
- Gage County · 14,093 people
- City population
- 14,093
- Metro
- Beatrice, NE
- Population (ZIP)
- 14,093
- Household income
- $60,928
- Rent vs Own
- Severe rent burden
- 369.0
Population outlook (Gage County) Hauer SSP2
- Today (2025)
- 21,133 people
- By 2030
- 20,629 · -2.4%
- By 2040
- 19,398 · -8.2%
- By 2050
- 18,049 · -14.6%
- By 2075
- 15,504 · -26.6%
- By 2100
- 12,941 · -38.8%
Race, ethnicity, and origin ACS 2023
- Neighborhood character
- Predominantly White (93%)
- Race & ethnicity
- White 93% Hispanic / Latino 3% Two or more races 2%
- Common ancestry
- Iranian 2% Lithuanian 2% Serbian 2%
- Foreign-born
- 2% · Canada, Guatemala, China
- Languages at home
- 96% English-only · Spanish 2% German/W. Germanic 1%
Political lean MEDSL · Gage
- 2024 margin
- Solid R (+39.2) · D 29.7% · R 68.9% · Other 1.4%
- 2008→2024 swing
- -29.8pp toward R · 2008: -9.5pp · 2024: -39.2pp
- All cycles
- 2024: R+39.2 2020: R+36.5 2016: R+34.5 2012: R+16.8 2008: R+9.5
Not yet ingested
- Civics
- —
Market trends
- HPI YoY
- ▼ -89.13%
- Current HPI
- 243.8948
- Rent YoY
- —
- Metro
- Beatrice, NE
- State GDP YoY
- ▲ 0.68%
- F500 in state
- 2
Industry mix (Fortune 500 HQ in NE)
| Industry | F500 HQs | Revenue |
|---|---|---|
| Conglomerate | 1 | $371B |
|
||
Price history
-6.0% since first listed3 events — show timeline
- 2026-04-08 Listed $140,000 GPRMLS
- 2025-09-26 Listing Removed — GPRMLS
- 2025-06-25 Listed $149,000 GPRMLS
Property tax history
-2.4%/yrLatest (2025): $315 · -22.2% YoY. Source: county tax records.
Cash-flow waterfall
monthlySold comps — $/sqft
last 12 mo · ≤1 miLoading sold comps…