 Duplex
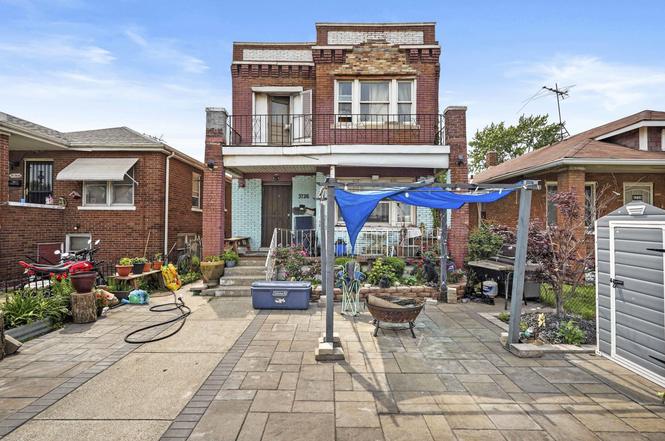
3726 Euclid Ave · East Chicago, IN
Flood risk 1/10 · Minimal
- FEMA flood zone
- X (unshaded)
- Chance of flooding over 30 yrs
- 0.0%
- Est. flood insurance / yr
- $473 – $860
Fire risk 1/10 · Minimal
- Est. fire insurance / yr
- $717 – $1,331
Heat risk 3/10 · Minor
- Hot days now (above 101°F)
- 7 days/yr
- Hot days in 30 yrs
- 15 days/yr
Wind risk 2/10 · Minimal
- Chance of severe wind over 30 yrs
- 0.0%
Air-quality risk 4/10 · Minor
- Unhealthy air days now
- 5 days/yr
- Unhealthy air days in 30 yrs
- 6 days/yr
Risk factors via First Street. Map © Google.
Why this score? — see what drove the B grade
The composite is a weighted blend of 9 inputs, each scored 0–100. Each bar is that input's sub-score; the figure is the points it added to the 100-point composite (weight × sub-score).
- Cash flow +30.0/30.0
- 1% rule +10.0/10.0
- DSCR +10.0/10.0
- ARV discount +7.5/15.0
- Appreciation +4.8/10.0
- Rent growth +4.5/5.0
- Livability +3.2/5.0
- Condition / age +2.5/5.0
- Schools +0.8/10.0
$129,999
🖨 Deal sheet 📄 Offer letter ✓ Due diligence
Multi-family units
County records classify this as Multi-Family (2-4 Unit). Listing-text estimate: 2 units. confirmed
Listing remarks MLS
Nice 2 unit building all brick with 2 detached car garage. Main apartment has living room, kitchen, dining room 2 bedrooms and one bath. 2nd apartment upper level has living room, dining room, kitchen and 3 bedrooms. Owner provides heat and water only. Finished basement with extra rooms.
Key facts
- 3,480 sq ft lot
- 2 garage spots
- Built 1911
Property features AI
Finance
- Financial info: Multi-unit property with 2 total units (tenant-occupied)
Exterior
- Parking: Garage faces rear; On-street parking available; 2 garage spaces
- Security: Smoke detector(s)
- Utilities: Electricity connected; Public water; Public sewer available
- Home design: Two-story property; Built in 1911; Fixer condition
- Construction: Asphalt and shingle roofing
- Exterior features: Front porch and additional porch; Balcony; Aluminum-framed windows; City and rural views; Smoke detectors installed; Garage(s) on property; Asphalt/shingle roof
Interior
- Kitchen: No appliances listed
- Bedrooms: Property contains multiple units: one 2-bedroom unit and two 3-bedroom units
- Flooring: Other flooring
- Bathrooms: Two full bathrooms; One half bathroom
- Heating & cooling: Heating: Other; No cooling system listed
- Interior features: Open floor plan; Partially finished basement with walk-out access and storage space; Pets allowed; 11 total rooms
- Laundry & utility: Laundry located on the lower level
Neighborhood map
What this means for you Summary
Snapshot
- This is a 2 × 2-bed/1.2-bath units multifamily listed at $130k.
Deal economics
- At list price, monthly cash flow is $852 ($10k/yr) — positive. Per door: $426/mo.
- The deal already cash-flows at list — no discount required.
- Meets the 1% rule at list price ($2k rent vs $130k).
- Recommended offer: $114k (12.0% below list) — sets the bar for market timing.
- Cap rate 14.2% vs local median 8.2% in East Chicago — top-decile yield for the area; either an underpriced asset or a hidden risk that comps aren't pricing in. Stress-test before assuming the spread holds.
Location & tenants
- Location reads 64/100 on livability (#371 in IN) — a middle-class / working-renter tenant base. Strengths: commute A+, cost of living A+, housing A; Watch: health & safety D+, schools F, crime F.
- School City Of East Chicago (suburban): math 7% / reading 15% proficiency, ranked #293 of 301 in IN (top 97%) — low school quality limits family demand, transient renter base, plan for 1-2y turnover; 89% free/reduced lunch — lower-income household profile, screen leases tightly.
- Market conditions: Rents rising fast (+8.1%/yr); 79 active listings in the ZIP; lower-income renter base — watch delinquency; 1,642 units permitted in Lake County in 2024 (14 in 5+ unit buildings).
- At $2,258/mo this rent would consume 64% of the median local household income ($42k/yr) (locally 1227% of renters already pay >50% of income on rent) — very limited rent-growth headroom before tenants either downsize or default.
Forward outlook
- In year one you build about $504 of equity ($899 loan paydown + $-395 appreciation (-0.3% local appreciation)).
- Lake County population projected to shrink 7% by 2050 — rents likely to lag national; underwrite the cash flow, not the appreciation.
- At projected returns (-0.3% appreciation + 8.0% rent growth), your $36k cash investment doubles in ~3 years — after that, you're playing with house money.
Negotiation context
- It's been on market 331 days — a 12% lower offer ($114k) is reasonable based on typical stale-listing flexibility.
- 5 sale attempts since 21y ago; this cycle's ask has dropped $40k (24%) from the opening price — seller is motivated, your offer sets the floor, not the list.
- Current owner paid $20k; list at $130k implies a 550% gain — meaningful room to come down on a strong offer.
Risks & watch-outs
- Watch-outs: built in 1911 — expect roof / HVAC / electrical / plumbing capex.
Questions for the listing agent
- It's been on market 331 days. Have you received any prior offers? Is the seller open to a 12% concession, seller financing, or rate buy-down credit?
- Can we see the unit-by-unit rent roll, current vacancy, and any below-market leases? What's the average tenancy length?
- What capital expenditures (roof, boiler, parking lot, exteriors) have been made in the last 5 years, and what's planned in the next 2?
- Built in 1911 — when were the roof, HVAC, electrical panel, plumbing, and water heater last replaced?
- Why hasn't it sold? Are there any deal-killer items the seller is aware of (foundation, flood, title, zoning, code violations)?
- Is there a deadline driving the sale (1031 exchange, divorce, estate, relocation)? That informs how much negotiation room exists.
- Schools are F-rated, which usually means shorter tenancies and higher turnover. Who's the typical renter profile here, and what's been the actual vacancy rate?
- Crime grade is F in this area — have there been break-ins, vandalism, or insurance claims at this property in the last 3 years? What carrier currently insures it and at what premium?
- What's the average days-on-market for RENTAL listings here right now (not sales)? A rising rental-DOM trend means longer vacancies and softer asking-rent achievability than the comps imply.
- What's the recent tenant-quality profile in this submarket — average credit score on applications, eviction rate, late-payment / NSF rate, and stable-employment percentage? A property-management company in the area should have these aggregated.
- How much new apartment / multifamily construction is in the pipeline within 1–3 miles? Heavy new supply (>2% of stock underway) typically softens rents 12–24 months out; light construction supports rent growth.
Investment metrics
- 1% rule
- 1.74% ✓
- Cap rate
- 14.16%
- Cash-on-cash
- 28.09%
- DSCR
- 2.25
- GRM
- 4.8
CMA / ARV
No comps found within radius.
Projected returns pro-forma
-0.3% appreciation · 8.0% rent growth · sell at horizon
- IRR
- 32.7%
- Equity multiple
- 2.67×
- Total profit
- $60,617
- Equity at exit
- $35,787
- IRR
- 39.3%
- Equity multiple
- 6.28×
- Total profit
- $192,207
- Equity at exit
- $41,483
Cash invested: $36,400 (down + closing). Projections, not guarantees.
Landlord ↔ Tenant lean methodology
- Overall (STATE)
- 90 Strongly Landlord-Friendly
- State Indiana
- 90 Strongly Landlord-Friendly · R+11
- County
- — inherits STATE
- City
- — inherits STATE
ZIP-level market 46312
- Home prices YoY
- -0.1%
- Rents YoY
- 8.1%
- Active inventory
- 79
- Price-to-rent
- 9.6×
Monthly cashflow live
- Estimated rent
- $2,258 high interval (Pro) →
- Mortgage (P&I)
- −$682
- Tax from tax record
- −$196 /mo · $2,349/yr
- Insurance
- −$54
- HOA
- −$0
- Vacancy / Maint / Mgmt
- −$474
- Net cashflow
- $852
Break-even live
2-unit breakdown (identical units grouped — click to expand)
| Units | Beds | Baths | Est. rent |
|---|---|---|---|
| 2× units | 2 | 1.2 | $2,258 |
| #1 | 2 | 1.2 | $1,129 |
| #2 | 2 | 1.2 | $1,129 |
| Total (2 units) | $2,258 | ||
UW: 25.0% down · 7.5% · 30yr · 1.5% tax · 5.0% vac · 8.0% maint · 8.0% mgmt
Financing live
Cash to close
- Down payment
- $32,500
- Closing costs
- $3,900
- Reserves months
- —
- Total cash needed
- —
Loan-product check · same deal, 3 products live
Conventional
25% down · 7.5% · 30yr
- Down + closing
- —
- Monthly P&I
- —
- Monthly cashflow
- —
- DSCR
- —
- Eligible?
- —
Personal DTI + credit; lowest rate.
DSCR
20% down · 8.5% · 30yr
- Down + closing
- —
- Monthly P&I
- —
- Monthly cashflow
- —
- DSCR
- —
- Eligible?
- —
No personal income docs; deal must DSCR.
Hard money
10% down · 12.0% · 12mo
- Down + closing
- —
- Monthly P&I
- —
- Monthly cashflow
- —
- DSCR
- —
- Eligible?
- —
Short-term bridge; refi at stabilization.
Listing history 14 events
-
2026-05-01price $129,999
-
2026-02-27status Active
-
2026-02-13status Pending
-
2025-09-03price $139,999
-
2025-08-13price $150,000
-
2025-07-23price $159,900
-
2025-07-09price $164,900
-
2025-06-18$169,999 Active
-
2015-02-10soldstatus $20,000 288-char remark
Show marketing remark (288 chars)
Nice 2 unit building all brick with 2 detached car garage. Main apartment has living room, kitchen, dining room 2 bedrooms and one bath. 2nd apartment upper level has living room, dining room, kitchen and 3 bedrooms. Owner provides heat and water only. Finished basement with extra rooms.
-
2014-05-29$28,000 288-char remark
Show marketing remark (288 chars)
Nice 2 unit building all brick with 2 detached car garage. Main apartment has living room, kitchen, dining room 2 bedrooms and one bath. 2nd apartment upper level has living room, dining room, kitchen and 3 bedrooms. Owner provides heat and water only. Finished basement with extra rooms.
-
2006-10-18historical
-
2006-04-17$95,000
-
2005-12-14historical
-
2005-09-13$103,000
ⓘ Source: listings_history table (triggers on properties + properties_extension) + one-shot
backfill from property_details.listing_events for pre-trigger history.
Tax reassessment forecast IN · Partial reset (capped growth)
- Current annual tax
- $2,349 · $196/mo
- Projected year-2 tax
- $2,349 · $196/mo
- Expected delta
- $0/yr ($0/mo · 0.0%)
ⓘ Screening estimate from a state-policy table — verify with the county assessor before closing.
Climate risk First Street
- Flood 1/10 Low FEMA zone X (unshaded) · 0% chance over 30 yrs
- Wildfire 1/10 Low
- Heat 3/10 Moderate 7 d/yr ≥101°F today · 15 d/yr by 30 yrs out
- Wind 2/10 Low 0% chance of damaging wind over 30 yrs
- Air quality 4/10 Moderate 5 unhealthy d/yr today · 6 by 30 yrs out
Nearby sold comps map
Loading sold comps map…
Walkable amenities ~0.75 mi
Loading nearby amenities…
Taxation est. · year 1
- Rental income
- $27,096
- − Mortgage interest
- −$7,282
- − Property taxes
- −$2,349
- − Insurance
- −$650
- − Repairs & maintenance
- −$2,168
- − Management
- −$2,168
- − Depreciation
- −$3,782
- Taxable income
- $8,698
- Est. tax owed @ 24.0%
- −$2,087
- After-tax cash flow
- $8,139/yr
For passive investors: Depreciation is non-cash, so a rental often shows a tax loss while cash-flowing — sheltering income. Rental losses are passive: they offset passive income freely, and up to $25,000/yr can offset ordinary (W-2) income if you actively participate and your MAGI is under $100k (phasing out to $0 by $150k); unused losses carry forward. On sale, claimed depreciation is recaptured at up to 25%, and gains may owe capital-gains tax (a 1031 exchange can defer both). Figures are a year-1 estimate at your 24.0% rate — not tax advice; consult a CPA.
Schools (NCES district)
- District
- School City Of East Chicago
- NCES district ID
- 1802880
- Math proficiency
- 7% ▼ -10.00%
- Reading proficiency
- 15% ▼ -7.00%
- Median HH income
- $28,423
- Composite
- 8.36/100
- National rank
- #9909
- State rank
- #293 of 301 in IN
Livability — East Chicago
- Score
- 64/100
- State rank
- #371
- US rank
- #13869
Category grades
Schools grade is shown separately in the Schools card above.
Census & demographics
- Census place
- East Chicago, IN
- County
- Lake County · 422,878 people
- City population
- 26,022
- Metro
- Chicago-Naperville-Elgin, IL-IN-WI
- Population (ZIP)
- 26,022
- Household income
- $42,125
- Rent vs Own
- Severe rent burden
- 1227.0
Population outlook (Lake County) Hauer SSP2
- Today (2025)
- 484,026 people
- By 2030
- 478,091 · -1.2%
- By 2040
- 462,974 · -4.3%
- By 2050
- 449,894 · -7.1%
- By 2075
- 436,169 · -9.9%
- By 2100
- 426,607 · -11.9%
Race, ethnicity, and origin ACS 2023
- Neighborhood character
- Majority Hispanic (56%)
- Race & ethnicity
- Hispanic / Latino 56% Black 36% Two or more races 11% White 7%
- Hispanic origin (detail)
- Mexican 45% Puerto Rican 6%
- Common ancestry
- Romanian 2%
- Foreign-born
- 16% · Canada
- Languages at home
- 59% English-only · Spanish 40%
Political lean MEDSL · Lake
- 2024 margin
- Lean D (+5.6) · D 52.1% · R 46.5% · Other 1.5%
- 2008→2024 swing
- -28.6pp toward R · 2008: 34.3pp · 2024: 5.6pp
- All cycles
- 2024: D+5.6 2020: D+15.1 2016: D+20.6 2012: D+31.0 2008: D+34.3
Not yet ingested
- Civics
- —
Market trends
- HPI YoY
- ▼ -0.30%
- Current HPI
- 267.9232
- Rent YoY
- ▲ 8.06%
- Metro
- Chicago-Naperville-Elgin, IL-IN-WI
- State GDP YoY
- ▲ 2.90%
- F500 in state
- 18
Industry mix (Fortune 500 HQ in IN)
| Industry | F500 HQs | Revenue |
|---|---|---|
| Industrial Machinery | 2 | $37B |
|
||
| Healthcare | 1 | $177B |
|
||
| Pharmaceuticals | 1 | $45B |
|
||
| Metals / Steel | 1 | $18B |
|
||
| Agriculture | 1 | $17B |
|
||
| Packaging | 1 | $12B |
|
||
Price history
+26.2% since first listed14 events — show timeline
- 2026-05-01 Price Changed $129,999 NIRA MLS as Distributed by MLS Grid
- 2026-02-27 Relisted — NIRA MLS as Distributed by MLS Grid
- 2026-02-13 Pending — NIRA MLS as Distributed by MLS Grid
- 2025-09-03 Price Changed $139,999 NIRA MLS as Distributed by MLS Grid
- 2025-08-13 Price Changed $150,000 NIRA MLS as Distributed by MLS Grid
- 2025-07-23 Price Changed $159,900 NIRA MLS as Distributed by MLS Grid
- 2025-07-09 Price Changed $164,900 NIRA MLS as Distributed by MLS Grid
- 2025-06-18 Listed $169,999 NIRA MLS as Distributed by MLS Grid
- 2015-02-10 Sold (MLS) $20,000 NIRA MLS as Distributed by MLS Grid
- 2014-05-29 Listed $28,000 NIRA MLS as Distributed by MLS Grid
- 2006-10-18 Listing Removed — NIRA MLS as Distributed by MLS Grid
- 2006-04-17 Listed $95,000 NIRA MLS as Distributed by MLS Grid
- 2005-12-14 Listing Removed — NIRA MLS as Distributed by MLS Grid
- 2005-09-13 Listed $103,000 NIRA MLS as Distributed by MLS Grid
Property tax history
+11.8%/yrLatest (2024): $2,349 · +10.2% YoY. Source: county tax records.
Cash-flow waterfall
monthlySold comps — $/sqft
last 12 mo · ≤1 miLoading sold comps…