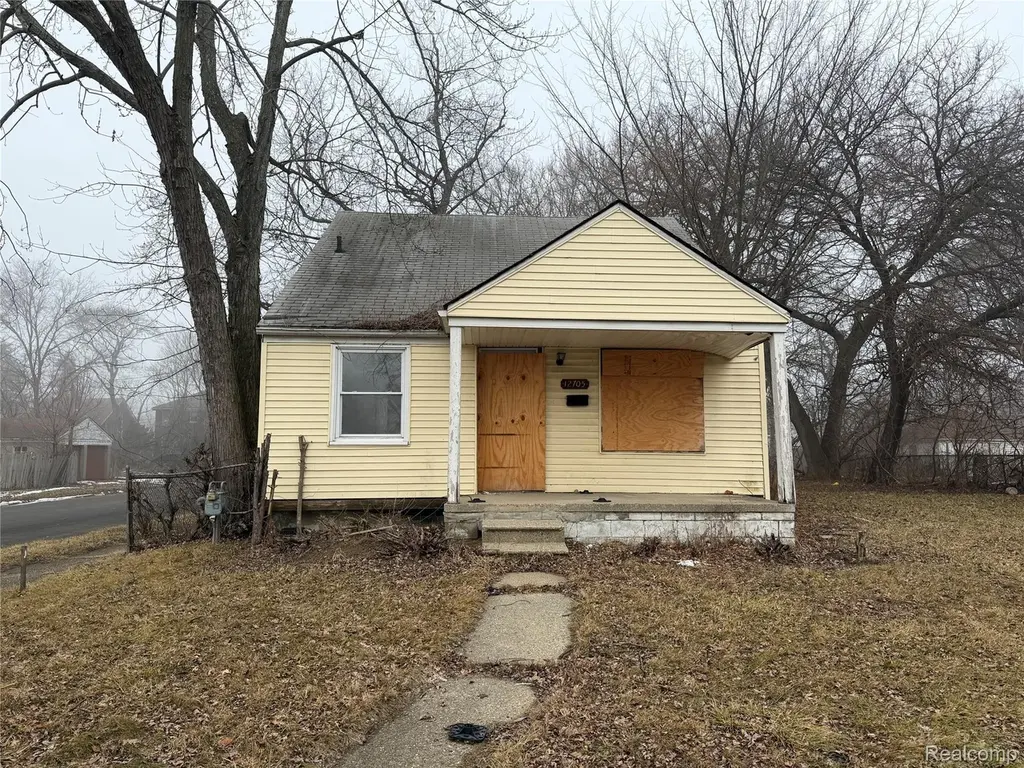
12705 Flanders St · Detroit, MI
Flood risk 1/10 · Minimal
- FEMA flood zone
- X (unshaded)
- Chance of flooding over 30 yrs
- 0.0%
- Est. flood insurance / yr
- $473 – $860
Fire risk 1/10 · Minimal
- Est. fire insurance / yr
- $784 – $1,456
Heat risk 3/10 · Minor
- Hot days now (above 96°F)
- 7 days/yr
- Hot days in 30 yrs
- 14 days/yr
Wind risk 2/10 · Minimal
- Chance of severe wind over 30 yrs
- —
Air-quality risk 3/10 · Minor
- Unhealthy air days now
- 2 days/yr
- Unhealthy air days in 30 yrs
- 5 days/yr
Risk factors via First Street. Map © Google.
Why this score? — see what drove the C- grade
The composite is a weighted blend of 9 inputs, each scored 0–100. Each bar is that input's sub-score; the figure is the points it added to the 100-point composite (weight × sub-score).
- Cash flow +15.0/30.0
- ARV discount +15.0/15.0
- 1% rule +5.0/10.0
- DSCR +5.0/10.0
- Livability +3.7/5.0
- Rent growth +2.8/5.0
- Condition / age +2.5/5.0
- Schools +1.3/10.0
- Appreciation +0.0/10.0
$27,400
🖨 Deal sheet (PDF) 📄 Offer letter ✓ Due diligence
Listing remarks MLS
Welcome to 12705 Flanders St in Detroit's Eden Gardens neighborhood! This 3-bedroom, 1-bath home has about 1,020 square feet of living space and was built in 1952. It's a solid house with good bones and plenty of potential for someone ready to make it their own. There's a detached 1-car garage and a nice-sized yard, plus a basement that offers extra storage or space to finish down the road. The layout is practical and easy to work with, whether you're looking to move in and update over time or take on a renovation project. Located on a residential block close to schools, parks, and everyday conveniences, this home is a great option for an investor or a buyer looking for an affordable place with room to add value. -BATVAI
Key facts
- Extra storage
- Practical layout
- Nice-sized yard
Tags
Neighborhood map
What this means for you Summary
Snapshot
- This is a 3-bed/1.0-bath single-family listed at $27k.
Deal economics
- At list price, monthly cash flow is $861 ($10k/yr) — positive.
- The deal already cash-flows at list — no discount required.
- Meets the 1% rule at list price ($1k rent vs $27k).
- Recommended offer: $25k (9.0% below list) — sets the bar for market timing.
- Cap rate 44.0% vs local median 10.0% in Detroit — top-decile yield for the area; either an underpriced asset or a hidden risk that comps aren't pricing in. Stress-test before assuming the spread holds.
Location & tenants
- Location reads 73/100 on livability (#218 in MI) — a middle-class / working-renter tenant base. Strengths: amenities A+, commute A+, cost of living A+; Watch: schools F, crime F, employment F.
- Detroit Public Schools Community District (urban): math 10% / reading 24% proficiency, ranked #499 of 540 in MI (top 92%) — low school quality limits family demand, transient renter base, plan for 1-2y turnover; 90% free/reduced lunch — lower-income household profile, screen leases tightly.
- Market conditions: Rents rising (+1.3%/yr); 376 active listings in the ZIP; 40 comparable units currently listed for rent nearby; rentals at typical pace (median 19d on market — plan ~3-4 weeks tenant-placement turnaround); lower-income renter base — watch delinquency; 2,639 units permitted in Wayne County in 2024 (1,216 in 5+ unit buildings).
- This rent runs 41% of the median local income ($39k/yr) — at the standard rent-burdened threshold; future hikes will face affordability resistance.
Forward outlook
- Local home prices are declining (-3.0%/yr); year-one equity from $189 of loan paydown is wiped out by about $822 of value loss. Plan a longer hold.
- Wayne County population projected at -17% by 2050 — secular population decline; favor cash flow + early exit over multi-decade hold.
- At projected returns (-3.0% appreciation + 1.3% rent growth), your $8k cash investment doubles in ~1 year — after that, you're playing with house money.
Negotiation context
- It's been on market 111 days — a 9% lower offer ($25k) is reasonable based on typical stale-listing flexibility.
- 2 sale attempts; this cycle's ask has dropped $2k (8%) from the opening price — seller is motivated, your offer sets the floor, not the list.
- Current owner paid $15k; list at $27k implies a 82% gain — meaningful room to come down on a strong offer.
Risks & watch-outs
- Watch-outs: built in 1952 — expect roof / HVAC / electrical / plumbing capex.
Questions for the listing agent
- It's been on market 111 days. Have you received any prior offers? Is the seller open to a 9% concession, seller financing, or rate buy-down credit?
- Built in 1952 — when were the roof, HVAC, electrical panel, plumbing, and water heater last replaced?
- Why hasn't it sold? Are there any deal-killer items the seller is aware of (foundation, flood, title, zoning, code violations)?
- Is there a deadline driving the sale (1031 exchange, divorce, estate, relocation)? That informs how much negotiation room exists.
- Schools are F-rated, which usually means shorter tenancies and higher turnover. Who's the typical renter profile here, and what's been the actual vacancy rate?
- Crime grade is F in this area — have there been break-ins, vandalism, or insurance claims at this property in the last 3 years? What carrier currently insures it and at what premium?
- What's the average days-on-market for RENTAL listings here right now (not sales)? A rising rental-DOM trend means longer vacancies and softer asking-rent achievability than the comps imply.
- What's the recent tenant-quality profile in this submarket — average credit score on applications, eviction rate, late-payment / NSF rate, and stable-employment percentage? A property-management company in the area should have these aggregated.
- How much new for-sale + rental construction is in the pipeline within 1–3 miles? Heavy new supply typically softens prices + rents 12–24 months out; constrained supply supports both.
Investment metrics
- 1% rule
- 4.85% ✓
- Cap rate
- 43.99%
- Cash-on-cash
- 134.62%
- DSCR
- 6.99
- GRM
- 1.7
CMA / ARV
- ARV (median comp)
- $54,764
- List price
- $27,400
- Delta
- -49.97%
- Verdict
- UNDERPRICED
- Comps
- 20 within 1.0 mi
Show comp detail 12 sales within ~0.75 mi
| Address | Dist | Beds/Ba | Sqft | Sold | Price | $/sf | Match |
|---|---|---|---|---|---|---|---|
| 13302 Jane St | 0.32mi | 3/1.0 | 1,024 (+0%) | 4mo | $37,000 | $36 | 82 |
| 8801 E Outer Dr | 0.31mi | 3/1.5 | 1,047 (+3%) | 1mo | $40,000 | $38 | 78 |
| 12112 Findlay St | 0.45mi | 3/1.0 | 1,026 (+1%) | 1mo | $23,000 | $22 | 77 |
| 8750 E Outer Dr | 0.37mi | 3/1.0 | 1,070 (+5%) | 7mo | $102,000 | $95 | 69 |
| 12000 Findlay St | 0.56mi | 3/1.0 | 1,000 (-2%) | 5mo | $62,500 | $63 | 67 |
| 13124 Flanders St | 0.27mi | 3/2.0 | 1,150 (+13%) | 0mo | $115,000 | $100 | 62 |
| 11566 Sanford St | 0.75mi | 3/1.0 | 1,048 (+3%) | 2mo | $55,000 | $52 | 59 |
| 13001 Promenade St | 0.42mi | 3/1.0 | 1,124 (+10%) | 7mo | $73,800 | $66 | 58 |
| 14493 Kilbourne St | 0.74mi | 3/1.0 | 999 (-2%) | 9mo | $65,000 | $65 | 55 |
| 12019 Sanford St | 0.52mi | 3/1.0 | 1,149 (+13%) | 2mo | $31,500 | $27 | 53 |
| 14275 Young St | 0.75mi | 4/1.5 (+1) | 1,045 (+2%) | 10mo | $118,000 | $113 | 46 |
| 12802 Dresden St | 0.73mi | 3/1.0 | 1,152 (+13%) | 5mo | $25,000 | $22 | 40 |
Match score weights: distance 35% · size 25% · config 20% · recency 20%. Top-matched comps best support the ARV.
Projected returns pro-forma
-3.0% appreciation · 1.33% rent growth · sell at horizon
- IRR
- —
- Equity multiple
- 7.28×
- Total profit
- $48,198
- Equity at exit
- $4,085
- IRR
- —
- Equity multiple
- 14.54×
- Total profit
- $103,917
- Equity at exit
- $2,369
Cash invested: $7,672 (down + closing). Projections, not guarantees.
Landlord ↔ Tenant lean methodology
- Overall (STATE)
- 62 Landlord-Friendly
- State Michigan
- 62 Landlord-Friendly · EVEN
- County
- — inherits STATE
- City
- — inherits STATE
ZIP-level market 48205
- Home prices YoY
- -28.1%
- Rents YoY
- 1.3%
- Active inventory
- 376
- Price-to-rent
- 1.7×
Monthly cashflow live
- Estimated rent
- $1,329 high interval (Pro) →
- Mortgage (P&I)
- −$144
- Tax est. 1.5%
- −$34 /mo · $411/yr
- Insurance
- −$11
- HOA
- −$0
- Vacancy / Maint / Mgmt
- −$279
- Net cashflow
- $861
Break-even live
Sensitivity live
| Price | -10% $880 | -5% $870 | +0% $861 | +5% $851 | +10% $842 |
|---|---|---|---|---|---|
| Rent | -10% $756 | -5% $808 | +0% $861 | +5% $913 | +10% $966 |
| Rate | -1.0pp $874 | -0.5pp $868 | base $861 | +0.5pp $854 | +1.0pp $846 |
UW: 25.0% down · 7.5% · 30yr · 1.5% tax · 5.0% vac · 8.0% maint · 8.0% mgmt
Financing live
Cash to close
- Down payment
- $6,850
- Closing costs
- $822
- Reserves months
- —
- Total cash needed
- —
Loan-product check · same deal, 3 products live
Conventional
25% down · 7.5% · 30yr
- Down + closing
- —
- Monthly P&I
- —
- Monthly cashflow
- —
- DSCR
- —
- Eligible?
- —
Personal DTI + credit; lowest rate.
DSCR
20% down · 8.5% · 30yr
- Down + closing
- —
- Monthly P&I
- —
- Monthly cashflow
- —
- DSCR
- —
- Eligible?
- —
No personal income docs; deal must DSCR.
Hard money
10% down · 12.0% · 12mo
- Down + closing
- —
- Monthly P&I
- —
- Monthly cashflow
- —
- DSCR
- —
- Eligible?
- —
Short-term bridge; refi at stabilization.
Rent comps 40 comps
| Address | Beds | Baths | Sqft | Rent | $/sqft | DOM | Units | Dist |
|---|---|---|---|---|---|---|---|---|
| 12740 August St Detroit, MI | 2.0 | 1.0 | 900 | $1,300 | $1.44 | 6d | 1 | 0.19mi |
| 12840 Kilbourne St Detroit, MI | 3.0 | 1.0 | 1136 | $1,350 | $1.19 | 19d | 1 | 0.28mi |
| 12112 Christy St Unit 12110 Detroit, MI | 2.0 | 1.0 | 950 | $1,200 | $1.26 | 45d | 1 | 0.46mi |
| 12110 Christy St Detroit, MI | 2.0 | 1.5 | 950 | $1,200 | $1.26 | 19d | 1 | 0.46mi |
| 14201 Mayfield St Detroit, MI | 4.0 | 1.5 | 1296 | $1,250 | $0.96 | 45d | 1 | 0.61mi |
| 12051 Wilshire Dr Detroit, MI | 3.0 | 1.5 | 1224 | $1,250 | $1.02 | 19d | 1 | 0.65mi |
| 11765 Glenfield Ave Unit 1510880P Detroit, MI | 2.0 | 1.0 | 990 | $3,102 | $3.13 | 16d | 1 | 0.66mi |
| 12210 Longview St Detroit, MI | 3.0 | 1.0 | 1020 | $1,100 | $1.08 | 45d | 1 | 0.73mi |
| 11785 Nashville St Detroit, MI | 3.0 | 2.0 | 1360 | $1,450 | $1.07 | 5d | 1 | 0.76mi |
| 11760 Nashville St Detroit, MI | 3.0 | 1.0 | 1200 | $1,250 | $1.04 | 19d | 1 | 0.76mi |
| 13137 Elmdale St Detroit, MI | 3.0 | 1.0 | 1115 | $1,400 | $1.26 | 25d | 1 | 0.77mi |
| 13400 Longview St Detroit, MI | 3.0 | 1.5 | 1000 | $1,400 | $1.40 | 45d | 1 | 0.78mi |
| 13218 Greiner St Detroit, MI | 3.0 | 1.0 | 1162 | $1,195 | $1.03 | 19d | 1 | 0.81mi |
| 11700 Engleside St Detroit, MI | 3.0 | 1.0 | 1000 | $1,175 | $1.18 | 45d | 1 | 0.84mi |
| 18119 Joann St Detroit, MI | 2.0 | 1.0 | 800 | $1,100 | $1.38 | 25d | 1 | 0.95mi |
| 17851 Strasburg St Detroit, MI | 3.0 | 1.0 | 1079 | $1,100 | $1.02 | 19d | 1 | 0.99mi |
| 15000 Mayfield St Detroit, MI | 3.0 | 1.0 | 1146 | $970 | $0.85 | 19d | 1 | 1.00mi |
| 17241 Rowe St Detroit, MI | 3.0 | 1.5 | 1316 | $1,450 | $1.10 | 19d | 1 | 1.03mi |
| 15010 Cedargrove St Detroit, MI | 3.0 | 1.5 | 1018 | $1,350 | $1.33 | 45d | 1 | 1.11mi |
| 18624 Fairport St Unit NA Detroit, MI | 3.0 | 1.0 | 924 | $1,450 | $1.57 | 25d | 1 | 1.12mi |
| 18624 Fairport St Detroit, MI | 3.0 | 1.0 | 874 | $1,450 | $1.66 | 23d | 1 | 1.12mi |
| 9190 Hayes St Unit 1 Detroit, MI | 2.0 | 1.0 | 750 | $850 | $1.13 | 16d | 1 | 1.23mi |
| 11074 Kennebec St Detroit, MI | 3.0 | 1.0 | 1200 | $1,350 | $1.12 | 45d | 1 | 1.23mi |
| 18703 Waltham St Detroit, MI | 2.0 | 1.0 | 1000 | $1,100 | $1.10 | 45d | 1 | 1.25mi |
| 18681 Barlow St Detroit, MI | 3.0 | 1.0 | 1041 | $1,400 | $1.34 | 25d | 1 | 1.26mi |
| 10813 Whitehill St Detroit, MI | 3.0 | 1.0 | 1392 | $1,350 | $0.97 | 19d | 1 | 1.29mi |
| 10724 Whitehill St Detroit, MI | 3.0 | 3.0 | 1425 | $1,550 | $1.09 | 19d | 1 | 1.29mi |
| 11513 Greiner St Unit 11521 Greiner Detroit, MI | 2.0 | 1.0 | 942 | $1,050 | $1.11 | 45d | 1 | 1.29mi |
| 15238 Seymour St Detroit, MI | 3.0 | 1.0 | 1064 | $1,300 | $1.22 | 0d | 1 | 1.30mi |
| 9755 Wayburn St Detroit, MI | 3.0 | 2.0 | 1498 | $1,400 | $0.93 | 5d | 1 | 1.32mi |
| 10644 Stratman St Detroit, MI | 2.0 | 1.0 | 1000 | $1,200 | $1.20 | 19d | 1 | 1.35mi |
| 5966 Eastlawn St Unit NA Detroit, MI | 3.0 | 1.5 | 1366 | $1,500 | $1.10 | 25d | 1 | 1.35mi |
| 9516 Wayburn St Detroit, MI | 2.0 | 1.0 | 800 | $950 | $1.19 | 19d | 1 | 1.37mi |
| 11018 Whitehill St Detroit, MI | 3.0 | 1.0 | 1146 | $1,450 | $1.27 | 12d | 1 | 1.38mi |
| 5856 Barrett St Unit 1 Detroit, MI | 3.0 | 1.0 | 1070 | $1,000 | $0.93 | 0d | 1 | 1.38mi |
| 19143 Fairport St Detroit, MI | 3.0 | 1.0 | 1070 | $1,225 | $1.14 | 19d | 1 | 1.39mi |
| 19170 Joann St Detroit, MI | 4.0 | 1.0 | 1020 | $1,400 | $1.37 | 45d | 1 | 1.39mi |
| 9168 Wayburn St Detroit, MI | 3.0 | 1.0 | 1274 | $1,300 | $1.02 | 22d | 1 | 1.43mi |
| 19220 Alcoy St Detroit, MI | 3.0 | 1.0 | 1023 | $1,350 | $1.32 | 19d | 1 | 1.43mi |
| 10141 Roxbury St Detroit, MI | 3.0 | 1.0 | 1115 | $1,000 | $0.90 | 45d | 1 | 1.46mi |
Listing history 18 events
-
2026-06-21days on market $27,400 Active 111 DOM
-
2026-06-18days on market $27,400 Active 108 DOM
-
2026-06-17days on market $27,400 Active 107 DOM
-
2026-06-15days on market $27,400 Active 105 DOM
-
2026-06-13days on market $27,400 Active 103 DOM
-
2026-06-13days on market $27,400 Active 102 DOM
-
2026-06-09days on market $27,400 Active 99 DOM
-
2026-06-08days on market $27,400 Active 98 DOM
-
2026-06-07days on market $27,400 Active 97 DOM
-
2026-06-04days on market $27,400 Active 94 DOM
-
2026-06-03days on market $27,400 Active 93 DOM
-
2026-06-01days on market $27,400 Active 91 DOM
-
2026-05-31days on market $27,400 Active 90 DOM
-
2026-04-25price $27,400 730-char remark
Show marketing remark (730 chars)
Welcome to 12705 Flanders St in Detroit's Eden Gardens neighborhood! This 3-bedroom, 1-bath home has about 1,020 square feet of living space and was built in 1952. It's a solid house with good bones and plenty of potential for someone ready to make it their own. There's a detached 1-car garage and a nice-sized yard, plus a basement that offers extra storage or space to finish down the road. The layout is practical and easy to work with, whether you're looking to move in and update over time or take on a renovation project. Located on a residential block close to schools, parks, and everyday conveniences, this home is a great option for an investor or a buyer looking for an affordable place with room to add value. -BATVAI
-
2026-04-24price $27,400 755-char remark
Show marketing remark (755 chars)
Welcome to 12705 Flanders St in Detroit’s Eden Gardens neighborhood! This 3-bedroom, 1-bath home has about 1,020 square feet of living space and was built in 1952. It’s a solid house with good bones and plenty of potential for someone ready to make it their own. There’s a detached 1-car garage and a nice-sized yard, plus a basement that offers extra storage or space to finish down the road. The layout is practical and easy to work with, whether you’re looking to move in and update over time or take on a renovation project. Located on a residential block close to schools, parks, and everyday conveniences, this home is a great option for an investor or a buyer looking for an affordable place with room to add value. -BATVAI
-
2026-03-02$29,900 Active 730-char remark
Show marketing remark (755 chars)
Welcome to 12705 Flanders St in Detroit’s Eden Gardens neighborhood! This 3-bedroom, 1-bath home has about 1,020 square feet of living space and was built in 1952. It’s a solid house with good bones and plenty of potential for someone ready to make it their own. There’s a detached 1-car garage and a nice-sized yard, plus a basement that offers extra storage or space to finish down the road. The layout is practical and easy to work with, whether you’re looking to move in and update over time or take on a renovation project. Located on a residential block close to schools, parks, and everyday conveniences, this home is a great option for an investor or a buyer looking for an affordable place with room to add value. -BATVAI
-
2026-03-02$29,900 Active 755-char remark
Show marketing remark (755 chars)
Welcome to 12705 Flanders St in Detroit’s Eden Gardens neighborhood! This 3-bedroom, 1-bath home has about 1,020 square feet of living space and was built in 1952. It’s a solid house with good bones and plenty of potential for someone ready to make it their own. There’s a detached 1-car garage and a nice-sized yard, plus a basement that offers extra storage or space to finish down the road. The layout is practical and easy to work with, whether you’re looking to move in and update over time or take on a renovation project. Located on a residential block close to schools, parks, and everyday conveniences, this home is a great option for an investor or a buyer looking for an affordable place with room to add value. -BATVAI
-
1998-03-06soldstatus $15,019
ⓘ Source: listings_history table (triggers on properties + properties_extension) + one-shot
backfill from property_details.listing_events for pre-trigger history.
Climate risk First Street
- Flood 1/10 Low FEMA zone X (unshaded) · 0% chance over 30 yrs
- Wildfire 1/10 Low
- Heat 3/10 Moderate 7 d/yr ≥96°F today · 14 d/yr by 30 yrs out
- Wind 2/10 Low
- Air quality 3/10 Moderate 2 unhealthy d/yr today · 5 by 30 yrs out
Nearby sold comps map
Loading sold comps map…
Walkable amenities ~0.75 mi
Loading nearby amenities…
Taxation est. · year 1
- Rental income
- $15,949
- − Mortgage interest
- −$1,535
- − Property taxes
- −$411
- − Insurance
- −$137
- − Repairs & maintenance
- −$1,276
- − Management
- −$1,276
- − Depreciation
- −$797
- Taxable income
- $10,518
- Est. tax owed @ 24.0%
- −$2,524
- After-tax cash flow
- $7,803/yr
For passive investors: Depreciation is non-cash, so a rental often shows a tax loss while cash-flowing — sheltering income. Rental losses are passive: they offset passive income freely, and up to $25,000/yr can offset ordinary (W-2) income if you actively participate and your MAGI is under $100k (phasing out to $0 by $150k); unused losses carry forward. On sale, claimed depreciation is recaptured at up to 25%, and gains may owe capital-gains tax (a 1031 exchange can defer both). Figures are a year-1 estimate at your 24.0% rate — not tax advice; consult a CPA.
Schools (NCES district)
- District
- Detroit Public Schools Community District
- NCES district ID
- 2601103
- Math proficiency
- 10% ▼ -2.00%
- Reading proficiency
- 24% ▲ 6.00%
- Median HH income
- $25,815
- Composite
- 13.06/100
- National rank
- #9564
- State rank
- #499 of 540 in MI
Livability — Detroit
- Score
- 73/100
- State rank
- #218
- US rank
- #5427
Category grades
Schools grade is shown separately in the Schools card above.
Census & demographics
- Census place
- Detroit, MI
- County
- Wayne County · 1,562,939 people
- City population
- 572,865
- Metro
- Detroit-Warren-Dearborn, MI
- Population (ZIP)
- 34,187
- Household income
- $38,966
- Rent vs Own
- Severe rent burden
- 2121.0
Population outlook (Wayne County) Hauer SSP2
- Today (2025)
- 1,675,273 people
- By 2030
- 1,620,300 · -3.3%
- By 2040
- 1,502,341 · -10.3%
- By 2050
- 1,384,039 · -17.4%
- By 2075
- 1,124,592 · -32.9%
- By 2100
- 881,193 · -47.4%
Race, ethnicity, and origin ACS 2023
- Neighborhood character
- Predominantly Black (93%)
- Race & ethnicity
- Black 93% White 3% Two or more races 2%
- Foreign-born
- 1% · Canada
- Languages at home
- 98% English-only · Spanish 1%
Political lean MEDSL · Wayne
- 2024 margin
- Strong D (+29.0) · D 62.7% · R 33.7% · Other 3.6%
- 2008→2024 swing
- -20.5pp toward R · 2008: 49.5pp · 2024: 29.0pp
- All cycles
- 2024: D+29.0 2020: D+38.1 2016: D+37.3 2012: D+46.9 2008: D+49.5
Not yet ingested
- Civics
- —
Market trends
- HPI YoY
- ▼ -91.80%
- Current HPI
- 235.0926
- Rent YoY
- ▲ 1.33%
- Metro
- Detroit-Warren-Dearborn, MI
- State GDP YoY
- ▲ 1.37%
- F500 in state
- 28
Industry mix (Fortune 500 HQ in MI)
| Industry | F500 HQs | Revenue |
|---|---|---|
| Automotive Parts | 3 | $48B |
|
||
| Automotive | 2 | $372B |
|
||
| Chemicals | 1 | $45B |
|
||
| Automotive Retail | 1 | $29B |
|
||
| Healthcare / Medical Devices | 1 | $23B |
|
||
| Automotive Technology | 1 | $20B |
|
||
Price history
+82.4% since first listed5 events — show timeline
- 2026-04-25 Price Changed $27,400 MiRealSource-MiMLS
- 2026-04-24 Price Changed $27,400 REALCOMP
- 2026-03-02 Listed $29,900 REALCOMP
- 2026-03-02 Listed $29,900 MiRealSource-MiMLS
- 1998-03-06 Sold (Public Records) $15,019 Public Records
Property tax history
+7.4%/yrLatest (2025): $1,770 · +14.1% YoY. Source: county tax records.
Cash-flow waterfall
monthlySold comps — $/sqft
last 12 mo · ≤1 miLoading sold comps…