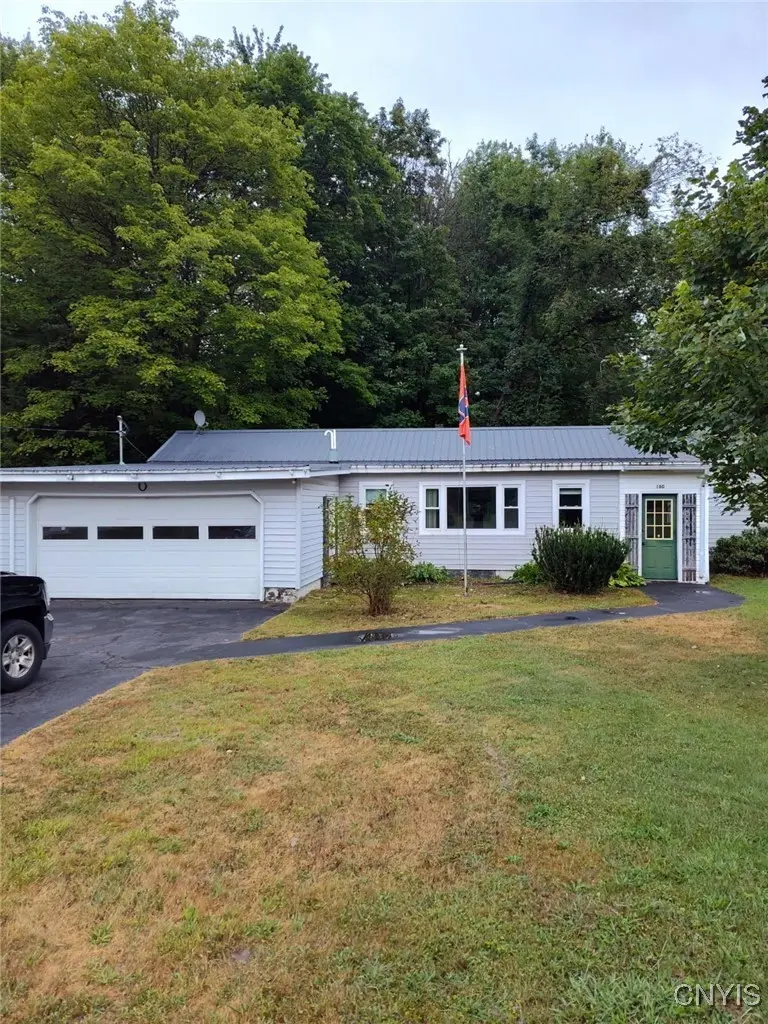
160 County Route 23 · Constantia, NY
Flood risk 1/10 · Minimal
- FEMA flood zone
- X (unshaded)
- Chance of flooding over 30 yrs
- 0.0%
- Est. flood insurance / yr
- $507 – $1,088
Fire risk 3/10 · Minor
- Est. fire insurance / yr
- $691 – $1,283
Heat risk 2/10 · Minimal
- Hot days now (above 94°F)
- 7 days/yr
- Hot days in 30 yrs
- 16 days/yr
Wind risk 1/10 · Minimal
- Chance of severe wind over 30 yrs
- —
Air-quality risk 2/10 · Minimal
- Unhealthy air days now
- 1 days/yr
- Unhealthy air days in 30 yrs
- 1 days/yr
Risk factors via First Street. Map © Google.
Why this score? — see what drove the D+ grade
The composite is a weighted blend of 9 inputs, each scored 0–100. Each bar is that input's sub-score; the figure is the points it added to the 100-point composite (weight × sub-score).
- ARV discount +11.3/15.0
- Appreciation +10.0/10.0
- Cash flow +9.7/30.0
- Schools +3.5/10.0
- 1% rule +3.2/10.0
- Livability +3.2/5.0
- DSCR +2.7/10.0
- Rent growth +2.5/5.0
- Condition / age +2.5/5.0
$115,000
🖨 Deal sheet 📄 Offer letter ✓ Due diligence
Listing remarks MLS
This property in a good very location and would make for a great starter home for all buyers! This is a mobile home with additional living space as well as a 2 car garage! With a little TLC this home can be just what you looking for! This is an estate property sold as is. Contact your agent today to see the potential that this property has to offer. Square footage is based upon tax records showing addition's to the Mobile home. Mobile home 58 x 12 = 696 sq ft, Wood addition of 288 sq ft, second addition of 22 x 12 = 264 sq ft. totaling 1248 sq ft.
Key facts
- 0.43 acre lot
- 2 garage spots
- Built 1965
Neighborhood map
What this means for you Summary
Snapshot
- This is a 2-bed/1.0-bath manufactured listed at $115k.
Deal economics
- At list price, monthly cash flow is $-77 ($-921/yr) — negative.
- To cash-flow at today's rent, offer at most $101k (11.8% below list).
- To meet the 1% rule (rent ≥ 1% of price), the offer needs to be $94k (18.2% below list).
- Recommended offer: $94k (18.2% below list) — sets the bar for 1% rule.
- Cap rate 5.5% vs local median 3.3% in Constantia — top-decile yield for the area; either an underpriced asset or a hidden risk that comps aren't pricing in. Stress-test before assuming the spread holds.
Location & tenants
- Location reads 65/100 on livability (#672 in NY) — a middle-class / working-renter tenant base. Strengths: crime A+, employment A+, cost of living A+; Watch: schools D-, amenities F, commute F.
- Central Square Central School District (suburban): math 40% / reading 40% proficiency, ranked #507 of 590 in NY (top 86%) — families likely to look elsewhere, expect single-tenant / working-renter base with shorter leases.
- Market conditions: 12 active listings in the ZIP; 172 units permitted in Oswego County in 2024 (27 in 5+ unit buildings).
Forward outlook
- In year one you build about $12k of equity ($795 loan paydown + $12k appreciation (10.0% local appreciation)).
- Oswego County population projected at -23% by 2050 — secular population decline; favor cash flow + early exit over multi-decade hold.
- At projected returns (10.0% appreciation + 3.0% rent growth), your $32k cash investment doubles in ~3 years — after that, you're playing with house money.
- By year 3, paydown + projected appreciation supports a ~$31k cash-out refi (75% LTV) — recoverable capital for the next deal without selling this one.
Negotiation context
- It's been on market 298 days — a 12% lower offer ($101k) is reasonable based on typical stale-listing flexibility.
- 2 sale attempts; this cycle's ask has dropped $10k (8%) from the opening price — seller is motivated, your offer sets the floor, not the list.
- Current owner paid $30k; list at $115k implies a 283% gain — meaningful room to come down on a strong offer.
Questions for the listing agent
- What do current leases actually rent for vs. the listed asking? Can we see a recent rent roll and the last 12 months of T-12 income?
- It's been on market 298 days. Have you received any prior offers? Is the seller open to a 18% concession, seller financing, or rate buy-down credit?
- Built in 1965 — when were the roof, HVAC, electrical panel, plumbing, and water heater last replaced?
- Why hasn't it sold? Are there any deal-killer items the seller is aware of (foundation, flood, title, zoning, code violations)?
- Is there a deadline driving the sale (1031 exchange, divorce, estate, relocation)? That informs how much negotiation room exists.
- Schools are D-rated, which usually means shorter tenancies and higher turnover. Who's the typical renter profile here, and what's been the actual vacancy rate?
- The area grade is low — what's the realistic commute time and amenity access for the typical tenant pool here? Any planned neighborhood developments (good or bad) we should know about?
- What's the average days-on-market for RENTAL listings here right now (not sales)? A rising rental-DOM trend means longer vacancies and softer asking-rent achievability than the comps imply.
- What's the recent tenant-quality profile in this submarket — average credit score on applications, eviction rate, late-payment / NSF rate, and stable-employment percentage? A property-management company in the area should have these aggregated.
- How much new for-sale + rental construction is in the pipeline within 1–3 miles? Heavy new supply typically softens prices + rents 12–24 months out; constrained supply supports both.
Investment metrics
- 1% rule
- 0.82% ✗
- Cap rate
- 5.49%
- Cash-on-cash
- -2.86%
- DSCR
- 0.87
- GRM
- 10.2
CMA / ARV
- ARV (median comp)
- $125,611
- List price
- $115,000
- Delta
- -8.45%
- Verdict
- FAIR
- Comps
- 4 within 2.0 mi
Projected returns pro-forma
10.0% appreciation · 3.0% rent growth · sell at horizon
- IRR
- 22.3%
- Equity multiple
- 2.79×
- Total profit
- $57,772
- Equity at exit
- $103,601
- IRR
- 20.0%
- Equity multiple
- 6.40×
- Total profit
- $174,032
- Equity at exit
- $223,420
Cash invested: $32,200 (down + closing). Projections, not guarantees.
Landlord ↔ Tenant lean methodology
- Overall (STATE)
- 15 Strongly Tenant-Friendly
- State New York
- 15 Strongly Tenant-Friendly · D+10
- County
- — inherits STATE
- City
- — inherits STATE
ZIP-level market 13044
- Home prices YoY
- 33.5%
- Active inventory
- 12
- Price-to-rent
- 10.2×
Monthly cashflow live
- Estimated rent
- $940 medium interval (Pro) →
- Mortgage (P&I)
- −$603
- Tax from tax record
- −$169 /mo · $2,023/yr
- Insurance
- −$48
- HOA
- −$0
- Vacancy / Maint / Mgmt
- −$197
- Net cashflow
- $-77
Break-even live
UW: 25.0% down · 7.5% · 30yr · 1.5% tax · 5.0% vac · 8.0% maint · 8.0% mgmt
Financing live
Cash to close
- Down payment
- $28,750
- Closing costs
- $3,450
- Reserves months
- —
- Total cash needed
- —
Loan-product check · same deal, 3 products live
Conventional
25% down · 7.5% · 30yr
- Down + closing
- —
- Monthly P&I
- —
- Monthly cashflow
- —
- DSCR
- —
- Eligible?
- —
Personal DTI + credit; lowest rate.
DSCR
20% down · 8.5% · 30yr
- Down + closing
- —
- Monthly P&I
- —
- Monthly cashflow
- —
- DSCR
- —
- Eligible?
- —
No personal income docs; deal must DSCR.
Hard money
10% down · 12.0% · 12mo
- Down + closing
- —
- Monthly P&I
- —
- Monthly cashflow
- —
- DSCR
- —
- Eligible?
- —
Short-term bridge; refi at stabilization.
Listing history 20 events
-
2026-06-18days on market $115,000 Active 298 DOM
-
2026-06-17days on market $115,000 Active 297 DOM
-
2026-06-16days on market $115,000 Active 296 DOM
-
2026-06-15days on market $115,000 Active 295 DOM
-
2026-06-13days on market $115,000 Active 293 DOM
-
2026-06-12days on market $115,000 Active 292 DOM
-
2026-06-09days on market $115,000 Active 289 DOM
-
2026-06-08days on market $115,000 Active 288 DOM
-
2026-06-07days on market $115,000 Active 287 DOM
-
2026-06-07days on market $115,000 Active 286 DOM
-
2026-06-04days on market $115,000 Active 283 DOM
-
2026-06-02days on market $115,000 Active 282 DOM
-
2026-06-01days on market $115,000 Active 281 DOM
-
2026-05-31days on market $115,000 Active 280 DOM
-
2026-04-02status Active 553-char remark
Show marketing remark (553 chars)
This property in a good very location and would make for a great starter home for all buyers! This is a mobile home with additional living space as well as a 2 car garage! With a little TLC this home can be just what you looking for! This is an estate property sold as is. Contact your agent today to see the potential that this property has to offer. Square footage is based upon tax records showing addition's to the Mobile home. Mobile home 58 x 12 = 696 sq ft, Wood addition of 288 sq ft, second addition of 22 x 12 = 264 sq ft. totaling 1248 sq ft.
-
2026-03-31historical 553-char remark
Show marketing remark (553 chars)
This property in a good very location and would make for a great starter home for all buyers! This is a mobile home with additional living space as well as a 2 car garage! With a little TLC this home can be just what you looking for! This is an estate property sold as is. Contact your agent today to see the potential that this property has to offer. Square footage is based upon tax records showing addition's to the Mobile home. Mobile home 58 x 12 = 696 sq ft, Wood addition of 288 sq ft, second addition of 22 x 12 = 264 sq ft. totaling 1248 sq ft.
-
2025-10-17price $115,000 553-char remark
Show marketing remark (553 chars)
This property in a good very location and would make for a great starter home for all buyers! This is a mobile home with additional living space as well as a 2 car garage! With a little TLC this home can be just what you looking for! This is an estate property sold as is. Contact your agent today to see the potential that this property has to offer. Square footage is based upon tax records showing addition's to the Mobile home. Mobile home 58 x 12 = 696 sq ft, Wood addition of 288 sq ft, second addition of 22 x 12 = 264 sq ft. totaling 1248 sq ft.
-
2025-09-12price $120,000 553-char remark
Show marketing remark (553 chars)
This property in a good very location and would make for a great starter home for all buyers! This is a mobile home with additional living space as well as a 2 car garage! With a little TLC this home can be just what you looking for! This is an estate property sold as is. Contact your agent today to see the potential that this property has to offer. Square footage is based upon tax records showing addition's to the Mobile home. Mobile home 58 x 12 = 696 sq ft, Wood addition of 288 sq ft, second addition of 22 x 12 = 264 sq ft. totaling 1248 sq ft.
-
2025-08-21$125,000 Active 553-char remark
Show marketing remark (553 chars)
This property in a good very location and would make for a great starter home for all buyers! This is a mobile home with additional living space as well as a 2 car garage! With a little TLC this home can be just what you looking for! This is an estate property sold as is. Contact your agent today to see the potential that this property has to offer. Square footage is based upon tax records showing addition's to the Mobile home. Mobile home 58 x 12 = 696 sq ft, Wood addition of 288 sq ft, second addition of 22 x 12 = 264 sq ft. totaling 1248 sq ft.
-
1997-05-28soldstatus $30,000
ⓘ Source: listings_history table (triggers on properties + properties_extension) + one-shot
backfill from property_details.listing_events for pre-trigger history.
Tax reassessment forecast NY · Partial reset (capped growth)
- Current annual tax
- $2,023 · $169/mo
- Projected year-2 tax
- $2,023 · $169/mo
- Expected delta
- $0/yr ($0/mo · 0.0%)
ⓘ Screening estimate from a state-policy table — verify with the county assessor before closing.
Climate risk First Street
- Flood 1/10 Low FEMA zone X (unshaded) · 0% chance over 30 yrs
- Wildfire 3/10 Moderate
- Heat 2/10 Low 7 d/yr ≥94°F today · 16 d/yr by 30 yrs out
- Wind 1/10 Low
- Air quality 2/10 Low 1 unhealthy d/yr today · 1 by 30 yrs out
Nearby sold comps map
Loading sold comps map…
Walkable amenities ~0.75 mi
Loading nearby amenities…
Taxation est. · year 1
- Rental income
- $11,283
- − Mortgage interest
- −$6,442
- − Property taxes
- −$2,023
- − Insurance
- −$575
- − Repairs & maintenance
- −$903
- − Management
- −$903
- − Depreciation
- −$3,345
- Taxable loss
- −$2,907
- Est. tax savings @ 24.0%
- +$698
- After-tax cash flow
- $-223/yr
For passive investors: Depreciation is non-cash, so a rental often shows a tax loss while cash-flowing — sheltering income. Rental losses are passive: they offset passive income freely, and up to $25,000/yr can offset ordinary (W-2) income if you actively participate and your MAGI is under $100k (phasing out to $0 by $150k); unused losses carry forward. On sale, claimed depreciation is recaptured at up to 25%, and gains may owe capital-gains tax (a 1031 exchange can defer both). Figures are a year-1 estimate at your 24.0% rate — not tax advice; consult a CPA.
Schools (NCES district)
- District
- Central Square Central School District
- NCES district ID
- 3606900
- Math proficiency
- 40% ▼ -18.00%
- Reading proficiency
- 40% ▼ -12.00%
- Median HH income
- $55,807
- Composite
- 35.05/100
- National rank
- #5035
- State rank
- #507 of 590 in NY
Livability — Constantia
- Score
- 65/100
- State rank
- #672
- US rank
- #12597
Category grades
Schools grade is shown separately in the Schools card above.
Census & demographics
- Census place
- Constantia, NY
- Population (ZIP)
- 2,884
Population outlook (Oswego County) Hauer SSP2
- Today (2025)
- 114,465 people
- By 2030
- 109,968 · -3.9%
- By 2040
- 99,205 · -13.3%
- By 2050
- 87,979 · -23.1%
- By 2075
- 65,100 · -43.1%
- By 2100
- 47,117 · -58.8%
Race, ethnicity, and origin ACS 2023
- Neighborhood character
- Predominantly White (91%)
- Race & ethnicity
- White 91% Two or more races 9% Hispanic / Latino 7%
- Hispanic origin (detail)
- Mexican 4% Puerto Rican 2%
- Common ancestry
- Lithuanian 14% Portuguese 4% Romanian 4%
- Foreign-born
- 3% · Canada
- Languages at home
- 93% English-only · Spanish 4% French/Haitian/Cajun 3% German/W. Germanic 1%
Political lean MEDSL · Oswego
- 2024 margin
- Strong R (+24.2) · D 37.9% · R 62.1%
- 2008→2024 swing
- -26.6pp toward R · 2008: 2.5pp · 2024: -24.2pp
- All cycles
- 2024: R+24.2 2020: R+20.2 2016: R+23.2 2012: D+7.9 2008: D+2.5
Not yet ingested
- Civics
- —
Market trends
- HPI YoY
- ▲ 65.34%
- Current HPI
- 260.47
- Rent YoY
- —
- Metro
- —
- State GDP YoY
- ▲ 2.60%
- F500 in state
- 92
Industry mix (Fortune 500 HQ in NY)
| Industry | F500 HQs | Revenue |
|---|---|---|
| Financial Services | 10 | $950B |
|
||
| Consumer Goods | 9 | $162B |
|
||
| Insurance | 4 | $225B |
|
||
| Telecommunications | 2 | $144B |
|
||
| Pharmaceuticals | 2 | $112B |
|
||
| Media / Entertainment | 2 | $69B |
|
||
Price history
+283.3% since first listed6 events — show timeline
- 2026-04-02 Relisted — CNYIS
- 2026-03-31 Listing Removed — CNYIS
- 2025-10-17 Price Changed $115,000 CNYIS
- 2025-09-12 Price Changed $120,000 CNYIS
- 2025-08-21 Listed $125,000 CNYIS
- 1997-05-28 Sold (Public Records) $30,000 Public Records
Property tax history
+2.5%/yrLatest (2025): $2,023 · +0.7% YoY. Source: county tax records.
Cash-flow waterfall
monthlySold comps — $/sqft
last 12 mo · ≤1 miLoading sold comps…