2430 E 16th St · Indianapolis city (balance), IN
Flood risk 1/10 · Minimal
- FEMA flood zone
- X (unshaded)
- Chance of flooding over 30 yrs
- 0.0%
- Est. flood insurance / yr
- $473 – $860
Fire risk 1/10 · Minimal
- Est. fire insurance / yr
- $717 – $1,331
Heat risk 3/10 · Minor
- Hot days now (above 102°F)
- 7 days/yr
- Hot days in 30 yrs
- 19 days/yr
Wind risk 2/10 · Minimal
- Chance of severe wind over 30 yrs
- 0.0%
Air-quality risk 4/10 · Minor
- Unhealthy air days now
- 5 days/yr
- Unhealthy air days in 30 yrs
- 7 days/yr
Risk factors via First Street. Map © Google.
Why this score? — see what drove the B- grade
The composite is a weighted blend of 9 inputs, each scored 0–100. Each bar is that input's sub-score; the figure is the points it added to the 100-point composite (weight × sub-score).
- Cash flow +29.3/30.0
- DSCR +10.0/10.0
- 1% rule +9.3/10.0
- ARV discount +7.5/15.0
- Rent growth +4.3/5.0
- Livability +2.5/5.0
- Condition / age +2.5/5.0
- Schools +1.4/10.0
- Appreciation +0.0/10.0
$79,990
🖨 Deal sheet (PDF) 📄 Offer letter ✓ Due diligence
Listing remarks
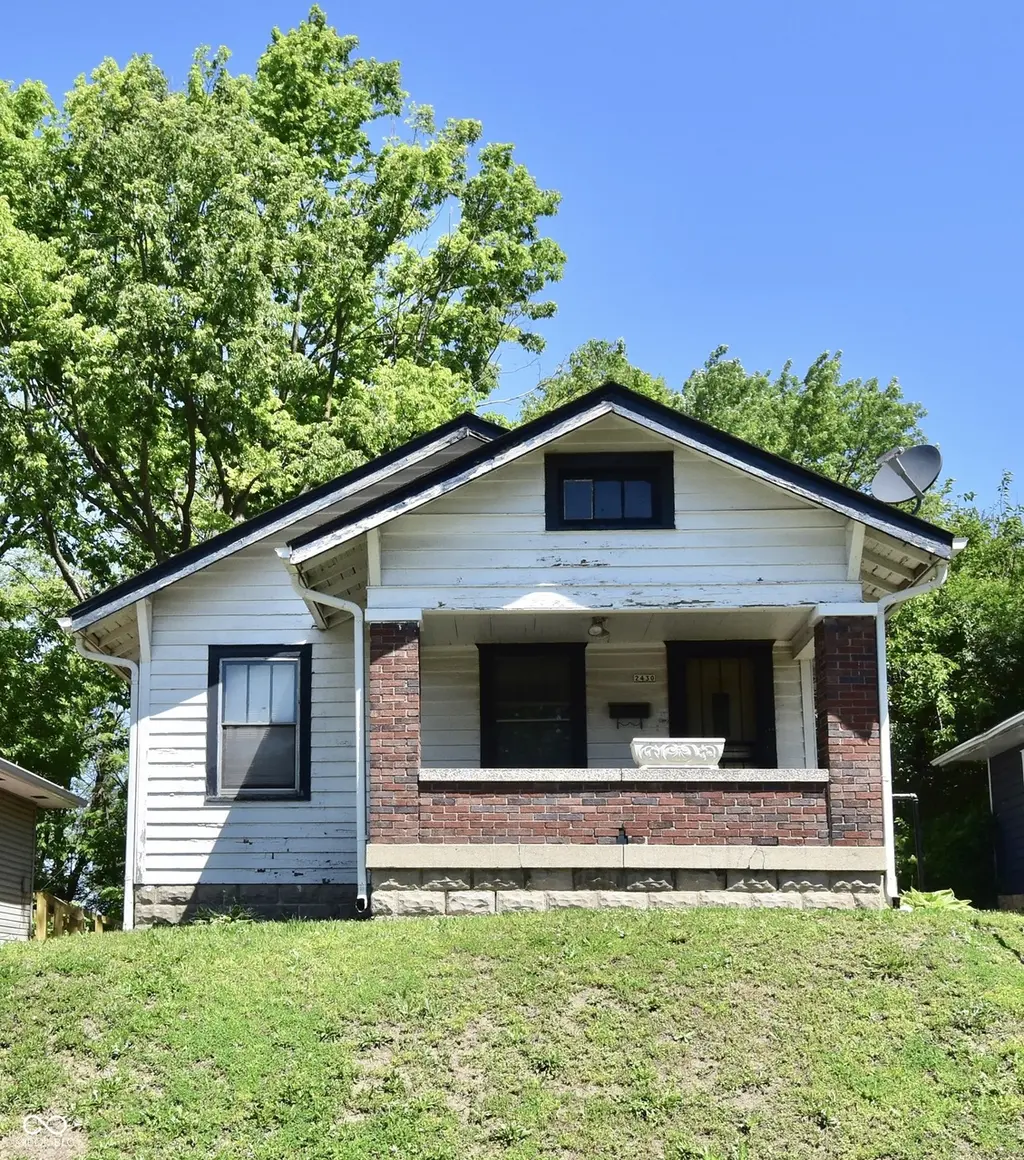
Bungalow with great potential featuring hardwood floors, good closet space, and a spacious front porch perfect for relaxing or entertaining. Furnace was updated within the past year and the roof was replaced in 2019. The 1-car garage provides added convenience and storage. Convenient location located less than 10 minutes from several downtown attractions and amenities. A great opportunity to make this home your own!
Key facts
- Good closet space
- Spacious front porch
- Replaced roof
Tags
Property features AI
Finance
- Other: Lot under 1/4 acre
Exterior
- Parking: Detached garage (1 car)
- Utilities: Public water; Municipal sewer connected; 100 amp electric service; Solid waste service available
- Home design: Single-family residence; One story; Property listed as fixer
- Construction: Wood siding; Block foundation
- Exterior features: Covered porch/patio; No fence
Interior
- Kitchen: Kitchen on main level
- Bedrooms: 2 bedrooms on the main level
- Flooring: Hardwood floors
- Bathrooms: 1 full bathroom
- Heating & cooling: Forced air heating; No central air
- Interior features: Attic access; Hardwood floors
- Laundry & utility: Laundry connections (all)
Neighborhood map
What this means for you Summary
Snapshot
- This is a 2-bed/1.0-bath single-family listed at $80k.
Deal economics
- At list price, monthly cash flow is $282 ($3k/yr) — positive.
- The deal already cash-flows at list — no discount required.
- Meets the 1% rule at list price ($1k rent vs $80k).
- Cap rate 10.5% vs local median 4.4% in Indianapolis city (balance) — top-decile yield for the area; either an underpriced asset or a hidden risk that comps aren't pricing in. Stress-test before assuming the spread holds.
Location & tenants
- Location reads: area grade B — affects rentability + tenant quality, not the cash-flow math above.
- Indianapolis Public Schools (urban): math 14% / reading 20% proficiency, ranked #286 of 301 in IN (top 95%) — low school quality limits family demand, transient renter base, plan for 1-2y turnover; 77% free/reduced lunch — lower-income household profile, screen leases tightly.
- Zoned schools: Center For Inquiry School 27 (math 25% / reading 29%, grade F, #737 of 994 statewide, top 76%, 525 students, 51% FRL); H L Harshman Middle School (math 3% / reading 16%, grade F, #316 of 330 statewide, top 96%, 549 students, 84% FRL); Arsenal Technical High School (math 6% / reading 27%, grade F, #353 of 369 statewide, top 96%, 2,366 students, 74% FRL).
- Market conditions: Rents rising fast (+7.3%/yr); 483 active listings in the ZIP; 40 comparable units currently listed for rent nearby; rentals at typical pace (median 26d on market — plan ~3-4 weeks tenant-placement turnaround); 42% of comp listings sitting > 30 days — soft ceiling on asking rent; 1,906 units permitted in Marion County in 2024 (621 in 5+ unit buildings).
Forward outlook
- Local home prices are declining (-3.0%/yr); year-one equity from $554 of loan paydown is wiped out by about $2k of value loss. Plan a longer hold.
- Marion County population projected at +18% by 2050 — long-run rental-demand tailwind backs the buy-and-hold thesis.
- At projected returns (-3.0% appreciation + 7.3% rent growth), your $22k cash investment doubles in ~6 years — after that, you're playing with house money.
Negotiation context
- Only 1 days on market — expect competitive offers; lowballing is unlikely to land.
Risks & watch-outs
- Watch-outs: property tax is 2.6% of price; built in 1923 — expect roof / HVAC / electrical / plumbing capex.
Questions for the listing agent
- Built in 1923 — when were the roof, HVAC, electrical panel, plumbing, and water heater last replaced?
- Property tax is high relative to price — has the assessment been appealed recently, and will the sale trigger a re-assessment?
- Is there a deadline driving the sale (1031 exchange, divorce, estate, relocation)? That informs how much negotiation room exists.
- What's the average days-on-market for RENTAL listings here right now (not sales)? A rising rental-DOM trend means longer vacancies and softer asking-rent achievability than the comps imply.
- What's the recent tenant-quality profile in this submarket — average credit score on applications, eviction rate, late-payment / NSF rate, and stable-employment percentage? A property-management company in the area should have these aggregated.
- How much new for-sale + rental construction is in the pipeline within 1–3 miles? Heavy new supply typically softens prices + rents 12–24 months out; constrained supply supports both.
Investment metrics
- 1% rule
- 1.43% ✓
- Cap rate
- 10.53%
- Cash-on-cash
- 15.12%
- DSCR
- 1.67
- GRM
- 5.8
CMA / ARV
- ARV (on-the-fly)
- $196,482
- Comps found
- 6
Show comp detail 6 sales within ~0.75 mi
| Address | Dist | Beds/Ba | Sqft | Sold | Price | $/sf | Match |
|---|---|---|---|---|---|---|---|
| 946 N Temple Ave | 0.52mi | 2/1.0 | 875 (+2%) | 11mo | $200,000 | $229 | 63 |
| 1022 Jefferson Ave | 0.47mi | 2/1.0 | 780 (-9%) | 3mo | $215,000 | $276 | 61 |
| 2934 E Brookside Ave | 0.54mi | 3/1.0 (+1) | 912 (+6%) | 7mo | $50,000 | $55 | 54 |
| 2030 Houston St | 0.74mi | 3/2.0 (+1) | 912 (+6%) | 7mo | $130,000 | $143 | 41 |
| 1925 N Dearborn St | 0.58mi | 2/1.0 | 971 (+13%) | 21mo | $105,000 | $108 | 34 |
| 1016 N Newman St | 0.75mi | 2/1.0 | 784 (-9%) | 22mo | $195,000 | $249 | 32 |
Match score weights: distance 35% · size 25% · config 20% · recency 20%. Top-matched comps best support the ARV.
Projected returns pro-forma
-3.0% appreciation · 7.31% rent growth · sell at horizon
- IRR
- 11.0%
- Equity multiple
- 1.46×
- Total profit
- $10,258
- Equity at exit
- $11,927
- IRR
- 23.5%
- Equity multiple
- 3.48×
- Total profit
- $55,601
- Equity at exit
- $6,916
Cash invested: $22,397 (down + closing). Projections, not guarantees.
Landlord ↔ Tenant lean methodology
- Overall (STATE)
- 90 Strongly Landlord-Friendly
- State Indiana
- 90 Strongly Landlord-Friendly · R+11
- County
- — inherits STATE
- City
- — inherits STATE
ZIP-level market 46201
- Home prices YoY
- -33.9%
- Rents YoY
- 7.3%
- Active inventory
- 483
- Price-to-rent
- 5.8×
Monthly cashflow live
- Estimated rent
- $1,147 high interval (Pro) →
- Mortgage (P&I)
- −$419
- Tax from tax record
- −$171 /mo · $2,056/yr
- Insurance
- −$33
- HOA
- −$0
- Vacancy / Maint / Mgmt
- −$241
- Net cashflow
- $282
Break-even live
Sensitivity live
| Price | -10% $327 | -5% $305 | +0% $282 | +5% $259 | +10% $237 |
|---|---|---|---|---|---|
| Rent | -10% $192 | -5% $237 | +0% $282 | +5% $327 | +10% $373 |
| Rate | -1.0pp $322 | -0.5pp $302 | base $282 | +0.5pp $261 | +1.0pp $240 |
UW: 25.0% down · 7.5% · 30yr · 1.5% tax · 5.0% vac · 8.0% maint · 8.0% mgmt
Financing live
Cash to close
- Down payment
- $19,998
- Closing costs
- $2,400
- Reserves months
- —
- Total cash needed
- —
Loan-product check · same deal, 3 products live
Conventional
25% down · 7.5% · 30yr
- Down + closing
- —
- Monthly P&I
- —
- Monthly cashflow
- —
- DSCR
- —
- Eligible?
- —
Personal DTI + credit; lowest rate.
DSCR
20% down · 8.5% · 30yr
- Down + closing
- —
- Monthly P&I
- —
- Monthly cashflow
- —
- DSCR
- —
- Eligible?
- —
No personal income docs; deal must DSCR.
Hard money
10% down · 12.0% · 12mo
- Down + closing
- —
- Monthly P&I
- —
- Monthly cashflow
- —
- DSCR
- —
- Eligible?
- —
Short-term bridge; refi at stabilization.
Rent comps 40 comps
| Address | Beds | Baths | Sqft | Rent | $/sqft | DOM | Units | Dist |
|---|---|---|---|---|---|---|---|---|
| 2405 E 16th St Indianapolis, IN | 3.0 | 1.0 | 1120 | $1,450 | $1.29 | 16d | 1 | 0.05mi |
| 1315 N Rural St Indianapolis, IN | 1.0 | 1.0 | 700 | $1,000 | $1.43 | 6d | 1 | 0.28mi |
| 2310 E 12th St Indianapolis, IN | 2.0 | 1.0 | 900 | $1,200 | $1.33 | 45d | 1 | 0.29mi |
| 2827 E 18th St Indianapolis, IN | 2.0 | 1.0 | 726 | $1,300 | $1.79 | 25d | 1 | 0.32mi |
| 3058 Brookside Parkway North Dr Indianapolis, IN | 1.0 | 1.0 | 700 | $875 | $1.25 | 14d | 1 | 0.38mi |
| 2841 E 19th St Indianapolis, IN | 2.0 | 1.0 | 812 | $850 | $1.05 | 6d | 1 | 0.38mi |
| 2437 E 11th St Indianapolis, IN | 1.0 | 1.0 | 975 | $1,500 | $1.54 | 45d | 1 | 0.39mi |
| 2815 Brookside Ave Indianapolis, IN | 3.0 | 2.0 | 1120 | $1,350 | $1.21 | 12d | 1 | 0.39mi |
| 1113 N Oxford St Indianapolis, IN | 3.0 | 2.0 | 1100 | $1,495 | $1.36 | 9d | 1 | 0.44mi |
| 1931 N Oxford St Indianapolis, IN | 1.0 | 1.0 | 616 | $875 | $1.42 | 5d | 1 | 0.49mi |
| 3030 E 10th St Indianapolis, IN | 2.0 | 1.0 | 950 | $900 | $0.95 | 23d | 1 | 0.58mi |
| 1114 N Dearborn St Indianapolis, IN | 1.0 | 1.0 | 646 | $795 | $1.23 | 46d | 1 | 0.58mi |
| 3101 E 10th St #301 Indianapolis, IN | 2.0 | 1.0 | 921 | $1,195 | $1.30 | 45d | 1 | 0.60mi |
| 1505 N Tuxedo St Unit 1507 Indianapolis, IN | 2.0 | 1.0 | 1000 | $1,100 | $1.10 | 45d | 1 | 0.63mi |
| 1354 N Olney St Unit 1356 Indianapolis, IN | 1.0 | 1.0 | 765 | $775 | $1.01 | 45d | 1 | 0.69mi |
| 2045 N Dearborn St Indianapolis, IN | 3.0 | 2.0 | 912 | $1,145 | $1.26 | 25d | 1 | 0.69mi |
| 835 Tecumseh St Indianapolis, IN | 3.0 | 2.0 | 1100 | $1,550 | $1.41 | 6d | 1 | 0.69mi |
| 1421 N Olney St Indianapolis, IN | 2.0 | 1.0 | 1064 | $975 | $0.92 | 12d | 1 | 0.71mi |
| 1421 N Olney St Indianapolis, IN | 2.0 | 1.0 | 1064 | $975 | $0.92 | 0d | 1 | 0.71mi |
| 1036 N Tuxedo St Indianapolis, IN | 1.0 | 1.0 | 646 | $750 | $1.16 | 6d | 1 | 0.72mi |
| 1301 N Olney St Unit 1303 Indianapolis, IN | 2.0 | 1.0 | 750 | $1,100 | $1.47 | 45d | 1 | 0.74mi |
| 1358 N Gale St Indianapolis, IN | 1.0 | 1.0 | 550 | $890 | $1.62 | 18d | 1 | 0.75mi |
| 639 N Rural St Indianapolis, IN | 3.0 | 1.0 | 1000 | $1,675 | $1.68 | 19d | 1 | 0.76mi |
| 1028 N Olney St Unit 1030 Indianapolis, IN | 1.0 | 1.0 | 700 | $800 | $1.14 | 25d | 1 | 0.79mi |
| 850 N Dearborn St Indianapolis, IN | 1.0 | 1.0 | 784 | $750 | $0.96 | 45d | 1 | 0.79mi |
| 628 N Oxford St Indianapolis, IN | 1.0 | 1.0 | 536 | $775 | $1.45 | 25d | 1 | 0.79mi |
| 3601 Brookside Parkway South Dr Indianapolis, IN | 2.0 | 1.0 | 1025 | $995 | $0.97 | 25d | 1 | 0.81mi |
| 3601 Brookside Parkway South Dr Indianapolis, IN | 2.0 | 1.0 | 1025 | $995 | $0.97 | 45d | 1 | 0.81mi |
| 1106 N Gale St Unit 1 Indianapolis, IN | 2.0 | 1.0 | 750 | $895 | $1.19 | 45d | 1 | 0.82mi |
| 621 Tecumseh St Indianapolis, IN | 2.0 | 1.0 | 726 | $1,025 | $1.41 | 45d | 1 | 0.82mi |
| 784 Woodruff Place Middle Dr Indianapolis, IN | 1.0 | 1.0 | 750 | $1,300 | $1.73 | 45d | 1 | 0.82mi |
| 679 Woodruff Place East Dr Indianapolis, IN | 1.0 | 1.0 | 600 | $895 | $1.49 | 25d | 1 | 0.84mi |
| 1644 Doctor Andrew J Brown Ave Unit A&B Indianapolis, IN | 1.0 | 1.0 | 550 | $1,300 | $2.36 | 45d | 1 | 0.84mi |
| 3617 Brookside Parkway South Dr Indianapolis, IN | 2.0 | 1.0 | 800 | $999 | $1.25 | 25d | 1 | 0.84mi |
| 632 N Gray St Indianapolis, IN | 3.0 | 1.0 | 960 | $1,800 | $1.88 | 45d | 1 | 0.85mi |
| 639 N Gray St Indianapolis, IN | 3.0 | 1.5 | 1120 | $1,220 | $1.09 | 45d | 1 | 0.86mi |
| 637 N Gray St Indianapolis, IN | 3.0 | 1.5 | 1120 | $1,150 | $1.03 | 46d | 1 | 0.86mi |
| 3709 Brookside Parkway South Dr Indianapolis, IN | 1.0 | 1.0 | 742 | $825 | $1.11 | 25d | 1 | 0.88mi |
| 1532 N Sherman Dr Unit 1530 Sherman Indianapolis, IN | 1.0 | 1.0 | 768 | $550 | $0.72 | 3d | 1 | 0.91mi |
| 1401 E 10th St Unit 122 Indianapolis, IN | 1.0 | 1.0 | 781 | $1,250 | $1.60 | 45d | 1 | 0.92mi |
Listing history 2 events
-
2026-05-14status Pending
-
2026-05-13$79,990 Active
ⓘ Source: listings_history table (triggers on properties + properties_extension) + one-shot
backfill from property_details.listing_events for pre-trigger history.
Tax reassessment forecast IN · Partial reset (capped growth)
- Current annual tax
- $2,056 · $171/mo
- Projected year-2 tax
- $2,056 · $171/mo
- Expected delta
- $0/yr ($0/mo · 0.0%)
ⓘ Screening estimate from a state-policy table — verify with the county assessor before closing.
Climate risk First Street
- Flood 1/10 Low FEMA zone X (unshaded) · 0% chance over 30 yrs
- Wildfire 1/10 Low
- Heat 3/10 Moderate 7 d/yr ≥102°F today · 19 d/yr by 30 yrs out
- Wind 2/10 Low 0% chance of damaging wind over 30 yrs
- Air quality 4/10 Moderate 5 unhealthy d/yr today · 7 by 30 yrs out
Nearby sold comps map
Loading sold comps map…
Walkable amenities ~0.75 mi
Loading nearby amenities…
Taxation est. · year 1
- Rental income
- $13,765
- − Mortgage interest
- −$4,481
- − Property taxes
- −$2,056
- − Insurance
- −$400
- − Repairs & maintenance
- −$1,101
- − Management
- −$1,101
- − Depreciation
- −$2,327
- Taxable income
- $2,300
- Est. tax owed @ 24.0%
- −$552
- After-tax cash flow
- $2,834/yr
For passive investors: Depreciation is non-cash, so a rental often shows a tax loss while cash-flowing — sheltering income. Rental losses are passive: they offset passive income freely, and up to $25,000/yr can offset ordinary (W-2) income if you actively participate and your MAGI is under $100k (phasing out to $0 by $150k); unused losses carry forward. On sale, claimed depreciation is recaptured at up to 25%, and gains may owe capital-gains tax (a 1031 exchange can defer both). Figures are a year-1 estimate at your 24.0% rate — not tax advice; consult a CPA.
Schools (NCES district)
- District
- Indianapolis Public Schools
- NCES district ID
- 1804770
- Math proficiency
- 14% ▼ -7.00%
- Reading proficiency
- 20% ▼ -3.00%
- Median HH income
- $32,034
- Composite
- 13.69/100
- National rank
- #9499
- State rank
- #286 of 301 in IN
Livability — Indianapolis city (balance)
No livability data for this city. (Only ~50 U.S. cities are tracked.)
Census & demographics
- Census place
- Indianapolis city (balance), IN
- County
- Marion County · 998,460 people
- City population
- 881,119
- Metro
- Indianapolis-Carmel-Anderson, IN
- Population (ZIP)
- 30,335
- Household income
- $49,195
- Rent vs Own
- Severe rent burden
- 1906.0
Population outlook (Marion County) Hauer SSP2
- Today (2025)
- 1,025,572 people
- By 2030
- 1,065,727 · +3.9%
- By 2040
- 1,141,577 · +11.3%
- By 2050
- 1,208,920 · +17.9%
- By 2075
- 1,367,288 · +33.3%
- By 2100
- 1,438,201 · +40.2%
Race, ethnicity, and origin ACS 2023
- Neighborhood character
- Diverse neighborhood (Simpson 0.63)
- Race & ethnicity
- White 53% Hispanic / Latino 23% Black 18% Two or more races 9%
- Hispanic origin (detail)
- Mexican 14% Puerto Rican 2%
- Common ancestry
- Slovak 2% Lithuanian 2% Italian 1%
- Foreign-born
- 9% · Canada
- Languages at home
- 81% English-only · Spanish 17%
Political lean MEDSL · Marion
- 2024 margin
- Strong D (+27.7) · D 63.0% · R 35.3% · Other 1.7%
- 2008→2024 swing
- -0.7pp no change · 2008: 28.4pp · 2024: 27.7pp
- All cycles
- 2024: D+27.7 2020: D+29.1 2016: D+22.8 2012: D+22.2 2008: D+28.4
Not yet ingested
- Civics
- —
Market trends
- HPI YoY
- ▼ -192.51%
- Current HPI
- 375.0969
- Rent YoY
- ▲ 7.31%
- Metro
- Indianapolis-Carmel-Anderson, IN
- State GDP YoY
- ▲ 2.90%
- F500 in state
- 18
Industry mix (Fortune 500 HQ in IN)
| Industry | F500 HQs | Revenue |
|---|---|---|
| Industrial Machinery | 2 | $37B |
|
||
| Healthcare | 1 | $177B |
|
||
| Pharmaceuticals | 1 | $45B |
|
||
| Metals / Steel | 1 | $18B |
|
||
| Agriculture | 1 | $17B |
|
||
| Packaging | 1 | $12B |
|
||
Price history
2 events — show timeline
- 2026-05-14 Pending — MIBOR as Distributed by MLS Grid
- 2026-05-13 Listed $79,990 MIBOR as Distributed by MLS Grid
Property tax history
+5.2%/yrLatest (2025): $2,056 · +15.4% YoY. Source: county tax records.
Cash-flow waterfall
monthlySold comps — $/sqft
last 12 mo · ≤1 miLoading sold comps…