 Duplex
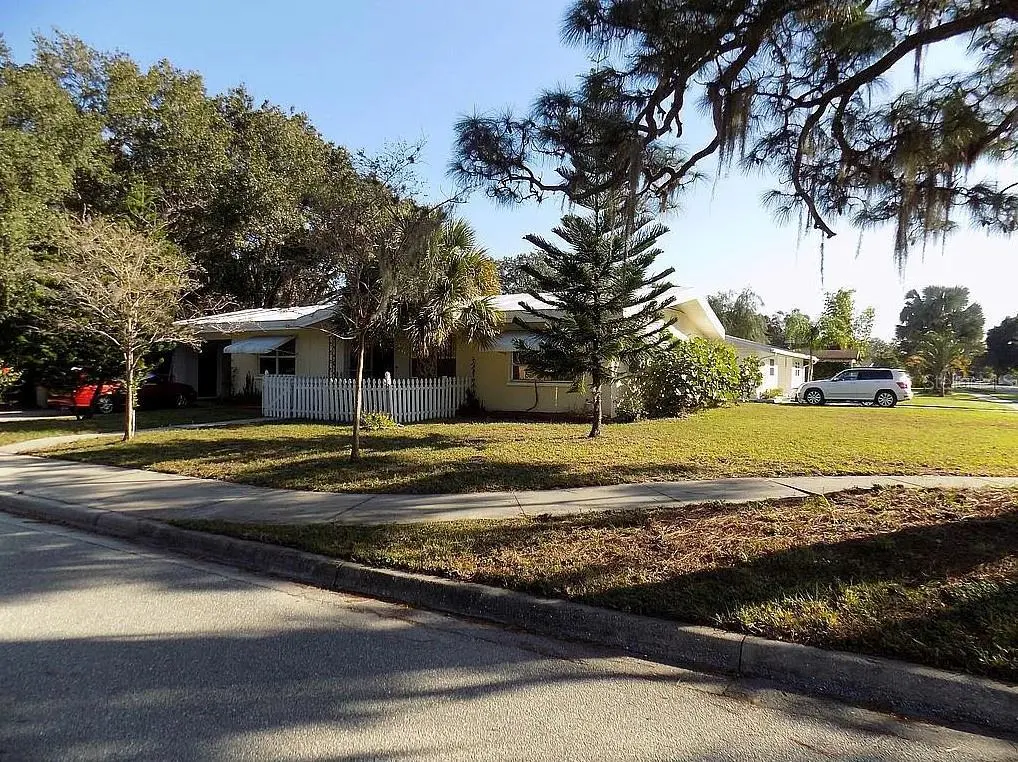
2695 S East Ave · Sarasota, FL
Flood risk 3/10 · Minor
- FEMA flood zone
- X (unshaded)
- Chance of flooding over 30 yrs
- 0.2%
- Est. flood insurance / yr
- $507 – $1,088
Fire risk 1/10 · Minimal
- Est. fire insurance / yr
- $947 – $1,759
Heat risk 10/10 · Severe
- Hot days now (above 107°F)
- 7 days/yr
- Hot days in 30 yrs
- 28 days/yr
Wind risk 10/10 · Severe
- Chance of severe wind over 30 yrs
- 99.0%
Air-quality risk 2/10 · Minimal
- Unhealthy air days now
- 1 days/yr
- Unhealthy air days in 30 yrs
- 1 days/yr
Risk factors via First Street. Map © Google.
Why this score? — see what drove the D+ grade
The composite is a weighted blend of 9 inputs, each scored 0–100. Each bar is that input's sub-score; the figure is the points it added to the 100-point composite (weight × sub-score).
- Cash flow +14.8/30.0
- ARV discount +7.5/15.0
- Schools +5.4/10.0
- DSCR +4.5/10.0
- 1% rule +4.0/10.0
- Livability +4.0/5.0
- Rent growth +3.2/5.0
- Condition / age +2.5/5.0
- Appreciation +0.0/10.0
$499,999
🖨 Deal sheet (PDF) 📄 Offer letter ✓ Due diligence
Multi-family units
County records classify this as Multi-Family (2-4 Unit). Listing-text estimate: 2 units. confirmed
Listing remarks
4/2 in Southside district close to all, 10 min to beaches, poss. duplex w poss. making into 1 family home of 4BR/2Ba, #tokenize if you want #btc. corner lot in quiet neighborhood of multi million dollar houses. Never flooded. almost garage and expanded driveway. can be furnished , washer, 2 sheds, lots of storage, fenced, You can move right in with just a suitcase. Lots of remodel done to this craftsman house: bath, driveway and patio expand, half new windows, newer cherry wood kitchen, painted inside and out, part tile, 4 ceilings, electric, ,A/C 2019, restuccoed, fence, insulation, power bills only $70/mo, landscaping. dishwasher, carport almost like garage (I have doors to install), alu
Key facts
- Lots of storage
- Never flooded
- Fenced
Tags
Property features AI
Exterior
- Home design: Built in 1957
- Construction: Living area approximately 2,100
- Exterior features: Located in the Arlington Park subdivision
Neighborhood map
What this means for you Summary
Snapshot
- This is a 2 × 2-bed/1-bath units multifamily listed at $500k.
Deal economics
- At list price, monthly cash flow is $137 ($2k/yr) — positive. Per door: $68/mo.
- The deal already cash-flows at list — no discount required.
- To meet the 1% rule (rent ≥ 1% of price), the offer needs to be $448k (10.3% below list).
- Recommended offer: $448k (10.3% below list) — sets the bar for 1% rule.
Location & tenants
- Location reads 80/100 on livability (#121 in FL, #1,854 nationally) — a professional / high-income tenant draw. Strengths: amenities A+, health & safety A+, commute A; Watch: crime F.
- Sarasota (urban): math 63% / reading 63% proficiency, ranked #7 of 73 in FL (top 10%) — acceptable for families but not a draw, mixed tenant base, ~2y average lease.
- Zoned schools: Southside Elementary School (math 79% / reading 81%, grade A+, #110 of 2,144 statewide, top 5%, 687 students, 26% FRL); Brookside Middle School (math 62% / reading 55%, grade B, #148 of 571 statewide, top 26%, 745 students, 66% FRL); Sarasota High School (math 53% / reading 59%, grade C, #131 of 667 statewide, top 20%, 2,528 students, 43% FRL) — zoned schools at 45% FRL track the district average.
- Market conditions: Rents rising (+2.6%/yr); 292 active listings in the ZIP; solid renter incomes; 7,466 units permitted in Sarasota County in 2024 (2,138 in 5+ unit buildings).
- At $4,484/mo this rent would consume 66% of the median local household income ($81k/yr) (locally 444% of renters already pay >50% of income on rent) — very limited rent-growth headroom before tenants either downsize or default.
Forward outlook
- Local home prices are declining (-3.0%/yr); year-one equity from $3k of loan paydown is wiped out by about $15k of value loss. Plan a longer hold.
- Sarasota County population projected at +20% by 2050 — long-run rental-demand tailwind backs the buy-and-hold thesis.
Negotiation context
- It's been on market 16 days — a 2% lower offer ($492k) is reasonable based on typical stale-listing flexibility.
- 12 sale attempts since 15y ago with the ask held roughly flat each time — persistent listings suggest the price (not the market) is what's stuck; bring a comps-based counter.
- Current owner paid $120k; list at $500k implies a 317% gain — meaningful room to come down on a strong offer.
Risks & watch-outs
- Watch-outs: built in 1957 — expect roof / HVAC / electrical / plumbing capex.
- Climate carrying-cost: severe wind risk, 99% chance of damaging wind over 30y; extreme-heat days projected 7→28/yr by 2055 (HVAC capex compounding) — expect insurance premiums to compound above CPI over the hold.
Questions for the listing agent
- Can we see the unit-by-unit rent roll, current vacancy, and any below-market leases? What's the average tenancy length?
- What capital expenditures (roof, boiler, parking lot, exteriors) have been made in the last 5 years, and what's planned in the next 2?
- Built in 1957 — when were the roof, HVAC, electrical panel, plumbing, and water heater last replaced?
- Is there a deadline driving the sale (1031 exchange, divorce, estate, relocation)? That informs how much negotiation room exists.
- Schools are B-rated — typically a magnet for longer-tenancy family renters. What's the average tenant stay here, and is there a school-zone premium baked into asking?
- Crime grade is F in this area — have there been break-ins, vandalism, or insurance claims at this property in the last 3 years? What carrier currently insures it and at what premium?
- The area grade is low — what's the realistic commute time and amenity access for the typical tenant pool here? Any planned neighborhood developments (good or bad) we should know about?
- What's the average days-on-market for RENTAL listings here right now (not sales)? A rising rental-DOM trend means longer vacancies and softer asking-rent achievability than the comps imply.
- What's the recent tenant-quality profile in this submarket — average credit score on applications, eviction rate, late-payment / NSF rate, and stable-employment percentage? A property-management company in the area should have these aggregated.
- How much new apartment / multifamily construction is in the pipeline within 1–3 miles? Heavy new supply (>2% of stock underway) typically softens rents 12–24 months out; light construction supports rent growth.
Investment metrics
- 1% rule
- 0.90% ✗
- Cap rate
- 6.62%
- Cash-on-cash
- 1.17%
- DSCR
- 1.05
- GRM
- 9.3
CMA / ARV
No comps found within radius.
Projected returns pro-forma
-3.0% appreciation · 2.62% rent growth · sell at horizon
- IRR
- -14.8%
- Equity multiple
- 0.47×
- Total profit
- $-73,986
- Equity at exit
- $74,551
- IRR
- -6.8%
- Equity multiple
- 0.57×
- Total profit
- $-60,018
- Equity at exit
- $43,231
Cash invested: $140,000 (down + closing). Projections, not guarantees.
Landlord ↔ Tenant lean methodology
- Overall (STATE)
- 87 Strongly Landlord-Friendly
- State Florida
- 87 Strongly Landlord-Friendly · R+3
- County
- — inherits STATE
- City
- — inherits STATE
ZIP-level market 34239
- Rents YoY
- 2.6%
- Active inventory
- 292
- Price-to-rent
- 18.6×
Monthly cashflow live
- Estimated rent
- $4,484 medium interval (Pro) →
- Mortgage (P&I)
- −$2,622
- Tax from tax record
- −$575 /mo · $6,903/yr
- Insurance
- −$208
- HOA
- −$0
- Vacancy / Maint / Mgmt
- −$942
- Net cashflow
- $137
Break-even live
Sensitivity live
| Price | -10% $420 | -5% $278 | +0% $137 | +5% $-5 | +10% $-146 |
|---|---|---|---|---|---|
| Rent | -10% $-218 | -5% $-40 | +0% $137 | +5% $314 | +10% $491 |
| Rate | -1.0pp $389 | -0.5pp $264 | base $137 | +0.5pp $7 | +1.0pp $-125 |
2-unit breakdown (identical units grouped — click to expand)
| Units | Beds | Baths | Est. rent |
|---|---|---|---|
| 2× units | 2 | 1 | $4,484 |
| #1 | 2 | 1 | $2,242 |
| #2 | 2 | 1 | $2,242 |
| Total (2 units) | $4,484 | ||
UW: 25.0% down · 7.5% · 30yr · 1.5% tax · 5.0% vac · 8.0% maint · 8.0% mgmt
Financing live
Cash to close
- Down payment
- $125,000
- Closing costs
- $15,000
- Reserves months
- —
- Total cash needed
- —
Loan-product check · same deal, 3 products live
Conventional
25% down · 7.5% · 30yr
- Down + closing
- —
- Monthly P&I
- —
- Monthly cashflow
- —
- DSCR
- —
- Eligible?
- —
Personal DTI + credit; lowest rate.
DSCR
20% down · 8.5% · 30yr
- Down + closing
- —
- Monthly P&I
- —
- Monthly cashflow
- —
- DSCR
- —
- Eligible?
- —
No personal income docs; deal must DSCR.
Hard money
10% down · 12.0% · 12mo
- Down + closing
- —
- Monthly P&I
- —
- Monthly cashflow
- —
- DSCR
- —
- Eligible?
- —
Short-term bridge; refi at stabilization.
Listing history 44 events
-
2026-06-21days on market $499,999 Active 16 DOM
-
2026-06-18days on market $499,999 Active 13 DOM
-
2026-06-17days on market $499,999 Active 12 DOM
-
2026-06-15days on market $499,999 Active 10 DOM
-
2026-06-13days on market $499,999 Active 8 DOM
-
2026-06-13days on market $499,999 Active 7 DOM
-
2026-06-10days on market $499,999 Active 5 DOM
-
2026-06-09days on market $499,999 Active 4 DOM
-
2026-06-08remarks 699-char remark
-
2026-06-08pricedays on market $499,999 Active 2 DOM
-
2026-05-08price $489,999 205-char remark
-
2026-03-16$499,999 Active 205-char remark
-
2026-03-14historical
-
2026-03-01price $495,000
-
2025-12-28price $499,999
-
2025-10-22$524,900 Active
-
2025-08-13price $499,999
-
2025-07-06price $524,999
-
2025-02-08price $540,900
-
2024-12-30price $545,900
-
2024-12-12$549,990 Active
-
2024-12-11historical
-
2024-11-01$549,900 Active
-
2024-10-13historical
-
2024-09-25status Active
-
2024-09-24status Pending
-
2024-09-16price $547,000
-
2024-08-28price $549,000
-
2024-08-13price $599,999
-
2024-08-13$699,999 Active
-
2024-05-21historical
-
2023-12-29price $599,999
-
2023-11-21$649,999 Active
-
2023-11-20historical
-
2023-10-11$699,990 Active
-
2023-02-28historical
-
2022-08-26price $565,990
-
2022-07-01price $579,990
-
2022-02-28$599,990 Active
-
2022-02-10$649,000 Active
-
2011-09-09soldstatus $120,000
-
2011-09-08soldstatus $120,000
-
2011-08-04$132,000
-
1993-12-06soldstatus $84,000
ⓘ Source: listings_history table (triggers on properties + properties_extension) + one-shot
backfill from property_details.listing_events for pre-trigger history.
Tax reassessment forecast FL · Resets to sale price
- Current annual tax
- $6,903 · $575/mo
- Projected year-2 tax
- $6,903 · $575/mo
- Expected delta
- $0/yr ($0/mo · 0.0%)
ⓘ Screening estimate from a state-policy table — verify with the county assessor before closing.
Climate risk First Street
- Flood 3/10 Moderate FEMA zone X (unshaded) · 20% chance over 30 yrs
- Wildfire 1/10 Low
- Heat 10/10 Extreme 7 d/yr ≥107°F today · 28 d/yr by 30 yrs out
- Wind 10/10 Extreme 99% chance of damaging wind over 30 yrs
- Air quality 2/10 Low 1 unhealthy d/yr today · 1 by 30 yrs out
Nearby sold comps map
Loading sold comps map…
Walkable amenities ~0.75 mi
Loading nearby amenities…
Taxation est. · year 1
- Rental income
- $53,808
- − Mortgage interest
- −$28,008
- − Property taxes
- −$6,903
- − Insurance
- −$2,500
- − Repairs & maintenance
- −$4,305
- − Management
- −$4,305
- − Depreciation
- −$14,545
- Taxable loss
- −$6,758
- Est. tax savings @ 24.0%
- +$1,622
- After-tax cash flow
- $3,262/yr
For passive investors: Depreciation is non-cash, so a rental often shows a tax loss while cash-flowing — sheltering income. Rental losses are passive: they offset passive income freely, and up to $25,000/yr can offset ordinary (W-2) income if you actively participate and your MAGI is under $100k (phasing out to $0 by $150k); unused losses carry forward. On sale, claimed depreciation is recaptured at up to 25%, and gains may owe capital-gains tax (a 1031 exchange can defer both). Figures are a year-1 estimate at your 24.0% rate — not tax advice; consult a CPA.
Schools (NCES district)
- District
- Sarasota
- NCES district ID
- 1201680
- Math proficiency
- 63% ▼ -8.00%
- Reading proficiency
- 63% ▼ -3.00%
- Median HH income
- $51,167
- Composite
- 53.68/100
- National rank
- #1428
- State rank
- #7 of 73 in FL
Livability — Sarasota
- Score
- 80/100
- State rank
- #121
- US rank
- #1854
Category grades
Schools grade is shown separately in the Schools card above.
Census & demographics
- Census place
- Sarasota, FL
- County
- Sarasota County · 448,376 people
- City population
- 261,896
- Metro
- North Port-Sarasota-Bradenton, FL
- Population (ZIP)
- 14,635
- Household income
- $80,923
- Rent vs Own
- Severe rent burden
- 444.0
Population outlook (Sarasota County) Hauer SSP2
- Today (2025)
- 452,380 people
- By 2030
- 474,175 · +4.8%
- By 2040
- 511,577 · +13.1%
- By 2050
- 541,467 · +19.7%
- By 2075
- 604,947 · +33.7%
- By 2100
- 621,965 · +37.5%
Race, ethnicity, and origin ACS 2023
- Neighborhood character
- Predominantly White (79%)
- Race & ethnicity
- White 79% Hispanic / Latino 13% Two or more races 12% Black 3% Asian 1%
- Hispanic origin (detail)
- Mexican 3% Puerto Rican 1%
- Common ancestry
- Italian 4% Romanian 3% Lithuanian 2%
- Foreign-born
- 11% · Canada, Jamaica, Dominican Republic
- Languages at home
- 85% English-only · Spanish 11% German/W. Germanic 1% Other Indo-European 1%
Political lean MEDSL · Sarasota
- 2024 margin
- R (+18.2) · D 40.5% · R 58.7%
- 2008→2024 swing
- -18.1pp toward R · 2008: -0.1pp · 2024: -18.2pp
- All cycles
- 2024: R+18.2 2020: R+10.4 2016: R+11.6 2012: R+7.4 2008: R+0.1
Not yet ingested
- Civics
- —
Market trends
- HPI YoY
- ▼ -623.50%
- Current HPI
- 377.4184
- Rent YoY
- ▲ 2.62%
- Metro
- North Port-Sarasota-Bradenton, FL
- State GDP YoY
- ▲ 3.28%
- F500 in state
- 36
Industry mix (Fortune 500 HQ in FL)
| Industry | F500 HQs | Revenue |
|---|---|---|
| Industrial Technology | 2 | $29B |
|
||
| Insurance | 2 | $17B |
|
||
| Retail | 1 | $60B |
|
||
| Technology Distribution | 1 | $58B |
|
||
| Homebuilding | 1 | $35B |
|
||
| Technology Manufacturing | 1 | $35B |
|
||
Price history
+495.2% since first listed35 events — show timeline
- 2026-06-05 Listed $499,999 FSBO.com
- 2026-05-08 Price Changed $489,999 Stellar MLS as Distributed by MLS Grid
- 2026-03-16 Listed $499,999 Stellar MLS as Distributed by MLS Grid
- 2026-03-14 Listing Removed — Stellar MLS as Distributed by MLS Grid
- 2026-03-01 Price Changed $495,000 Stellar MLS as Distributed by MLS Grid
- 2025-12-28 Price Changed $499,999 Stellar MLS as Distributed by MLS Grid
- 2025-10-22 Listed $524,900 Stellar MLS as Distributed by MLS Grid
- 2025-08-13 Price Changed $499,999 Stellar MLS as Distributed by MLS Grid
- 2025-07-06 Price Changed $524,999 Stellar MLS as Distributed by MLS Grid
- 2025-02-08 Price Changed $540,900 Stellar MLS as Distributed by MLS Grid
- 2024-12-30 Price Changed $545,900 Stellar MLS as Distributed by MLS Grid
- 2024-12-12 Listed $549,990 Stellar MLS as Distributed by MLS Grid
- 2024-12-11 Listing Removed — Stellar MLS as Distributed by MLS Grid
- 2024-11-01 Listed $549,900 Stellar MLS as Distributed by MLS Grid
- 2024-10-13 Listing Removed — Stellar MLS as Distributed by MLS Grid
- 2024-09-25 Relisted — Stellar MLS as Distributed by MLS Grid
- 2024-09-24 Pending — Stellar MLS as Distributed by MLS Grid
- 2024-09-16 Price Changed $547,000 Stellar MLS as Distributed by MLS Grid
- 2024-08-28 Price Changed $549,000 Stellar MLS as Distributed by MLS Grid
- 2024-08-13 Price Changed $599,999 Stellar MLS as Distributed by MLS Grid
- 2024-08-13 Listed $699,999 Stellar MLS as Distributed by MLS Grid
- 2024-05-21 Listing Removed — Stellar MLS as Distributed by MLS Grid
- 2023-12-29 Price Changed $599,999 Stellar MLS as Distributed by MLS Grid
- 2023-11-21 Listed $649,999 Stellar MLS as Distributed by MLS Grid
- 2023-11-20 Listing Removed — Stellar MLS as Distributed by MLS Grid
- 2023-10-11 Listed $699,990 Stellar MLS as Distributed by MLS Grid
- 2023-02-28 Listing Removed — Stellar MLS as Distributed by MLS Grid
- 2022-08-26 Price Changed $565,990 Stellar MLS as Distributed by MLS Grid
- 2022-07-01 Price Changed $579,990 Stellar MLS as Distributed by MLS Grid
- 2022-02-28 Listed $599,990 Stellar MLS as Distributed by MLS Grid
- 2022-02-10 Listed $649,000 Stellar MLS as Distributed by MLS Grid
- 2011-09-09 Sold (Public Records) $120,000 Public Records
- 2011-09-08 Sold (MLS) $120,000 Stellar MLS as Distributed by MLS Grid
- 2011-08-04 Listed $132,000 Stellar MLS as Distributed by MLS Grid
- 1993-12-06 Sold (Public Records) $84,000 Public Records
Property tax history
+12.1%/yrLatest (2025): $6,903 · -0.5% YoY. Source: county tax records.
Cash-flow waterfall
monthlySold comps — $/sqft
last 12 mo · ≤1 miLoading sold comps…