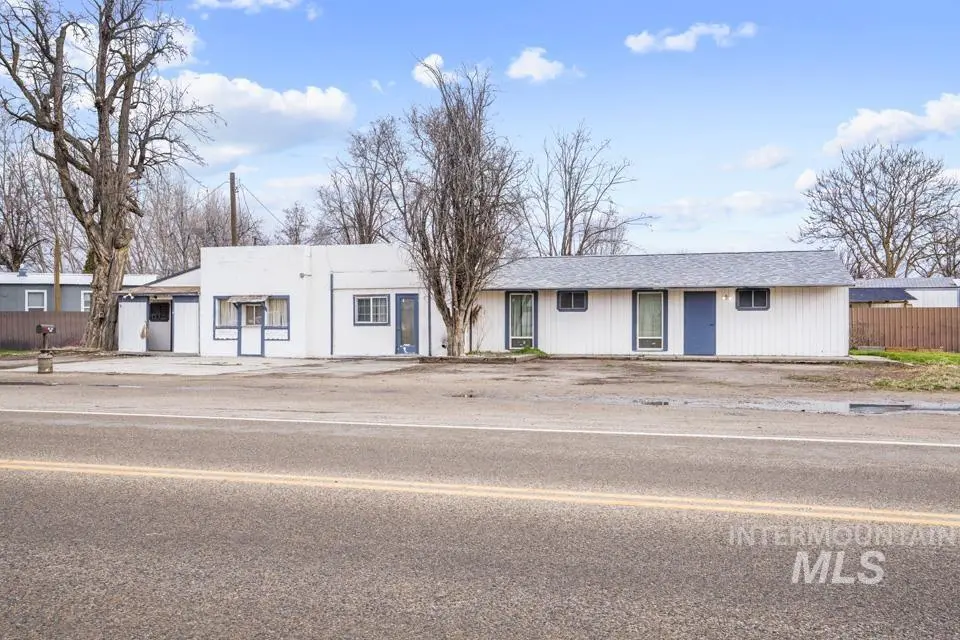
321 Southeast Ave · New Plymouth, ID
Flood risk 1/10 · Minimal
- FEMA flood zone
- —
- Chance of flooding over 30 yrs
- 0.0%
- Est. flood insurance / yr
- —
Fire risk 2/10 · Minimal
- Est. fire insurance / yr
- $584 – $1,086
Heat risk 4/10 · Minor
- Hot days now (above 98°F)
- 7 days/yr
- Hot days in 30 yrs
- 19 days/yr
Wind risk 1/10 · Minimal
- Chance of severe wind over 30 yrs
- —
Air-quality risk 7/10 · Major
- Unhealthy air days now
- 10 days/yr
- Unhealthy air days in 30 yrs
- 16 days/yr
Risk factors via First Street. Map © Google.
Why this score? — see what drove the B- grade
The composite is a weighted blend of 9 inputs, each scored 0–100. Each bar is that input's sub-score; the figure is the points it added to the 100-point composite (weight × sub-score).
- Cash flow +30.0/30.0
- DSCR +10.0/10.0
- ARV discount +7.5/15.0
- 1% rule +7.4/10.0
- Schools +4.6/10.0
- Livability +3.4/5.0
- Rent growth +2.5/5.0
- Condition / age +2.5/5.0
- Appreciation +0.0/10.0
$149,000
🖨 Deal sheet (PDF) 📄 Offer letter ✓ Due diligence
Listing remarks
Visibility, flexibility & location — this 1,800 sq ft commercial property in New Plymouth sits on . 22 acres w/ direct highway frontage, putting it in front of traffic every single day. Close to downtown & schools, the positioning alone makes this one worth a serious look. Currently configured for commercial use, the layout offers dedicated areas for office space, a kitchen, bathroom & ample storage — functional as-is and adaptable to nearly any vision. A conditional use permit opens the door to residential use, making this one of the rare properties where the end use is still yours to define. Ample on-site parking removes a barrier that stops most commercial c
Key facts
- Ample storage space
- Highway frontage
- Easy access
Tags
Property features AI
Finance
- Other: Current use listed as single family and 2–4 units
Exterior
- Utilities: City water service; Sewer connected; Public paved road frontage
- Home design: Single family residence; Built in 1920; Composition roof
- Construction: Brick and synthetic exterior; Slab foundation
- Exterior features: Metal fencing; Corner lot; Standard lot (approx. 6,000–9,999 sq ft)
Interior
- Kitchen: Microwave; Oven/Range (freestanding); Refrigerator
- Bedrooms: 4 bedrooms (all on the main level)
- Flooring: Concrete
- Bathrooms: 1 bathroom
- Heating & cooling: Heating present (other type); No central cooling
- Interior features: Den/office; Fireplace with pellet stove
- Laundry & utility: Electric water heater
Neighborhood map
What this means for you Summary
Snapshot
- This is a 4-bed/1.0-bath single-family listed at $149k.
Deal economics
- At list price, monthly cash flow is $561 ($7k/yr) — positive.
- The deal already cash-flows at list — no discount required.
- Meets the 1% rule at list price ($2k rent vs $149k).
- Recommended offer: $136k (9.0% below list) — sets the bar for market timing.
- Cap rate 10.8% vs local median 1.9% in New Plymouth — top-decile yield for the area; either an underpriced asset or a hidden risk that comps aren't pricing in. Stress-test before assuming the spread holds.
Location & tenants
- Location reads 67/100 on livability (#103 in ID) — a middle-class / working-renter tenant base. Strengths: crime A+, cost of living A+, housing A+; Watch: employment D, amenities F, commute F.
- New Plymouth District (rural): math 46% / reading 64% proficiency, ranked #18 of 92 in ID (top 20%) — acceptable for families but not a draw, mixed tenant base, ~2y average lease.
- Zoned schools: New Plymouth Elementary (math 48% / reading 63%, grade C, #104 of 357 statewide, top 29%, 456 students, 42% FRL); New Plymouth Middle School (math 50% / reading 65%, grade B, #13 of 109 statewide, top 11%, 228 students, 33% FRL); New Plymouth High School (math 22% / reading 62%, grade F, #72 of 169 statewide, top 47%, 306 students, 26% FRL).
- Market conditions: 65 active listings in the ZIP; 1 comparable units currently listed for rent nearby; 230 units permitted in Payette County in 2024 (0 in 5+ unit buildings).
Forward outlook
- Local home prices are declining (-3.0%/yr); year-one equity from $1k of loan paydown is wiped out by about $4k of value loss. Plan a longer hold.
- At projected returns (-3.0% appreciation + 3.0% rent growth), your $42k cash investment doubles in ~8 years — after that, you're playing with house money.
Negotiation context
- It's been on market 96 days — a 9% lower offer ($136k) is reasonable based on typical stale-listing flexibility.
- 3 sale attempts since 9y ago; this cycle's ask has dropped $39k (21%) from the opening price — seller is motivated, your offer sets the floor, not the list.
Risks & watch-outs
- Watch-outs: built in 1920 — expect roof / HVAC / electrical / plumbing capex.
Questions for the listing agent
- It's been on market 96 days. Have you received any prior offers? Is the seller open to a 9% concession, seller financing, or rate buy-down credit?
- Built in 1920 — when were the roof, HVAC, electrical panel, plumbing, and water heater last replaced?
- Why hasn't it sold? Are there any deal-killer items the seller is aware of (foundation, flood, title, zoning, code violations)?
- Is there a deadline driving the sale (1031 exchange, divorce, estate, relocation)? That informs how much negotiation room exists.
- What's the average days-on-market for RENTAL listings here right now (not sales)? A rising rental-DOM trend means longer vacancies and softer asking-rent achievability than the comps imply.
- What's the recent tenant-quality profile in this submarket — average credit score on applications, eviction rate, late-payment / NSF rate, and stable-employment percentage? A property-management company in the area should have these aggregated.
- How much new for-sale + rental construction is in the pipeline within 1–3 miles? Heavy new supply typically softens prices + rents 12–24 months out; constrained supply supports both.
Investment metrics
- 1% rule
- 1.24% ✓
- Cap rate
- 10.81%
- Cash-on-cash
- 16.14%
- DSCR
- 1.72
- GRM
- 6.7
CMA / ARV
- ARV (on-the-fly)
- $435,600
- Comps found
- 12
Show comp detail 12 sales within ~0.75 mi
| Address | Dist | Beds/Ba | Sqft | Sold | Price | $/sf | Match |
|---|---|---|---|---|---|---|---|
| 3333 Flight Deck Dr | 0.17mi | 4/2.0 | 1,883 (+5%) | 4mo | $749,500 | $398 | 78 |
| 205 E Garret St | 0.30mi | 4/2.0 | 1,808 (+0%) | 6mo | $449,000 | $248 | 77 |
| 218 W Elm St | 0.34mi | 3/2.0 (-1) | 1,820 (+1%) | 1mo | $375,000 | $206 | 72 |
| 502 Farm Creek Ave | 0.49mi | 4/2.0 | 1,825 (+1%) | 6mo | $421,500 | $231 | 66 |
| 5943 Hwy 30 S | 0.27mi | 3/2.5 (-1) | 1,680 (-7%) | 2mo | $524,900 | $312 | 64 |
| 501 Grand Harvest Ave | 0.63mi | 4/2.0 | 1,827 (+2%) | 1mo | $449,000 | $246 | 64 |
| 206 W Blvd | 0.46mi | 3/2.0 (-1) | 1,801 (+0%) | 10mo | $452,000 | $251 | 61 |
| 283 SE Blvd | 0.21mi | 3/2.0 (-1) | 1,560 (-13%) | 3mo | $340,000 | $218 | 56 |
| 502 E Idaho St Unit C | 0.42mi | 3/2.0 (-1) | 1,620 (-10%) | 0mo | $229,000 | $141 | 54 |
| 425 October Sky St | 0.53mi | 4/2.0 | 1,657 (-8%) | 9mo | $399,999 | $241 | 51 |
| 509 Pine St | 0.65mi | 3/2.0 (-1) | 1,694 (-6%) | 2mo | $409,990 | $242 | 50 |
| 4320 SW 2nd Ave | 0.57mi | 4/2.5 | 1,952 (+8%) | 6mo | $439,000 | $225 | 48 |
Match score weights: distance 35% · size 25% · config 20% · recency 20%. Top-matched comps best support the ARV.
Projected returns pro-forma
-3.0% appreciation · 3.0% rent growth · sell at horizon
- IRR
- 7.1%
- Equity multiple
- 1.28×
- Total profit
- $11,535
- Equity at exit
- $22,216
- IRR
- 16.4%
- Equity multiple
- 2.34×
- Total profit
- $55,845
- Equity at exit
- $12,883
Cash invested: $41,720 (down + closing). Projections, not guarantees.
Landlord ↔ Tenant lean methodology
- Overall (STATE)
- 91 Strongly Landlord-Friendly
- State Idaho
- 91 Strongly Landlord-Friendly · R+18
- County
- — inherits STATE
- City
- — inherits STATE
ZIP-level market 83655
- Home prices YoY
- -9.5%
- Active inventory
- 65
- Price-to-rent
- 6.7×
Monthly cashflow live
- Estimated rent
- $1,850 medium interval (Pro) →
- Mortgage (P&I)
- −$781
- Tax from tax record
- −$57 /mo · $684/yr
- Insurance
- −$62
- HOA
- −$0
- Vacancy / Maint / Mgmt
- −$388
- Net cashflow
- $561
Break-even live
Sensitivity live
| Price | -10% $645 | -5% $603 | +0% $561 | +5% $519 | +10% $477 |
|---|---|---|---|---|---|
| Rent | -10% $415 | -5% $488 | +0% $561 | +5% $634 | +10% $707 |
| Rate | -1.0pp $636 | -0.5pp $599 | base $561 | +0.5pp $522 | +1.0pp $483 |
UW: 25.0% down · 7.5% · 30yr · 1.5% tax · 5.0% vac · 8.0% maint · 8.0% mgmt
Financing live
Cash to close
- Down payment
- $37,250
- Closing costs
- $4,470
- Reserves months
- —
- Total cash needed
- —
Loan-product check · same deal, 3 products live
Conventional
25% down · 7.5% · 30yr
- Down + closing
- —
- Monthly P&I
- —
- Monthly cashflow
- —
- DSCR
- —
- Eligible?
- —
Personal DTI + credit; lowest rate.
DSCR
20% down · 8.5% · 30yr
- Down + closing
- —
- Monthly P&I
- —
- Monthly cashflow
- —
- DSCR
- —
- Eligible?
- —
No personal income docs; deal must DSCR.
Hard money
10% down · 12.0% · 12mo
- Down + closing
- —
- Monthly P&I
- —
- Monthly cashflow
- —
- DSCR
- —
- Eligible?
- —
Short-term bridge; refi at stabilization.
Rent comps 1 comps
| Address | Beds | Baths | Sqft | Rent | $/sqft | DOM | Units | Dist |
|---|---|---|---|---|---|---|---|---|
| 118 Holly Ave Unit B New Plymouth, ID | 3.0 | 2.5 | 1332 | $1,850 | $1.39 | 16d | 1 | 0.17mi |
Listing history 22 events
-
2026-06-22days on market $149,000 Active 96 DOM
-
2026-06-18days on market $149,000 Active 93 DOM
-
2026-06-17days on market $149,000 Active 92 DOM
-
2026-06-16days on market $149,000 Active 91 DOM
-
2026-06-15days on market $149,000 Active 90 DOM
-
2026-06-13days on market $149,000 Active 88 DOM
-
2026-06-13days on market $149,000 Active 87 DOM
-
2026-06-10days on market $149,000 Active 85 DOM
-
2026-06-09days on market $149,000 Active 84 DOM
-
2026-06-08days on market $149,000 Active 83 DOM
-
2026-06-07pricedays on market $149,000 Active 82 DOM
-
2026-06-05days on market $179,000 Active 79 DOM
-
2026-06-03days on market $179,000 Active 78 DOM
-
2026-06-03days on market $179,000 Active 77 DOM
-
2026-06-01days on market $179,000 Active 76 DOM
-
2026-05-31days on market $179,000 Active 75 DOM
-
2026-03-24price $179,000
-
2026-03-17$188,000 Active
-
2026-01-15historical
-
2025-12-11$199,000 Active
-
2017-12-07historical
-
2017-08-10$95,000 Active
ⓘ Source: listings_history table (triggers on properties + properties_extension) + one-shot
backfill from property_details.listing_events for pre-trigger history.
Tax reassessment forecast ID · Resets to sale price
- Current annual tax
- $684 · $57/mo
- Projected year-2 tax
- $1,028 · $86/mo
- Expected delta
- +$344/yr (+$29/mo · 50.2%)
ⓘ Screening estimate from a state-policy table — verify with the county assessor before closing.
Climate risk First Street
- Flood 1/10 Low 0% chance over 30 yrs
- Wildfire 2/10 Low
- Heat 4/10 Moderate 7 d/yr ≥98°F today · 19 d/yr by 30 yrs out
- Wind 1/10 Low
- Air quality 7/10 Severe 10 unhealthy d/yr today · 16 by 30 yrs out
Nearby sold comps map
Loading sold comps map…
Walkable amenities ~0.75 mi
Loading nearby amenities…
Taxation est. · year 1
- Rental income
- $22,200
- − Mortgage interest
- −$8,346
- − Property taxes
- −$684
- − Insurance
- −$745
- − Repairs & maintenance
- −$1,776
- − Management
- −$1,776
- − Depreciation
- −$4,335
- Taxable income
- $4,538
- Est. tax owed @ 24.0%
- −$1,089
- After-tax cash flow
- $5,643/yr
For passive investors: Depreciation is non-cash, so a rental often shows a tax loss while cash-flowing — sheltering income. Rental losses are passive: they offset passive income freely, and up to $25,000/yr can offset ordinary (W-2) income if you actively participate and your MAGI is under $100k (phasing out to $0 by $150k); unused losses carry forward. On sale, claimed depreciation is recaptured at up to 25%, and gains may owe capital-gains tax (a 1031 exchange can defer both). Figures are a year-1 estimate at your 24.0% rate — not tax advice; consult a CPA.
Schools (NCES district)
- District
- New Plymouth District
- NCES district ID
- 1602370
- Math proficiency
- 46% ▼ -2.00%
- Reading proficiency
- 64% ▲ 4.00%
- Median HH income
- $45,237
- Composite
- 46.4/100
- National rank
- #2456
- State rank
- #18 of 92 in ID
Livability — New Plymouth
- Score
- 67/100
- State rank
- #103
- US rank
- #11174
Category grades
Schools grade is shown separately in the Schools card above.
Census & demographics
- Census place
- New Plymouth, ID
- Population (ZIP)
- 5,666
Population outlook (Payette County) Hauer SSP2
- Today (2025)
- 23,392 people
- By 2030
- 23,523 · +0.6%
- By 2040
- 23,792 · +1.7%
- By 2050
- 24,002 · +2.6%
- By 2075
- 25,286 · +8.1%
- By 2100
- 26,673 · +14.0%
Race, ethnicity, and origin ACS 2023
- Neighborhood character
- Predominantly White (89%)
- Race & ethnicity
- White 89% Hispanic / Latino 7% Two or more races 7%
- Hispanic origin (detail)
- Mexican 5%
- Common ancestry
- Slovak 3% Italian 3% Lithuanian 2%
- Foreign-born
- 2% · Canada
- Languages at home
- 96% English-only · Spanish 2% German/W. Germanic 1%
Political lean MEDSL · Payette
- 2024 margin
- Solid R (+62.9) · D 17.6% · R 80.4% · Other 2.0%
- 2008→2024 swing
- -21.4pp toward R · 2008: -41.5pp · 2024: -62.9pp
- All cycles
- 2024: R+62.9 2020: R+59.3 2016: R+59.9 2012: R+44.0 2008: R+41.5
Not yet ingested
- Civics
- —
Market trends
- HPI YoY
- ▼ -37.13%
- Current HPI
- 352.0983
- Rent YoY
- —
- Metro
- —
- State GDP YoY
- ▲ 4.51%
- F500 in state
- 6
Industry mix (Fortune 500 HQ in ID)
| Industry | F500 HQs | Revenue |
|---|---|---|
| Retail | 1 | $79B |
|
||
| Technology | 1 | $25B |
|
||
| Food / Agriculture | 1 | $6B |
|
||
Price history
+88.4% since first listed6 events — show timeline
- 2026-03-24 Price Changed $179,000 IMLS
- 2026-03-17 Listed $188,000 IMLS
- 2026-01-15 Listing Removed — IMLS
- 2025-12-11 Listed $199,000 IMLS
- 2017-12-07 Listing Removed — IMLS
- 2017-08-10 Listed $95,000 IMLS
Property tax history
+9.4%/yrLatest (2025): $684 · +1.7% YoY. Source: county tax records.
Cash-flow waterfall
monthlySold comps — $/sqft
last 12 mo · ≤1 miLoading sold comps…