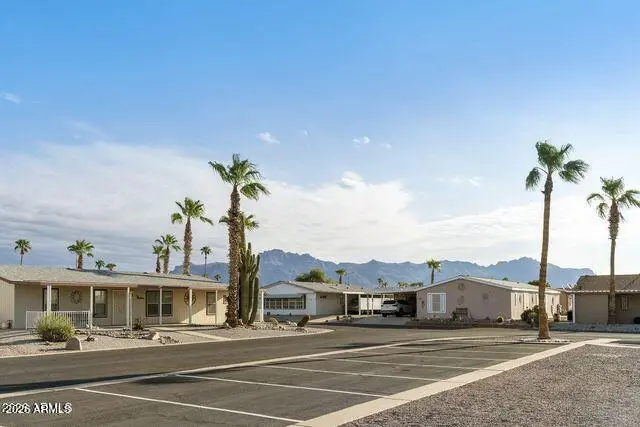
555 W Warner Rd #134 · Chandler, AZ
Flood risk 1/10 · Minimal
- FEMA flood zone
- X (shaded)
- Chance of flooding over 30 yrs
- 0.0%
- Est. flood insurance / yr
- $507 – $1,088
Fire risk 1/10 · Minimal
- Est. fire insurance / yr
- $610 – $1,132
Heat risk 9/10 · Severe
- Hot days now (above 111°F)
- 7 days/yr
- Hot days in 30 yrs
- 19 days/yr
Wind risk 1/10 · Minimal
- Chance of severe wind over 30 yrs
- —
Air-quality risk 2/10 · Minimal
- Unhealthy air days now
- 0 days/yr
- Unhealthy air days in 30 yrs
- 1 days/yr
Risk factors via First Street. Map © Google.
Why this score? — see what drove the C- grade
The composite is a weighted blend of 9 inputs, each scored 0–100. Each bar is that input's sub-score; the figure is the points it added to the 100-point composite (weight × sub-score).
- Cash flow +15.0/30.0
- ARV discount +15.0/15.0
- 1% rule +5.0/10.0
- DSCR +5.0/10.0
- Schools +4.8/10.0
- Livability +3.9/5.0
- Condition / age +3.8/5.0
- Rent growth +2.1/5.0
- Appreciation +0.0/10.0
$45,000
🖨 Deal sheet 📄 Offer letter ✓ Due diligence
Listing remarks
Welcome to this charming 3 bedroom, 2 bathroom home tucked away toward the back of a quiet, well-maintained community. Inside, you'll find spacious living areas, large walk-in closets, newer flooring, and tasteful updates throughout the kitchen and bathrooms. The functional layout also features a full-size laundry room and plenty of storage space. Whether you're looking for a full-time residence or seasonal retreat, this home offers comfort, privacy, and the opportunity to make it your own with any finishing touches you desire.
Key facts
- 2 parking spots
- Community pool
- Built 1965
Property features AI
Finance
- HOA & community: Land lease of $795 monthly; Association covers grounds maintenance and other community items; Community pool; Playground
Exterior
- Parking: 2 open parking spaces
- Utilities: City water; Public sewer
- Home design: Manufactured/mobile home; Leasehold ownership; Asphalt road access
- Construction: Wood siding; Wood frame construction; Composition roof
- Exterior features: Screened-in patio(s); Gravel/stone front yard; Gravel/stone backyard; Private maintained road
Interior
- Kitchen: Built-in microwave; Refrigerator; Dishwasher; Garbage disposal; Kitchen island; Breakfast bar
- Bedrooms: Up to 3 bedrooms
- Flooring: Laminate; Vinyl; Other
- Bathrooms: 2 full bathrooms
- Heating & cooling: Heat pump heating; Electric heating; Ceiling fans; Programmable thermostat; Window/wall air conditioning units
- Interior features: High-speed internet; Breakfast bar; Kitchen island; Full bath in master bedroom; Dual pane windows; ENERGY STAR qualified windows; Tinted windows
- Laundry & utility: Washer/dryer hookup only; Gas dryer hookup
Neighborhood map
What this means for you Summary
Snapshot
- This is a 3-bed/2.0-bath manufactured listed at $45k. Condition is rated good.
Deal economics
- At list price, monthly cash flow is $1k ($15k/yr) — positive.
- The deal already cash-flows at list — no discount required.
- Meets the 1% rule at list price ($2k rent vs $45k).
- Recommended offer: $44k (1.5% below list) — sets the bar for market timing.
- Cap rate 39.3% vs local median 3.3% in Chandler — top-decile yield for the area; either an underpriced asset or a hidden risk that comps aren't pricing in. Stress-test before assuming the spread holds.
Location & tenants
- Location reads 78/100 on livability (#9 in AZ, #2,508 nationally) — a middle-class / working-renter tenant base. Strengths: employment A+, housing A+, crime A-; Watch: health & safety D, cost of living D-.
- Chandler Unified District #80 (4242) (suburban): math 49% / reading 57% proficiency, ranked #31 of 249 in AZ (top 12%) — acceptable for families but not a draw, mixed tenant base, ~2y average lease.
- Zoned schools: Knox Gifted Academy (math 90% / reading 97%, grade A+, #1 of 1,109 statewide, top 0%, 672 students, 6% FRL); Willis Junior High School (math 28% / reading 36%, grade F, #73 of 218 statewide, top 35%, 865 students, 55% FRL); Chandler High School (math 25% / reading 32%, grade F, #133 of 381 statewide, top 35%, 3,597 students, 46% FRL).
- Market conditions: Rents soft (-1.7%/yr); 182 active listings in the ZIP; 38 comparable units currently listed for rent nearby; rentals leasing fast (median 13d on market — plan ~1-2 weeks tenant-placement turnaround); solid renter incomes; 36,011 units permitted in Maricopa County in 2024 (12,801 in 5+ unit buildings).
Forward outlook
- Local home prices are declining (-3.0%/yr); year-one equity from $311 of loan paydown is wiped out by about $1k of value loss. Plan a longer hold.
- Maricopa County population projected at +38% by 2050 — long-run rental-demand tailwind backs the buy-and-hold thesis.
- At projected returns (-3.0% appreciation + 0.0% rent growth), your $13k cash investment doubles in ~1 year — after that, you're playing with house money.
Negotiation context
- It's been on market 17 days — a 2% lower offer ($44k) is reasonable based on typical stale-listing flexibility.
Risks & watch-outs
- Climate carrying-cost: extreme-heat days projected 7→19/yr by 2055 (HVAC capex compounding) — expect insurance premiums to compound above CPI over the hold.
Questions for the listing agent
- Built in 1965 — when were the roof, HVAC, electrical panel, plumbing, and water heater last replaced?
- Is there a deadline driving the sale (1031 exchange, divorce, estate, relocation)? That informs how much negotiation room exists.
- Schools are B-rated — typically a magnet for longer-tenancy family renters. What's the average tenant stay here, and is there a school-zone premium baked into asking?
- What's the average days-on-market for RENTAL listings here right now (not sales)? A rising rental-DOM trend means longer vacancies and softer asking-rent achievability than the comps imply.
- What's the recent tenant-quality profile in this submarket — average credit score on applications, eviction rate, late-payment / NSF rate, and stable-employment percentage? A property-management company in the area should have these aggregated.
- How much new for-sale + rental construction is in the pipeline within 1–3 miles? Heavy new supply typically softens prices + rents 12–24 months out; constrained supply supports both.
Investment metrics
- 1% rule
- 4.35% ✓
- Cap rate
- 39.26%
- Cash-on-cash
- 117.75%
- DSCR
- 6.24
- GRM
- 1.9
CMA / ARV
- ARV (on-the-fly)
- $82,688
- Comps found
- 9
Show comp detail 9 sales within ~0.75 mi
| Address | Dist | Beds/Ba | Sqft | Sold | Price | $/sf | Match |
|---|---|---|---|---|---|---|---|
| 555 W Warner Rd #55 | 0.00mi | 3/2.0 | 1,104 (-9%) | 3mo | $74,955 | $68 | 82 |
| 1425 N Evergreen St | 0.32mi | 3/2.0 | 1,144 (-6%) | 3mo | $295,000 | $258 | 72 |
| 825 W Calle Del Norte -- | 0.38mi | 3/2.0 | 1,173 (-4%) | 16mo | $349,000 | $298 | 63 |
| 555 W Warner Rd #65 | 0.18mi | 3/2.0 | 1,088 (-10%) | 17mo | $112,000 | $103 | 60 |
| 200 E Knox Rd #104 | 0.73mi | 2/2.0 (-1) | 1,200 (-1%) | 4mo | $72,250 | $60 | 56 |
| 555 W Warner Rd #4 | 0.18mi | 3/2.0 | 1,065 (-12%) | 20mo | $130,000 | $122 | 54 |
| 200 E Knox Rd #63 | 0.73mi | 2/2.0 (-1) | 1,344 (+10%) | 7mo | $69,350 | $52 | 37 |
| 200 E Knox Rd #18 | 0.69mi | 2/2.0 (-1) | 1,056 (-13%) | 12mo | $52,900 | $50 | 31 |
| 200 E Knox Rd #60 | 0.69mi | 2/2.0 (-1) | 1,056 (-13%) | 18mo | $68,900 | $65 | 26 |
Match score weights: distance 35% · size 25% · config 20% · recency 20%. Top-matched comps best support the ARV.
Projected returns pro-forma
-3.0% appreciation · 0.0% rent growth · sell at horizon
- IRR
- —
- Equity multiple
- 6.22×
- Total profit
- $65,740
- Equity at exit
- $6,710
- IRR
- —
- Equity multiple
- 11.84×
- Total profit
- $136,576
- Equity at exit
- $3,891
Cash invested: $12,600 (down + closing). Projections, not guarantees.
Landlord ↔ Tenant lean methodology
- Overall (STATE)
- 87 Strongly Landlord-Friendly
- State Arizona
- 87 Strongly Landlord-Friendly · R+3
- County
- — inherits STATE
- City
- — inherits STATE
ZIP-level market 85225
- Home prices YoY
- -28.1%
- Rents YoY
- -1.7%
- Active inventory
- 182
- Price-to-rent
- 1.9×
Monthly cashflow live
- Estimated rent
- $1,959 high interval (Pro) →
- Mortgage (P&I)
- −$236
- Tax est. 1.5%
- −$56 /mo · $675/yr
- Insurance
- −$19
- HOA
- −$0
- Vacancy / Maint / Mgmt
- −$411
- Net cashflow
- $1,236
Break-even live
UW: 25.0% down · 7.5% · 30yr · 1.5% tax · 5.0% vac · 8.0% maint · 8.0% mgmt
Financing live
Cash to close
- Down payment
- $11,250
- Closing costs
- $1,350
- Reserves months
- —
- Total cash needed
- —
Loan-product check · same deal, 3 products live
Conventional
25% down · 7.5% · 30yr
- Down + closing
- —
- Monthly P&I
- —
- Monthly cashflow
- —
- DSCR
- —
- Eligible?
- —
Personal DTI + credit; lowest rate.
DSCR
20% down · 8.5% · 30yr
- Down + closing
- —
- Monthly P&I
- —
- Monthly cashflow
- —
- DSCR
- —
- Eligible?
- —
No personal income docs; deal must DSCR.
Hard money
10% down · 12.0% · 12mo
- Down + closing
- —
- Monthly P&I
- —
- Monthly cashflow
- —
- DSCR
- —
- Eligible?
- —
Short-term bridge; refi at stabilization.
Rent comps 38 comps
| Address | Beds | Baths | Sqft | Rent | $/sqft | DOM | Units | Dist |
|---|---|---|---|---|---|---|---|---|
| 1970 N Hartford St #62 Chandler, AZ | 2.0 | 2.0 | 1136 | $1,650 | $1.45 | 24d | 1 | 0.20mi |
| 1970 N Hartford St #4 Chandler, AZ | 2.0 | 1.5 | 849 | $1,650 | $1.94 | 24d | 1 | 0.20mi |
| 1970 N Hartford St #99 Chandler, AZ | 2.0 | 2.5 | 1098 | $1,850 | $1.68 | 5d | 1 | 0.20mi |
| 1970 N Hartford St #99 Chandler, AZ | 2.0 | 2.5 | 1098 | $1,850 | $1.68 | 11d | 1 | 0.20mi |
| 1970 N Hartford St #4 Chandler, AZ | 2.0 | 1.5 | 849 | $1,650 | $1.94 | 43d | 1 | 0.20mi |
| 822 W Knox Rd Chandler, AZ | 2.0 | 1.0 | 850 | $1,375 | $1.62 | 4d | 1 | 0.38mi |
| 1351 N Pleasant Dr #2092 Chandler, AZ | 2.0 | 2.0 | 1300 | $3,450 | $2.65 | 43d | 1 | 0.48mi |
| 1351 N Pleasant Dr Chandler, AZ | 2.0 | 2.0 | 1299 | $2,622 | $2.02 | 24d | 2 | 0.56mi |
| 1351 N Pleasant Dr Chandler, AZ | 2.0 | 1.5–2.0 | 1121 | $2,535 | $2.26 | 10d | 3 | 0.56mi |
| 98 W Orchid Ln Unit 98-03 Chandler, AZ | 2.0 | 1.0 | 800 | $1,025 | $1.28 | 43d | 1 | 0.67mi |
| 1287 N Alma School Rd Chandler, AZ | 1.0–2.0 | 1.0–2.0 | 968 | $1,895 | $1.96 | 16d | 2 | 0.71mi |
| 699 W Ray Rd #5 Chandler, AZ | 2.0 | 1.0 | 825 | $1,149 | $1.39 | 10d | 1 | 0.81mi |
| 300 E Warner Rd Chandler, AZ | 1.0–3.0 | 1.0–2.0 | 1030 | $1,936 | $1.88 | 2d | 28 | 0.81mi |
| 123 E Corporate Pl Chandler, AZ | 1.0–3.0 | 1.0–2.0 | 1285 | $3,649 | $2.84 | 5d | 91 | 0.83mi |
| 433 W Ray Rd Chandler, AZ | 2.0 | 1.0 | 770 | $1,000 | $1.30 | 43d | 1 | 0.83mi |
| 859 W Ray Rd Apt 3 Chandler, AZ | 2.0 | 1.0 | 832 | $1,050 | $1.26 | 3d | 1 | 0.90mi |
| 859 W Ray Rd Apt 3 Chandler, AZ | 2.0 | 1.0 | 832 | $1,225 | $1.47 | 5d | 1 | 0.90mi |
| 859 W Ray Rd Apt 2 Chandler, AZ | 2.0 | 1.0 | 832 | $1,125 | $1.35 | 17d | 1 | 0.90mi |
| 859 W Ray Rd Apt 2 Chandler, AZ | 2.0 | 1.0 | 832 | $1,125 | $1.35 | 21d | 1 | 0.90mi |
| 510 E Kent Ave Chandler, AZ | 3.0 | 2.0 | 1422 | $2,190 | $1.54 | 2d | 1 | 1.01mi |
| 250 E Ray Rd Chandler, AZ | 2.0 | 2.0 | 1156 | $2,080 | $1.80 | 5d | 1 | 1.03mi |
| 250 E Ray Rd Chandler, AZ | 1.0–3.0 | 1.0–2.0 | 1073 | $3,948 | $3.68 | 19d | 11 | 1.03mi |
| 250 E Ray Rd Unit 2 Chandler, AZ | 2.0 | 2.0 | 1138 | $1,684 | $1.48 | 43d | 1 | 1.05mi |
| 1370 W Gary Dr Chandler, AZ | 3.0 | 2.0 | 1468 | $2,375 | $1.62 | 21d | 1 | 1.10mi |
| 760 N Evergreen St Chandler, AZ | 3.0 | 2.0 | 1219 | $2,100 | $1.72 | 12d | 1 | 1.12mi |
| 235 E Ray Rd Chandler, AZ | 2.0–3.0 | 2.0 | 1031 | $1,904 | $1.85 | 1d | 9 | 1.19mi |
| 886 W Galveston St #131 Chandler, AZ | 2.0 | 2.0 | 1272 | $1,800 | $1.42 | 24d | 1 | 1.30mi |
| 815 E Calle del Norte Chandler, AZ | 3.0 | 2.0 | 1250 | $2,100 | $1.68 | 5d | 1 | 1.31mi |
| 1817 N Dobson Rd Chandler, AZ | 1.0–3.0 | 1.0–2.0 | 1004 | $2,105 | $2.10 | 2d | 8 | 1.37mi |
| 1600 N Saba St #163 Chandler, AZ | 2.0 | 1.5 | 870 | $1,550 | $1.78 | 11d | 1 | 1.39mi |
| 1600 N Saba St #115 Chandler, AZ | 2.0 | 1.5 | 870 | $1,368 | $1.57 | 24d | 1 | 1.39mi |
| 501 E Ray Rd Lot 181 Chandler, AZ | 3.0 | 2.0 | 1344 | $2,099 | $1.56 | 43d | 1 | 1.41mi |
| 1320 N McQueen Rd Chandler, AZ | 2.0 | 2.0 | 851 | $1,387 | $1.63 | 24d | 1 | 1.41mi |
| 1320 N McQueen Rd Chandler, AZ | 2.0 | 2.0 | 883 | $1,427 | $1.62 | 5d | 1 | 1.41mi |
| 785 N Arrowhead Dr Apt 2 Chandler, AZ | 2.0 | 1.0 | 981 | $1,499 | $1.53 | 24d | 1 | 1.42mi |
| 3033 N Arizona Ave Chandler, AZ | 2.0 | 1.0–3.0 | 944 | $2,590 | $2.74 | 1d | 230 | 1.42mi |
| 868 E Savannah Dr Chandler, AZ | 3.0 | 2.0 | 1259 | $2,850 | $2.26 | 1d | 1 | 1.43mi |
| 1825 W Ray Rd Chandler, AZ | 1.0–2.0 | 1.0–2.0 | 881 | $1,850 | $2.10 | 5d | 1 | 1.45mi |
Listing history 13 events
-
2026-06-18days on market $45,000 Active 17 DOM
-
2026-06-17days on market $45,000 Active 16 DOM
-
2026-06-16days on market $45,000 Active 15 DOM
-
2026-06-15days on market $45,000 Active 14 DOM
-
2026-06-13days on market $45,000 Active 12 DOM
-
2026-06-13pricedays on market $45,000 Active 11 DOM
-
2026-06-09days on market $55,000 Active 8 DOM
-
2026-06-08days on market $55,000 Active 7 DOM
-
2026-06-07pricedays on market $55,000 Active 6 DOM
-
2026-06-04days on market $65,000 Active 3 DOM
-
2026-06-03days on market $65,000 Active 2 DOM
-
2026-06-02remarks 533-char remark
-
2026-06-02$65,000 Active 1 DOM
ⓘ Source: listings_history table (triggers on properties + properties_extension) + one-shot
backfill from property_details.listing_events for pre-trigger history.
Climate risk First Street
- Flood 1/10 Low FEMA zone X (shaded) · 0% chance over 30 yrs
- Wildfire 1/10 Low
- Heat 9/10 Extreme 7 d/yr ≥111°F today · 19 d/yr by 30 yrs out
- Wind 1/10 Low
- Air quality 2/10 Low 0 unhealthy d/yr today · 1 by 30 yrs out
Nearby sold comps map
Loading sold comps map…
Walkable amenities ~0.75 mi
Loading nearby amenities…
Taxation est. · year 1
- Rental income
- $23,503
- − Mortgage interest
- −$2,521
- − Property taxes
- −$675
- − Insurance
- −$225
- − Repairs & maintenance
- −$1,880
- − Management
- −$1,880
- − Depreciation
- −$1,309
- Taxable income
- $15,013
- Est. tax owed @ 24.0%
- −$3,603
- After-tax cash flow
- $11,233/yr
For passive investors: Depreciation is non-cash, so a rental often shows a tax loss while cash-flowing — sheltering income. Rental losses are passive: they offset passive income freely, and up to $25,000/yr can offset ordinary (W-2) income if you actively participate and your MAGI is under $100k (phasing out to $0 by $150k); unused losses carry forward. On sale, claimed depreciation is recaptured at up to 25%, and gains may owe capital-gains tax (a 1031 exchange can defer both). Figures are a year-1 estimate at your 24.0% rate — not tax advice; consult a CPA.
Condition & rehab AI · 10 photos
This charming 3-bedroom, 2-bathroom home is in good condition with newer updates and a well-maintained exterior. It offers a good return on investment with minor cosmetic upgrades that could further enhance its value.
Value-add opportunities
- Both painting interior walls — fresh paint enhances curb appeal and interior aesthetics
- Both upgrading light fixtures — modern lighting improves ambiance and energy efficiency
- Both installing smart home devices — enhances convenience and energy savings
Renovation cost estimate screening
Value-add ROI direction
- Both painting interior walls — fresh paint enhances curb appeal and interior aesthetics ↑
- Both upgrading light fixtures — modern lighting improves ambiance and energy efficiency ↑
- Both installing smart home devices — enhances convenience and energy savings ↑
ⓘ Cost ranges are severity-bucket heuristics (US national rule-of-thumb). Get contractor quotes + a written scope before underwriting a rehab budget.
Schools (NCES district)
- District
- Chandler Unified District #80 (4242)
- NCES district ID
- 0401870
- Math proficiency
- 49% ▼ -8.00%
- Reading proficiency
- 57% ▼ -2.00%
- Median HH income
- $74,048
- Composite
- 47.54/100
- National rank
- #2268
- State rank
- #31 of 249 in AZ
Livability — Chandler
- Score
- 78/100
- State rank
- #9
- US rank
- #2508
Category grades
Schools grade is shown separately in the Schools card above.
Census & demographics
- Census place
- Chandler, AZ
- County
- Maricopa County · 4,537,380 people
- City population
- 299,016
- Metro
- Phoenix-Mesa-Chandler, AZ
- Population (ZIP)
- 72,297
- Household income
- $88,676
- Rent vs Own
- Severe rent burden
- 2327.0
Population outlook (Maricopa County) Hauer SSP2
- Today (2025)
- 4,979,203 people
- By 2030
- 5,378,229 · +8.0%
- By 2040
- 6,156,598 · +23.6%
- By 2050
- 6,872,376 · +38.0%
- By 2075
- 8,401,270 · +68.7%
- By 2100
- 9,247,439 · +85.7%
Race, ethnicity, and origin ACS 2023
- Neighborhood character
- Diverse neighborhood (Simpson 0.65)
- Race & ethnicity
- White 48% Hispanic / Latino 34% Two or more races 16% Black 7% Asian 6% Native American 2%
- Hispanic origin (detail)
- Mexican 29% Puerto Rican 1%
- Common ancestry
- Romanian 2% Lithuanian 2% Portuguese 1%
- Foreign-born
- 16% · Canada, Vietnam, China
- Languages at home
- 72% English-only · Spanish 21% Vietnamese 1% Chinese 1%
Political lean MEDSL · Maricopa
- 2024 margin
- Toss-up / Even · D 47.7% · R 51.2% · Other 1.1%
- 2008→2024 swing
- +7.1pp toward D · 2008: -10.6pp · 2024: -3.5pp
- All cycles
- 2024: R+3.5 2020: D+2.2 2016: R+3.5 2012: R+12.0 2008: R+10.6
Not yet ingested
- Civics
- —
Market trends
- HPI YoY
- ▼ -128.25%
- Current HPI
- 328.8354
- Rent YoY
- ▼ -1.66%
- Metro
- Phoenix-Mesa-Chandler, AZ
- State GDP YoY
- ▲ 4.54%
- F500 in state
- 20
Industry mix (Fortune 500 HQ in AZ)
| Industry | F500 HQs | Revenue |
|---|---|---|
| Technology | 2 | $13B |
|
||
| Mining / Metals | 1 | $23B |
|
||
| Environmental Services | 1 | $16B |
|
||
| Metals / Steel | 1 | $14B |
|
||
| Technology Distribution | 1 | $9B |
|
||
| Homebuilding | 1 | $8B |
|
||
Price history
1 event — show timeline
- 2026-05-29 Listed $65,000 ARMLS
Cash-flow waterfall
monthlySold comps — $/sqft
last 12 mo · ≤1 miLoading sold comps…