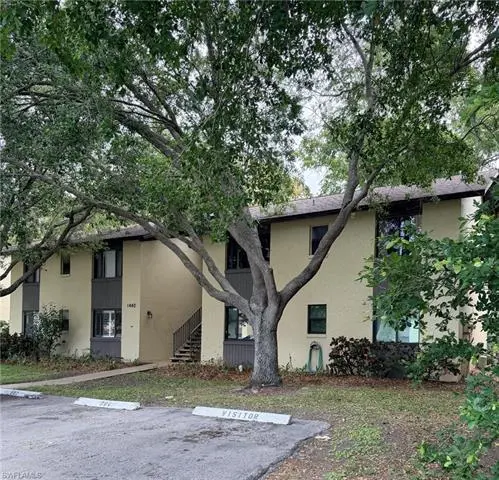
1440 Green Valley Cir #604 · Naples, FL
Flood risk 8/10 · Major
- FEMA flood zone
- AE
- Chance of flooding over 30 yrs
- 0.97%
- Est. flood insurance / yr
- $1,737 – $8,500
Fire risk 2/10 · Minimal
- Est. fire insurance / yr
- $947 – $1,759
Heat risk 10/10 · Severe
- Hot days now (above 107°F)
- 7 days/yr
- Hot days in 30 yrs
- 27 days/yr
Wind risk 10/10 · Severe
- Chance of severe wind over 30 yrs
- 99.0%
Air-quality risk 3/10 · Minor
- Unhealthy air days now
- 3 days/yr
- Unhealthy air days in 30 yrs
- 3 days/yr
Risk factors via First Street. Map © Google.
Why this score? — see what drove the C+ grade
The composite is a weighted blend of 9 inputs, each scored 0–100. Each bar is that input's sub-score; the figure is the points it added to the 100-point composite (weight × sub-score).
- Cash flow +22.5/30.0
- 1% rule +9.2/10.0
- ARV discount +7.5/15.0
- DSCR +7.2/10.0
- Schools +5.0/10.0
- Livability +4.0/5.0
- Condition / age +2.5/5.0
- Rent growth +2.2/5.0
- Appreciation +0.0/10.0
$185,000
🖨 Deal sheet (PDF) 📄 Offer letter ✓ Due diligence
Listing remarks MLS
Come see this property and get the best of both worlds! Perfect location on Airport Pulling Road and Davis and perfect peace and quiet! This property is great for anyone of any age. Two bed, Two bath on the second floor with a nice landscaped view. Perfect for renting out. This is a Fannie Mae owned property!
Key facts
- Dark wood floors
- Private ensuite bath
- Enclosed lanai
Tags
Property features AI
Finance
- Other: Complex has 71 units; building contains 4 units with 2 units per floor
- HOA & community: Mandatory HOA with professional management; Quarterly condo fee of $1,799 (total annual recurring fees $7,196); One-time fees $150; HOA covers lawn/land maintenance, legal/accounting, manager, exterior pest control, reserves, sewer, trash removal, and water; Community amenities include BBQ/picnic area, bike storage, cabana, community pool, extra storage, internet access, play area, streetlights, and vehicle wash area; Non-gated community
Exterior
- Parking: 1 assigned paved parking space
- Security: Smoke detectors
- Utilities: Central water; Central sewer; Cable available
- Home design: Residential low-rise (1–3) end-unit; 2-story building; Rear exposure facing east; Built in 1984; Part of the Springwood development
- Construction: Concrete block construction
- Exterior features: Courtyard; Exterior storage; Shingle roof; Single-hung windows; Stucco exterior; Landscaped area view; Paved road access; Central irrigation
Interior
- Kitchen: Dishwasher; Range; Refrigerator
- Bedrooms: 2 bedrooms with a split bedroom floor plan
- Flooring: Tile; Wood
- Bathrooms: 2 full bathrooms; Master bath with combo tub and shower
- Heating & cooling: Central electric heat; Central electric cooling; Ceiling fans
- Interior features: Cable prewire; High-speed internet available; Smoke detectors; Breakfast bar / dining in living area; Screened lanai/porch; Unfurnished
- Laundry & utility: Washer; Dryer
Neighborhood map
What this means for you Summary
Snapshot
- This is a 2-bed/2.0-bath condo listed at $185k.
Deal economics
- At list price, monthly cash flow is $-113 ($-1k/yr) — negative.
- To cash-flow at today's rent, offer at most $165k (10.8% below list).
- Meets the 1% rule at list price ($3k rent vs $185k).
- Recommended offer: $165k (10.8% below list) — sets the bar for cash-flow.
Location & tenants
- Location reads 80/100 on livability (#126 in FL, #1,903 nationally) — a professional / high-income tenant draw. Strengths: crime A+, amenities A+, employment A+; Watch: commute D+, cost of living F.
- Collier (suburban): math 60% / reading 56% proficiency, ranked #16 of 73 in FL (top 22%) — acceptable for families but not a draw, mixed tenant base, ~2y average lease.
- Zoned schools: Shadowlawn Elementary School (math 44% / reading 40%, grade F, #1,403 of 2,144 statewide, top 67%, 457 students, 72% FRL); East Naples Middle School (math 56% / reading 44%, grade C, #254 of 571 statewide, top 45%, 854 students, 63% FRL); Naples High School (math 47% / reading 52%, grade D, #179 of 667 statewide, top 29%, 1,719 students, 39% FRL) — zoned schools at 58% FRL track the district average.
- Market conditions: Rents soft (-1.1%/yr); 438 active listings in the ZIP; 40 comparable units currently listed for rent nearby; rentals at typical pace (median 16d on market — plan ~3-4 weeks tenant-placement turnaround); 3,520 units permitted in Collier County in 2024 (959 in 5+ unit buildings).
- This rent runs 44% of the median local income ($72k/yr) — at the standard rent-burdened threshold; future hikes will face affordability resistance.
Forward outlook
- Local home prices are declining (-3.0%/yr); year-one equity from $1k of loan paydown is wiped out by about $6k of value loss. Plan a longer hold.
- Collier County population projected at +30% by 2050 — long-run rental-demand tailwind backs the buy-and-hold thesis.
Negotiation context
- Only 12 days on market — expect competitive offers; lowballing is unlikely to land.
- 2 sale attempts since 15y ago with the ask held roughly flat each time — persistent listings suggest the price (not the market) is what's stuck; bring a comps-based counter.
- Current owner paid $40k; list at $185k implies a 364% gain — meaningful room to come down on a strong offer.
Risks & watch-outs
- Watch-outs: flood insurance adds $427/mo; HOA is 23% of rent.
- Climate carrying-cost: in FEMA flood zone AE (mandatory federal flood insurance); severe wind risk, 99% chance of damaging wind over 30y; extreme-heat days projected 7→27/yr by 2055 (HVAC capex compounding) — expect insurance premiums to compound above CPI over the hold.
Questions for the listing agent
- What do current leases actually rent for vs. the listed asking? Can we see a recent rent roll and the last 12 months of T-12 income?
- What's the actual annual flood-insurance premium (NFIP or private), and is the property in a SFHA with mandatory coverage?
- What does the HOA fee cover, when was the last increase, and are there any pending special assessments or reserve-fund shortfalls?
- Any open or pending special assessments — roof, HVAC, plumbing, elevator, façade? What's the per-unit balance and payoff schedule, and is the seller paying it off at close or rolling it to the buyer?
- Is there a deadline driving the sale (1031 exchange, divorce, estate, relocation)? That informs how much negotiation room exists.
- Schools are B-rated — typically a magnet for longer-tenancy family renters. What's the average tenant stay here, and is there a school-zone premium baked into asking?
- What's the average days-on-market for RENTAL listings here right now (not sales)? A rising rental-DOM trend means longer vacancies and softer asking-rent achievability than the comps imply.
- What's the recent tenant-quality profile in this submarket — average credit score on applications, eviction rate, late-payment / NSF rate, and stable-employment percentage? A property-management company in the area should have these aggregated.
- How much new apartment / multifamily construction is in the pipeline within 1–3 miles? Heavy new supply (>2% of stock underway) typically softens rents 12–24 months out; light construction supports rent growth.
Investment metrics
- 1% rule
- 1.42% ✓
- Cap rate
- 8.32%
- Cash-on-cash
- 7.25%
- DSCR
- 1.32
- GRM
- 5.9
CMA / ARV
No comps found within radius.
Projected returns pro-forma
-3.0% appreciation · 0.0% rent growth · sell at horizon
- IRR
- -26.5%
- Equity multiple
- 0.15×
- Total profit
- $-44,286
- Equity at exit
- $27,584
- IRR
- -60.1%
- Equity multiple
- -0.45×
- Total profit
- $-75,112
- Equity at exit
- $15,995
Cash invested: $51,800 (down + closing). Projections, not guarantees.
Landlord ↔ Tenant lean methodology
- Overall (STATE)
- 87 Strongly Landlord-Friendly
- State Florida
- 87 Strongly Landlord-Friendly · R+3
- County
- — inherits STATE
- City
- — inherits STATE
ZIP-level market 34104
- Rents YoY
- -1.1%
- Active inventory
- 438
- Price-to-rent
- 5.9×
Monthly cashflow live
- Estimated rent
- $2,619 high interval (Pro) →
- Mortgage (P&I)
- −$970
- Tax from tax record
- −$108 /mo · $1,301/yr
- Insurance
- −$77
- Flood insurance flood zone
- −$427 /mo · $5,118/yr
- HOA
- −$600
- Vacancy / Maint / Mgmt
- −$550
- Net cashflow
- $-113
Break-even live
Sensitivity live
| Price | -10% $-9 | -5% $-61 | +0% $-113 | +5% $-166 | +10% $-218 |
|---|---|---|---|---|---|
| Rent | -10% $-320 | -5% $-217 | +0% $-113 | +5% $-10 | +10% $93 |
| Rate | -1.0pp $-20 | -0.5pp $-66 | base $-113 | +0.5pp $-161 | +1.0pp $-210 |
UW: 25.0% down · 7.5% · 30yr · 1.5% tax · 5.0% vac · 8.0% maint · 8.0% mgmt
Financing live
Cash to close
- Down payment
- $46,250
- Closing costs
- $5,550
- Reserves months
- —
- Total cash needed
- —
Loan-product check · same deal, 3 products live
Conventional
25% down · 7.5% · 30yr
- Down + closing
- —
- Monthly P&I
- —
- Monthly cashflow
- —
- DSCR
- —
- Eligible?
- —
Personal DTI + credit; lowest rate.
DSCR
20% down · 8.5% · 30yr
- Down + closing
- —
- Monthly P&I
- —
- Monthly cashflow
- —
- DSCR
- —
- Eligible?
- —
No personal income docs; deal must DSCR.
Hard money
10% down · 12.0% · 12mo
- Down + closing
- —
- Monthly P&I
- —
- Monthly cashflow
- —
- DSCR
- —
- Eligible?
- —
Short-term bridge; refi at stabilization.
Rent comps 40 comps
| Address | Beds | Baths | Sqft | Rent | $/sqft | DOM | Units | Dist |
|---|---|---|---|---|---|---|---|---|
| 1059 San Remo Ave Naples, FL | 2.0 | 1.0 | 845 | $1,795 | $2.12 | 25d | 1 | 0.17mi |
| 2155 Great Blue Dr Naples, FL | 1.0–3.0 | 1.0–2.0 | 895 | $1,910 | $2.13 | 15d | 43 | 0.64mi |
| 1075 Foxfire Ln Naples, FL | 2.0 | 2.0 | 1092 | $3,300 | $3.02 | 25d | 3 | 0.71mi |
| 256 Palm Dr #6 Naples, FL | 2.0 | 2.0 | 1010 | $4,500 | $4.46 | 15d | 1 | 0.76mi |
| 240 Palm Dr Unit 48-1 Naples, FL | 2.0 | 2.0 | 1100 | $1,800 | $1.64 | 25d | 1 | 0.79mi |
| 232 Palm Dr Unit 47-5 Naples, FL | 2.0 | 2.0 | 1010 | $2,500 | $2.48 | 25d | 1 | 0.82mi |
| 1895 Courtyard Way #103 Naples, FL | 3.0 | 2.0 | 1046 | $2,200 | $2.10 | 23d | 1 | 0.82mi |
| 2347 Bayside St Apt B Naples, FL | 2.0 | 1.0 | 864 | $1,595 | $1.85 | 15d | 1 | 0.82mi |
| 1933 Courtyard Way Unit D-103 Naples, FL | 2.0 | 2.0 | 947 | $1,850 | $1.95 | 15d | 1 | 0.84mi |
| 216 Palm Dr #5 Naples, FL | 2.0 | 2.0 | 1010 | $4,500 | $4.46 | 15d | 1 | 0.85mi |
| 2750 Manorca Ave Unit A Naples, FL | 2.0 | 1.0 | 840 | $2,800 | $3.33 | 15d | 1 | 0.85mi |
| 1701 Courtyard Way Naples, FL | 2.0 | 2.0 | 1072 | $1,990 | $1.86 | 25d | 1 | 0.87mi |
| 200 Palm Dr #7 Naples, FL | 2.0 | 2.0 | 1010 | $1,600 | $1.58 | 15d | 1 | 0.89mi |
| 131 Teryl Rd Unit C3 Naples, FL | 2.0 | 2.0 | 1080 | $3,495 | $3.24 | 25d | 1 | 0.98mi |
| 131 Teryl Rd Unit 3UNIT 3 Naples, FL | 2.0 | 2.0 | 1080 | $1,750 | $1.62 | 15d | 1 | 0.98mi |
| 159 Teryl Rd #2 Naples, FL | 2.0 | 2.0 | 1080 | $5,200 | $4.81 | 15d | 1 | 0.99mi |
| 149 Palm Dr Unit 8617 Naples, FL | 2.0 | 2.0 | 981 | $2,000 | $2.04 | 15d | 1 | 1.05mi |
| 153 Bristol Ln Unit F102 Naples, FL | 2.0 | 2.0 | 1009 | $4,900 | $4.86 | 25d | 1 | 1.08mi |
| 153 Bristol Ln Unit A Naples, FL | 2.0 | 2.0 | 1009 | $2,250 | $2.23 | 15d | 1 | 1.08mi |
| 3350 Putney Ct Naples, FL | 1.0–3.0 | 1.0–2.0 | 1038 | $2,986 | $2.88 | 15d | 26 | 1.12mi |
| 3005 Gordon St Naples, FL | 3.0 | 2.0 | 967 | $2,275 | $2.35 | 25d | 1 | 1.14mi |
| 3005 Gordon St Naples, FL | 3.0 | 2.0 | 967 | $2,275 | $2.35 | 15d | 1 | 1.14mi |
| 2972 Kings Lake Blvd #2972 Naples, FL | 2.0 | 2.0 | 1100 | $3,000 | $2.73 | 25d | 1 | 1.16mi |
| 2134 Palm St Naples, FL | 1.0 | 1.0 | 600 | $7,500 | $12.50 | 25d | 1 | 1.20mi |
| 1950 Mayfair St Naples, FL | 3.0 | 1.0–3.5 | 1514 | $8,752 | $5.78 | 15d | 109 | 1.20mi |
| 2648 Kings Lake Blvd Unit 6-201 Naples, FL | 3.0 | 2.0 | 1060 | $2,200 | $2.08 | 23d | 1 | 1.21mi |
| 2644 Kings Lake Blvd Unit 6-103 Naples, FL | 2.0 | 2.0 | 911 | $1,875 | $2.06 | 25d | 1 | 1.22mi |
| 1950 Mayfair ST Unit 802 Naples, FL | 1.0 | 1.0 | 710 | $3,355 | $4.73 | 15d | 1 | 1.24mi |
| 1950 Mayfair ST Unit 716 Naples, FL | 1.0 | 1.0 | 710 | $3,330 | $4.69 | 15d | 1 | 1.24mi |
| 1950 Mayfair ST Unit 817 Naples, FL | 1.0 | 1.0 | 710 | $3,295 | $4.64 | 15d | 1 | 1.24mi |
| 1950 Mayfair ST Unit 1021 Naples, FL | 1.0 | 1.0 | 710 | $3,520 | $4.96 | 15d | 1 | 1.24mi |
| 1950 Mayfair ST Unit 1027 Naples, FL | 1.0 | 1.0 | 888 | $3,525 | $3.97 | 15d | 1 | 1.24mi |
| 1950 Mayfair ST Unit 901 Naples, FL | 2.0 | 2.0 | 1025 | $4,560 | $4.45 | 15d | 1 | 1.24mi |
| 1950 Mayfair ST Unit 921 Naples, FL | 1.0 | 1.0 | 710 | $3,420 | $4.82 | 15d | 1 | 1.24mi |
| 2712 Kings Lake Blvd #201 Naples, FL | 1.0 | 1.0 | 1076 | $2,850 | $2.65 | 25d | 1 | 1.25mi |
| 12 Knights Bridge Rd Unit A32 Naples, FL | 2.0 | 2.0 | 1095 | $3,200 | $2.92 | 23d | 1 | 1.32mi |
| 2840 Shoreview Dr Unit 7 Naples, FL | 2.0 | 1.0 | 800 | $2,000 | $2.50 | 25d | 1 | 1.35mi |
| 1787 Reuven Cir Unit 1001 Naples, FL | 2.0 | 2.0 | 1112 | $1,300 | $1.17 | 15d | 1 | 1.37mi |
| 1155 Sandpiper St Naples, FL | 2.0 | 2.0 | 1062 | $4,050 | $3.81 | 25d | 2 | 1.40mi |
| 1155 Sandpiper St Naples, FL | 2.0 | 2.0 | 1062 | $3,950 | $3.72 | 23d | 3 | 1.40mi |
HOA detail condo
- Monthly dues
- $600 · $7,200/yr
- Assessments
- None detected in remarks — confirm with the listing agent.
Listing history 6 events
-
2026-06-01status $185,000 Pending 12 DOM
-
2026-05-14$185,000 Active
-
2011-12-12soldstatus $39,900 310-char remark
Show marketing remark (310 chars)
Come see this property and get the best of both worlds! Perfect location on Airport Pulling Road and Davis and perfect peace and quiet! This property is great for anyone of any age. Two bed, Two bath on the second floor with a nice landscaped view. Perfect for renting out. This is a Fannie Mae owned property!
-
2011-09-23$39,900 310-char remark
Show marketing remark (310 chars)
Come see this property and get the best of both worlds! Perfect location on Airport Pulling Road and Davis and perfect peace and quiet! This property is great for anyone of any age. Two bed, Two bath on the second floor with a nice landscaped view. Perfect for renting out. This is a Fannie Mae owned property!
-
2003-12-31soldstatus $79,000
-
1985-04-01soldstatus $51,900
ⓘ Source: listings_history table (triggers on properties + properties_extension) + one-shot
backfill from property_details.listing_events for pre-trigger history.
Tax reassessment forecast FL · Resets to sale price
- Current annual tax
- $1,301 · $108/mo
- Projected year-2 tax
- $1,536 · $128/mo
- Expected delta
- +$235/yr (+$20/mo · 18.1%)
ⓘ Screening estimate from a state-policy table — verify with the county assessor before closing.
Climate risk First Street
- Flood 8/10 Severe FEMA zone AE · 97% chance over 30 yrs
- Wildfire 2/10 Low
- Heat 10/10 Extreme 7 d/yr ≥107°F today · 27 d/yr by 30 yrs out
- Wind 10/10 Extreme 99% chance of damaging wind over 30 yrs
- Air quality 3/10 Moderate 3 unhealthy d/yr today · 3 by 30 yrs out
Nearby sold comps map
Loading sold comps map…
Walkable amenities ~0.75 mi
Loading nearby amenities…
Taxation est. · year 1
- Rental income
- $31,423
- − Mortgage interest
- −$10,363
- − Property taxes
- −$1,301
- − Insurance
- −$6,044
- − Repairs & maintenance
- −$2,514
- − Management
- −$2,514
- − HOA
- −$7,200
- − Depreciation
- −$5,382
- Taxable loss
- −$3,894
- Est. tax savings @ 24.0%
- +$934
- After-tax cash flow
- $-427/yr
For passive investors: Depreciation is non-cash, so a rental often shows a tax loss while cash-flowing — sheltering income. Rental losses are passive: they offset passive income freely, and up to $25,000/yr can offset ordinary (W-2) income if you actively participate and your MAGI is under $100k (phasing out to $0 by $150k); unused losses carry forward. On sale, claimed depreciation is recaptured at up to 25%, and gains may owe capital-gains tax (a 1031 exchange can defer both). Figures are a year-1 estimate at your 24.0% rate — not tax advice; consult a CPA.
Schools (NCES district)
- District
- Collier
- NCES district ID
- 1200330
- Math proficiency
- 60% ▼ -4.00%
- Reading proficiency
- 56% ▼ -2.00%
- Median HH income
- $58,275
- Composite
- 50.23/100
- National rank
- #1892
- State rank
- #16 of 73 in FL
Livability — Naples
- Score
- 80/100
- State rank
- #126
- US rank
- #1903
Category grades
Schools grade is shown separately in the Schools card above.
Census & demographics
- County
- Collier County · 396,295 people
- City population
- 344,941
- Metro
- Naples-Marco Island, FL
- Population (ZIP)
- 26,408
- Household income
- $71,686
- Rent vs Own
- Severe rent burden
- 1423.0
Population outlook (Collier County) Hauer SSP2
- Today (2025)
- 420,858 people
- By 2030
- 450,054 · +6.9%
- By 2040
- 502,232 · +19.3%
- By 2050
- 544,932 · +29.5%
- By 2075
- 627,203 · +49.0%
- By 2100
- 659,015 · +56.6%
Race, ethnicity, and origin ACS 2023
- Neighborhood character
- Majority White (62%)
- Race & ethnicity
- White 62% Hispanic / Latino 30% Two or more races 19% Black 4% Asian 2%
- Hispanic origin (detail)
- Mexican 7% Puerto Rican 3% Cuban 6% Dominican 1%
- Common ancestry
- Lithuanian 6% Romanian 3% Hispanic 2%
- Foreign-born
- 30% · Canada, Jamaica, Dominican Republic
- Languages at home
- 66% English-only · Spanish 24% French/Haitian/Cajun 5% Russian/Polish/Slavic 1%
Political lean MEDSL · Collier
- 2024 margin
- Solid R (+33.1) · D 33.1% · R 66.2%
- 2008→2024 swing
- -10.6pp toward R · 2008: -22.5pp · 2024: -33.1pp
- All cycles
- 2024: R+33.1 2020: R+24.7 2016: R+26.0 2012: R+30.1 2008: R+22.5
Not yet ingested
- Civics
- —
Market trends
- HPI YoY
- ▼ -252.48%
- Current HPI
- 259.3498
- Rent YoY
- ▼ -1.10%
- Metro
- Naples-Marco Island, FL
- State GDP YoY
- ▲ 3.28%
- F500 in state
- 36
Industry mix (Fortune 500 HQ in FL)
| Industry | F500 HQs | Revenue |
|---|---|---|
| Industrial Technology | 2 | $29B |
|
||
| Insurance | 2 | $17B |
|
||
| Retail | 1 | $60B |
|
||
| Technology Distribution | 1 | $58B |
|
||
| Homebuilding | 1 | $35B |
|
||
| Technology Manufacturing | 1 | $35B |
|
||
Price history
+256.5% since first listed5 events — show timeline
- 2026-05-14 Listed $185,000 BEARMLS
- 2011-12-12 Sold (MLS) $39,900 NAPLESMLS
- 2011-09-23 Listed $39,900 NAPLESMLS
- 2003-12-31 Sold (Public Records) $79,000 Public Records
- 1985-04-01 Sold (Public Records) $51,900 Public Records
Property tax history
+10.5%/yrLatest (2025): $1,301 · +6.2% YoY. Source: county tax records.
Cash-flow waterfall
monthlySold comps — $/sqft
last 12 mo · ≤1 miLoading sold comps…