 🌊 Lakefront
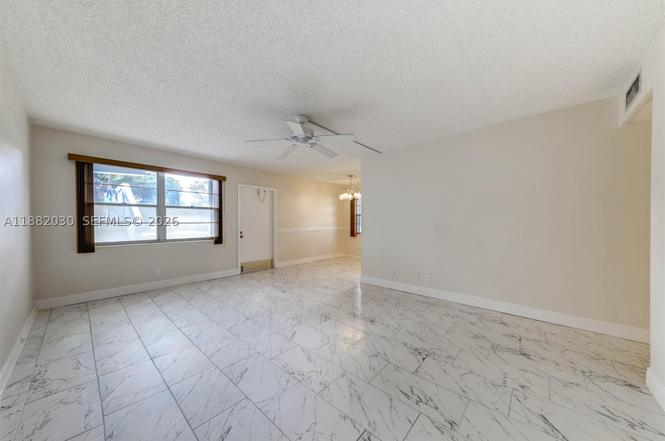
36 Islewood B #36 · Deerfield Beach, FL
Flood risk No data
- FEMA flood zone
- —
- Chance of flooding over 30 yrs
- —
- Est. flood insurance / yr
- —
Fire risk No data
- Est. fire insurance / yr
- —
Heat risk No data
- Hot days now (above threshold)
- —
- Hot days in 30 yrs
- —
Wind risk No data
- Chance of severe wind over 30 yrs
- —
Air-quality risk No data
- Unhealthy air days now
- —
- Unhealthy air days in 30 yrs
- —
Risk factors via First Street. Map © Google.
Why this score? — see what drove the D- grade
The composite is a weighted blend of 9 inputs, each scored 0–100. Each bar is that input's sub-score; the figure is the points it added to the 100-point composite (weight × sub-score).
- 1% rule +9.4/10.0
- Cash flow +8.0/30.0
- ARV discount +7.5/15.0
- Schools +4.1/10.0
- Livability +3.8/5.0
- Rent growth +2.5/5.0
- Condition / age +2.5/5.0
- DSCR +2.0/10.0
- Appreciation +0.0/10.0
$130,000
🖨 Deal sheet 📄 Offer letter ✓ Due diligence
Listing remarks
Recently updated with brand-new tile flooring throughout, fresh interior paint. Updated kitchen, and beautifully renovated bathrooms, this residence offers a clean, modern, move-in-ready experience. The sought-after corner location allows an abundance of natural light to pour in creating a bright, airy and inviting atmosphere. For added protection and peace of mind, the home is equipped with accordion hurricane shutters on every window. Exceptional opportunities like this are rarely available. This beautifully fully remodeled 2-bedroom, 1.5-bath corner waterfront residence offering breathtaking lake and garden views from one of the community’s most desirable buildings. Perfectly posit
Key facts
- Laminate flooring
- Updated bathrooms
- Updated kitchen
Tags
Property features AI
Finance
- Financial info: Pets: conditional or restrictions may apply
- HOA & community: Monthly association fee; Association covers amenities, common areas, cable TV, insurance, laundry, grounds maintenance, structure maintenance, pool(s), recreation facilities, reserve fund, security, trash and water; Association amenities include clubhouse, fitness center, billiard room, hobby room, library, barbecue/picnic area, pool, shuffleboard court, trails, and transportation service; Large community (approximately 8,500 units); Senior community
Exterior
- Parking: Assigned parking; Guest parking available; One assigned space
- Security: Complex fenced; Key card entry; Security guard; Smoke detectors
- Utilities: Has cooling and heating; Electric systems
- Home design: Attached property; 2 stories; Entry located on level 1
- Construction: Block construction; Resale property
- Exterior features: Enclosed porch; Screened porch; Patio; Storm/security shutters; Has view; Waterfront with canal access, canal front and lake front
Interior
- Kitchen: Dishwasher; Electric range; Disposal; Icemaker; Microwave; Refrigerator; Electric water heater
- Bedrooms: Bedroom on main level
- Flooring: Hardwood; Laminate; Wood
- Bathrooms: 1 full bathroom; 1 half bathroom
- Heating & cooling: Central heating (electric); Central air conditioning (electric); Ceiling fan(s)
- Interior features: Blinds on windows; First-floor entry with main living area on the entry level; Living/dining room; Family/dining room; Walk-in closet(s); Tub/shower; Additional storage room / other room
- Laundry & utility: Laundry included in association amenities
Neighborhood map
What this means for you Summary
Snapshot
- This is a 2-bed/1.5-bath condo listed at $130k.
Deal economics
- At list price, monthly cash flow is $-134 ($-2k/yr) — negative.
- To cash-flow at today's rent, offer at most $111k (14.9% below list).
- Meets the 1% rule at list price ($2k rent vs $130k).
- Recommended offer: $111k (14.9% below list) — sets the bar for cash-flow.
- Cap rate 5.1% vs local median 4.2% in Deerfield Beach — meaningfully above typical; check what's discounted (condition, days-on-market, listing class) to confirm the premium yield is real.
Location & tenants
- Location reads 75/100 on livability (#250 in FL, #3,970 nationally) — a middle-class / working-renter tenant base. Strengths: housing A+, health & safety A+, cost of living A; Watch: schools D-, amenities D-, employment D-.
- Broward (suburban): math 42% / reading 53% proficiency, ranked #46 of 73 in FL (top 63%) — families likely to look elsewhere, expect single-tenant / working-renter base with shorter leases.
- Market conditions: Rents flat; 586 active listings in the ZIP; 40 comparable units currently listed for rent nearby; rentals at typical pace (median 24d on market — plan ~3-4 weeks tenant-placement turnaround); 2,111 units permitted in Broward County in 2024 (1,265 in 5+ unit buildings).
- This rent runs 42% of the median local income ($53k/yr) — at the standard rent-burdened threshold; future hikes will face affordability resistance.
Forward outlook
- Local home prices are declining (-3.0%/yr); year-one equity from $899 of loan paydown is wiped out by about $4k of value loss. Plan a longer hold.
- Broward County population projected at +34% by 2050 — long-run rental-demand tailwind backs the buy-and-hold thesis.
Negotiation context
- It's been on market 264 days — a 12% lower offer ($114k) is reasonable based on typical stale-listing flexibility.
- 2 sale attempts; this cycle's ask has dropped $25k (16%) from the opening price — seller is motivated, your offer sets the floor, not the list.
Risks & watch-outs
- Watch-outs: HOA is 38% of rent.
Questions for the listing agent
- What do current leases actually rent for vs. the listed asking? Can we see a recent rent roll and the last 12 months of T-12 income?
- It's been on market 264 days. Have you received any prior offers? Is the seller open to a 15% concession, seller financing, or rate buy-down credit?
- Built in 1977 — when were the roof, HVAC, electrical panel, plumbing, and water heater last replaced?
- What does the HOA fee cover, when was the last increase, and are there any pending special assessments or reserve-fund shortfalls?
- Any open or pending special assessments — roof, HVAC, plumbing, elevator, façade? What's the per-unit balance and payoff schedule, and is the seller paying it off at close or rolling it to the buyer?
- Why hasn't it sold? Are there any deal-killer items the seller is aware of (foundation, flood, title, zoning, code violations)?
- Is there a deadline driving the sale (1031 exchange, divorce, estate, relocation)? That informs how much negotiation room exists.
- Schools are D-rated, which usually means shorter tenancies and higher turnover. Who's the typical renter profile here, and what's been the actual vacancy rate?
- The area grade is low — what's the realistic commute time and amenity access for the typical tenant pool here? Any planned neighborhood developments (good or bad) we should know about?
- This sits on a lake — are riparian / water-frontage rights deeded with the parcel? Any dock permits, shoreline easements, or HOA water-use restrictions?
- What's the documented flood / surge / shoreline-erosion history here (FEMA AND non-FEMA — e.g., storm surge, creek backup, septic-field saturation)?
- Any water-quality or seasonal algae-bloom issues that affect tenant satisfaction or short-term-rental demand?
- What's the average days-on-market for RENTAL listings here right now (not sales)? A rising rental-DOM trend means longer vacancies and softer asking-rent achievability than the comps imply.
- What's the recent tenant-quality profile in this submarket — average credit score on applications, eviction rate, late-payment / NSF rate, and stable-employment percentage? A property-management company in the area should have these aggregated.
- How much new apartment / multifamily construction is in the pipeline within 1–3 miles? Heavy new supply (>2% of stock underway) typically softens rents 12–24 months out; light construction supports rent growth.
Investment metrics
- 1% rule
- 1.44% ✓
- Cap rate
- 5.06%
- Cash-on-cash
- -4.41%
- DSCR
- 0.80
- GRM
- 5.8
CMA / ARV
No comps found within radius.
Projected returns pro-forma
-3.0% appreciation · 0.1% rent growth · sell at horizon
- IRR
- -29.8%
- Equity multiple
- 0.05×
- Total profit
- $-34,431
- Equity at exit
- $19,383
- IRR
- -75.1%
- Equity multiple
- -0.64×
- Total profit
- $-59,613
- Equity at exit
- $11,240
Cash invested: $36,400 (down + closing). Projections, not guarantees.
Landlord ↔ Tenant lean methodology
- Overall (STATE)
- 87 Strongly Landlord-Friendly
- State Florida
- 87 Strongly Landlord-Friendly · R+3
- County
- — inherits STATE
- City
- — inherits STATE
ZIP-level market 33442
- Rents YoY
- 0.1%
- Active inventory
- 586
- Price-to-rent
- 5.8×
Monthly cashflow live
- Estimated rent
- $1,872 high interval (Pro) →
- Mortgage (P&I)
- −$682
- Tax est. 1.5%
- −$162 /mo · $1,950/yr
- Insurance
- −$54
- HOA
- −$714
- Vacancy / Maint / Mgmt
- −$393
- Net cashflow
- $-134
Break-even live
UW: 25.0% down · 7.5% · 30yr · 1.5% tax · 5.0% vac · 8.0% maint · 8.0% mgmt
Financing live
Cash to close
- Down payment
- $32,500
- Closing costs
- $3,900
- Reserves months
- —
- Total cash needed
- —
Loan-product check · same deal, 3 products live
Conventional
25% down · 7.5% · 30yr
- Down + closing
- —
- Monthly P&I
- —
- Monthly cashflow
- —
- DSCR
- —
- Eligible?
- —
Personal DTI + credit; lowest rate.
DSCR
20% down · 8.5% · 30yr
- Down + closing
- —
- Monthly P&I
- —
- Monthly cashflow
- —
- DSCR
- —
- Eligible?
- —
No personal income docs; deal must DSCR.
Hard money
10% down · 12.0% · 12mo
- Down + closing
- —
- Monthly P&I
- —
- Monthly cashflow
- —
- DSCR
- —
- Eligible?
- —
Short-term bridge; refi at stabilization.
Rent comps 40 comps
| Address | Beds | Baths | Sqft | Rent | $/sqft | DOM | Units | Dist |
|---|---|---|---|---|---|---|---|---|
| 111 Tilford F #111 Deerfield Beach, FL | 1.0 | 1.0 | 585 | $1,500 | $2.56 | 5d | 1 | 0.14mi |
| 111 Tilford F #111 Deerfield Beach, FL | 1.0 | 1.0 | 585 | $1,500 | $2.56 | 20d | 1 | 0.14mi |
| 181 Tilford I Unit I Deerfield Beach, FL | 1.0 | 1.5 | 700 | $1,350 | $1.93 | 24d | 1 | 0.24mi |
| 184 Tilford I Unit I Deerfield Beach, FL | 2.0 | 1.5 | 820 | $2,000 | $2.44 | 24d | 1 | 0.24mi |
| 272 Tilford M Unit M Deerfield Beach, FL | 2.0 | 1.5 | 820 | $1,900 | $2.32 | 24d | 1 | 0.30mi |
| 316 Markham Cres Deerfield Beach, FL | 2.0 | 1.5 | 820 | $1,800 | $2.20 | 24d | 1 | 0.31mi |
| 6 Ventnor a Deerfield Beach, FL | 1.0 | 1.0 | 600 | $1,429 | $2.38 | 24d | 1 | 0.31mi |
| 308 Markham N Deerfield Beach, FL | 1.0 | 1.5 | 700 | $1,200 | $1.71 | 24d | 1 | 0.34mi |
| 358 Markham Cres Unit 358 Deerfield Beach, FL | 1.0 | 1.5 | 700 | $1,500 | $2.14 | 24d | 1 | 0.34mi |
| 25 Newport Ct Unit 25 Deerfield Beach, FL | 1.0 | 1.0 | 700 | $1,549 | $2.21 | 24d | 1 | 0.36mi |
| 27 Newport B Deerfield Beach, FL | 1.0 | 1.5 | 700 | $1,550 | $2.21 | 22d | 1 | 0.36mi |
| 20 Prescott E Unit 20 Deerfield Beach, FL | 1.0 | 1.5 | 700 | $1,600 | $2.29 | 24d | 1 | 0.41mi |
| 188 Prescott E Unit 188 Deerfield Beach, FL | 1.0 | 1.5 | 700 | $1,800 | $2.57 | 24d | 1 | 0.41mi |
| 436 Markham S #436 Deerfield Beach, FL | 1.0 | 1.0 | 585 | $1,400 | $2.39 | 24d | 1 | 0.43mi |
| 105 Deer Creek Rd Deerfield Beach, FL | 2.0 | 2.0 | 1120 | $2,700 | $2.41 | 24d | 1 | 0.44mi |
| 361 Tilford Q Unit Q Deerfield Beach, FL | 2.0 | 1.5 | 820 | $1,800 | $2.20 | 24d | 1 | 0.45mi |
| 105 Deer Creek Rd #202 Deerfield Beach, FL | 2.0 | 2.0 | 1120 | $3,000 | $2.68 | 24d | 1 | 0.45mi |
| 125 Newport I Unit I Deerfield Beach, FL | 1.0 | 1.5 | 700 | $1,600 | $2.29 | 24d | 1 | 0.48mi |
| 384 Durham Cir Unit 384 Deerfield Beach, FL | 1.0 | 1.0 | 593 | $1,400 | $2.36 | 24d | 1 | 0.49mi |
| 111 Oakridge I #111 Deerfield Beach, FL | 1.0 | 1.5 | 706 | $1,595 | $2.26 | 24d | 1 | 0.50mi |
| 124 Oakridge I #124 Deerfield Beach, FL | 2.0 | 1.5 | 820 | $1,700 | $2.07 | 4d | 1 | 0.50mi |
| 283 Durham Cir Unit 283 Deerfield Beach, FL | 2.0 | 2.0 | 820 | $3,300 | $4.02 | 24d | 1 | 0.51mi |
| 193 Newport Ct #193 Deerfield Beach, FL | 2.0 | 1.5 | 820 | $2,200 | $2.68 | 24d | 1 | 0.51mi |
| 181 Newport Ct #181 Deerfield Beach, FL | 1.0 | 1.5 | 700 | $1,650 | $2.36 | 24d | 1 | 0.52mi |
| 170 Newport K Deerfield Beach, FL | 1.0 | 1.0 | 585 | $1,430 | $2.44 | 24d | 1 | 0.52mi |
| 178 Durham E Unit 178 Deerfield Beach, FL | 1.0 | 1.0 | 593 | $1,350 | $2.28 | 3d | 1 | 0.53mi |
| 178 Durham E Unit 178 Deerfield Beach, FL | 1.0 | 1.0 | 593 | $1,350 | $2.28 | 10d | 1 | 0.53mi |
| 260 Prescott N Unit 260 Deerfield Beach, FL | 1.0 | 1.5 | 700 | $1,500 | $2.14 | 24d | 1 | 0.54mi |
| 226 Newport O Deerfield Beach, FL | 1.0 | 1.5 | 700 | $1,600 | $2.29 | 3d | 1 | 0.56mi |
| 226 Newport O Deerfield Beach, FL | 1.0 | 1.5 | 700 | $1,700 | $2.43 | 24d | 1 | 0.56mi |
| 306 Newport T #306 Deerfield Beach, FL | 1.0 | 1.0 | 585 | $1,350 | $2.31 | 24d | 1 | 0.56mi |
| 51 Tilford S Unit 51 Deerfield Beach, FL | 2.0 | 1.5 | 820 | $1,800 | $2.20 | 24d | 1 | 0.59mi |
| 295 Newport Dr Unit 295 Deerfield Beach, FL | 1.0 | 1.0 | 595 | $1,450 | $2.44 | 24d | 1 | 0.59mi |
| 102 Westbury E #102 Deerfield Beach, FL | 1.0 | 1.0 | 585 | $1,900 | $3.25 | 7d | 1 | 0.63mi |
| 98 Westbury E #98 Deerfield Beach, FL | 1.0 | 1.0 | 585 | $1,600 | $2.74 | 24d | 1 | 0.63mi |
| 125 Westbury E Deerfield Beach, FL | 1.0 | 1.0 | 585 | $1,600 | $2.74 | 24d | 1 | 0.64mi |
| 127 Westbury Cir Deerfield Beach, FL | 1.0 | 1.0 | 585 | $1,425 | $2.44 | 24d | 1 | 0.66mi |
| 3042 Harwood E Unit 3042 Deerfield Beach, FL | 2.0 | 2.0 | 860 | $3,000 | $3.49 | 24d | 1 | 0.67mi |
| 2460 Deer Creek Country Club Blvd Unit 205A Deerfield Beach, FL | 2.0 | 1.5 | 1050 | $1,800 | $1.71 | 24d | 1 | 0.70mi |
| 2400 Deer Creek Country Club Blvd Deerfield Beach, FL | 2.0 | 2.0 | 1050 | $2,300 | $2.19 | 24d | 1 | 0.70mi |
HOA detail condo
- Monthly dues
- $714 · $8,568/yr
- Likely covers
- water
- Assessments
- None detected in remarks — confirm with the listing agent.
Listing history 17 events
-
2026-06-18days on market $130,000 Active 264 DOM
-
2026-06-17days on market $130,000 Active 263 DOM
-
2026-06-16days on market $130,000 Active 262 DOM
-
2026-06-15days on market $130,000 Active 261 DOM
-
2026-06-13days on market $130,000 Active 259 DOM
-
2026-06-09days on market $130,000 Active 255 DOM
-
2026-06-07days on market $130,000 Active 253 DOM
-
2026-06-04days on market $130,000 Active 250 DOM
-
2026-06-03days on market $130,000 Active 249 DOM
-
2026-06-02days on market $130,000 Active 248 DOM
-
2026-06-01days on market $130,000 Active 247 DOM
-
2026-05-31days on market $130,000 Active 246 DOM
-
2026-05-09status Active
-
2026-03-27price $130,000
-
2026-03-06price $140,000
-
2025-10-15price $145,000
-
2025-09-19$155,000 Active
ⓘ Source: listings_history table (triggers on properties + properties_extension) + one-shot
backfill from property_details.listing_events for pre-trigger history.
Nearby sold comps map
Loading sold comps map…
Walkable amenities ~0.75 mi
Loading nearby amenities…
Taxation est. · year 1
- Rental income
- $22,459
- − Mortgage interest
- −$7,282
- − Property taxes
- −$1,950
- − Insurance
- −$650
- − Repairs & maintenance
- −$1,797
- − Management
- −$1,797
- − HOA
- −$8,568
- − Depreciation
- −$3,782
- Taxable loss
- −$3,366
- Est. tax savings @ 24.0%
- +$808
- After-tax cash flow
- $-798/yr
For passive investors: Depreciation is non-cash, so a rental often shows a tax loss while cash-flowing — sheltering income. Rental losses are passive: they offset passive income freely, and up to $25,000/yr can offset ordinary (W-2) income if you actively participate and your MAGI is under $100k (phasing out to $0 by $150k); unused losses carry forward. On sale, claimed depreciation is recaptured at up to 25%, and gains may owe capital-gains tax (a 1031 exchange can defer both). Figures are a year-1 estimate at your 24.0% rate — not tax advice; consult a CPA.
Schools (NCES district)
- District
- Broward
- NCES district ID
- 1200180
- Math proficiency
- 42% ▼ -18.00%
- Reading proficiency
- 53% ▼ -5.00%
- Median HH income
- $52,139
- Composite
- 40.88/100
- National rank
- #3621
- State rank
- #46 of 73 in FL
Livability — Deerfield Beach
- Score
- 75/100
- State rank
- #250
- US rank
- #3970
Category grades
Schools grade is shown separately in the Schools card above.
Census & demographics
- Census place
- Deerfield Beach, FL
- County
- Broward County · 1,963,430 people
- City population
- 61,449
- Metro
- Miami-Fort Lauderdale-Pompano Beach, FL
- Population (ZIP)
- 31,296
- Household income
- $53,254
- Rent vs Own
- Severe rent burden
- 2169.0
Population outlook (Broward County) Hauer SSP2
- Today (2025)
- 2,207,033 people
- By 2030
- 2,360,704 · +7.0%
- By 2040
- 2,661,208 · +20.6%
- By 2050
- 2,946,698 · +33.5%
- By 2075
- 3,602,273 · +63.2%
- By 2100
- 3,970,984 · +79.9%
Race, ethnicity, and origin ACS 2023
- Neighborhood character
- Diverse neighborhood (Simpson 0.61)
- Race & ethnicity
- White 57% Hispanic / Latino 23% Two or more races 19% Black 10% Asian 2%
- Hispanic origin (detail)
- Mexican 1% Puerto Rican 4% Cuban 3%
- Common ancestry
- Estonian 7% Romanian 4% Hispanic 3%
- Foreign-born
- 34% · Canada, Jamaica, Dominican Republic
- Languages at home
- 59% English-only · Spanish 20% Other Indo-European 13% French/Haitian/Cajun 4%
Political lean MEDSL · Broward
- 2024 margin
- D (+17.0) · D 58.0% · R 41.0%
- 2008→2024 swing
- -17.8pp toward R · 2008: 34.7pp · 2024: 17.0pp
- All cycles
- 2024: D+17.0 2020: D+29.8 2016: D+35.0 2012: D+34.9 2008: D+34.7
Not yet ingested
- Civics
- —
Market trends
- HPI YoY
- ▼ -280.44%
- Current HPI
- 323.0166
- Rent YoY
- ▲ 0.10%
- Metro
- Miami-Fort Lauderdale-Pompano Beach, FL
- State GDP YoY
- ▲ 3.28%
- F500 in state
- 36
Industry mix (Fortune 500 HQ in FL)
| Industry | F500 HQs | Revenue |
|---|---|---|
| Industrial Technology | 2 | $29B |
|
||
| Insurance | 2 | $17B |
|
||
| Retail | 1 | $60B |
|
||
| Technology Distribution | 1 | $58B |
|
||
| Homebuilding | 1 | $35B |
|
||
| Technology Manufacturing | 1 | $35B |
|
||
Price history
-16.1% since first listed5 events — show timeline
- 2026-05-09 Relisted — MARMLS
- 2026-03-27 Price Changed $130,000 MARMLS
- 2026-03-06 Price Changed $140,000 MARMLS
- 2025-10-15 Price Changed $145,000 MARMLS
- 2025-09-19 Listed $155,000 MARMLS
Cash-flow waterfall
monthlySold comps — $/sqft
last 12 mo · ≤1 miLoading sold comps…