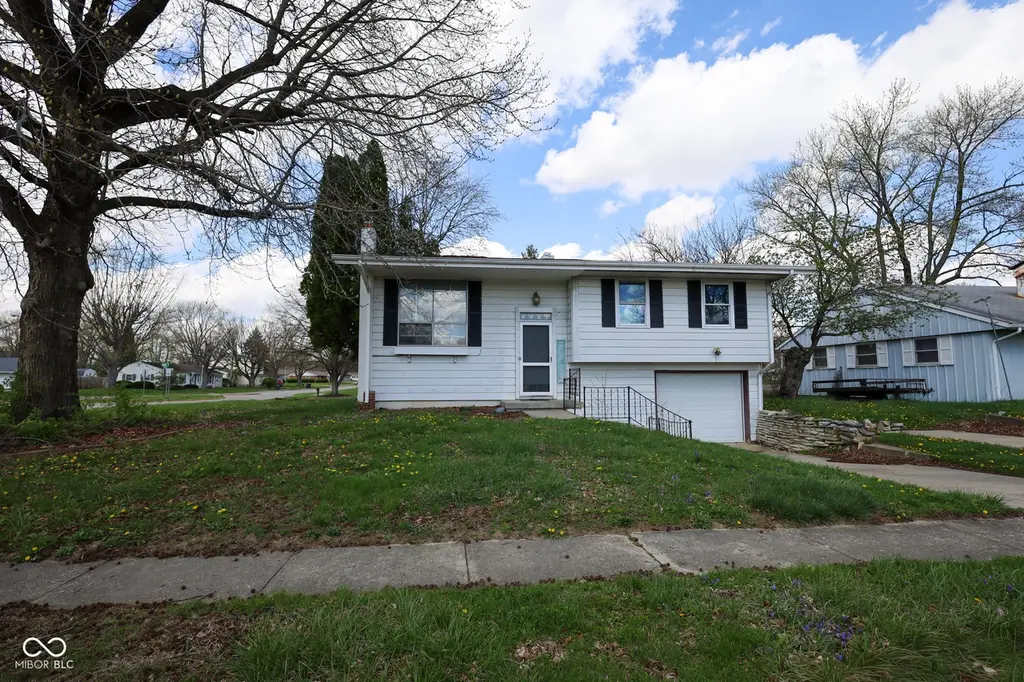
2322 Aspen Ct · Anderson, IN
Flood risk 1/10 · Minimal
- FEMA flood zone
- X (unshaded)
- Chance of flooding over 30 yrs
- 0.0%
- Est. flood insurance / yr
- $507 – $1,088
Fire risk 1/10 · Minimal
- Est. fire insurance / yr
- $717 – $1,331
Heat risk 3/10 · Minor
- Hot days now (above 100°F)
- 7 days/yr
- Hot days in 30 yrs
- 18 days/yr
Wind risk 2/10 · Minimal
- Chance of severe wind over 30 yrs
- 0.0%
Air-quality risk 3/10 · Minor
- Unhealthy air days now
- 2 days/yr
- Unhealthy air days in 30 yrs
- 3 days/yr
Risk factors via First Street. Map © Google.
Why this score? — see what drove the D+ grade
The composite is a weighted blend of 9 inputs, each scored 0–100. Each bar is that input's sub-score; the figure is the points it added to the 100-point composite (weight × sub-score).
- Cash flow +15.2/30.0
- ARV discount +15.0/15.0
- DSCR +4.7/10.0
- 1% rule +4.6/10.0
- Livability +3.0/5.0
- Rent growth +2.5/5.0
- Condition / age +2.5/5.0
- Schools +1.6/10.0
- Appreciation +0.0/10.0
$155,000
🖨 Deal sheet (PDF) 📄 Offer letter ✓ Due diligence
Listing remarks MLS
Great bi-level home on corner lot! 4 Bedrooms with many updates including new paint and flooring.
Key facts
- 7,584 sq ft lot
- Garage
- Built 1962
Neighborhood map
What this means for you Summary
Snapshot
- This is a 3-bed/1.5-bath single-family listed at $155k.
Deal economics
- At list price, monthly cash flow is $55 ($663/yr) — positive.
- The deal already cash-flows at list — no discount required.
- To meet the 1% rule (rent ≥ 1% of price), the offer needs to be $150k (3.5% below list).
- Recommended offer: $150k (3.5% below list) — sets the bar for 1% rule.
Location & tenants
- Location reads 60/100 on livability (#521 in IN) — a middle-class / working-renter tenant base. Strengths: cost of living A+, housing A+; Watch: schools F, crime D-, amenities F.
- Anderson Community School Corporation (urban): math 15% / reading 23% proficiency, ranked #280 of 301 in IN (top 93%) — low school quality limits family demand, transient renter base, plan for 1-2y turnover; 70% free/reduced lunch — lower-income household profile, screen leases tightly.
- Market conditions: 107 active listings in the ZIP; 1 comparable units currently listed for rent nearby; 184 units permitted in Madison County in 2024 (0 in 5+ unit buildings).
Forward outlook
- Local home prices are declining (-3.0%/yr); year-one equity from $1k of loan paydown is wiped out by about $5k of value loss. Plan a longer hold.
- Madison County population projected at -14% by 2050 — secular population decline; favor cash flow + early exit over multi-decade hold.
Negotiation context
- Only 12 days on market — expect competitive offers; lowballing is unlikely to land.
- 5 sale attempts since 9y ago with the ask held roughly flat each time — persistent listings suggest the price (not the market) is what's stuck; bring a comps-based counter.
- Current owner paid $132k; 17% above their basis — modest negotiation headroom, anchor on the comps not their cost.
Questions for the listing agent
- Built in 1962 — when were the roof, HVAC, electrical panel, plumbing, and water heater last replaced?
- Is there a deadline driving the sale (1031 exchange, divorce, estate, relocation)? That informs how much negotiation room exists.
- Schools are F-rated, which usually means shorter tenancies and higher turnover. Who's the typical renter profile here, and what's been the actual vacancy rate?
- Crime grade is D in this area — have there been break-ins, vandalism, or insurance claims at this property in the last 3 years? What carrier currently insures it and at what premium?
- The area grade is low — what's the realistic commute time and amenity access for the typical tenant pool here? Any planned neighborhood developments (good or bad) we should know about?
- What's the average days-on-market for RENTAL listings here right now (not sales)? A rising rental-DOM trend means longer vacancies and softer asking-rent achievability than the comps imply.
- What's the recent tenant-quality profile in this submarket — average credit score on applications, eviction rate, late-payment / NSF rate, and stable-employment percentage? A property-management company in the area should have these aggregated.
- How much new for-sale + rental construction is in the pipeline within 1–3 miles? Heavy new supply typically softens prices + rents 12–24 months out; constrained supply supports both.
Investment metrics
- 1% rule
- 0.96% ✗
- Cap rate
- 6.72%
- Cash-on-cash
- 1.53%
- DSCR
- 1.07
- GRM
- 8.6
CMA / ARV
- ARV (on-the-fly)
- $226,816
- Comps found
- 12
Show comp detail 12 sales within ~0.75 mi
| Address | Dist | Beds/Ba | Sqft | Sold | Price | $/sf | Match |
|---|---|---|---|---|---|---|---|
| 2412 Bramble Way | 0.06mi | 3/1.0 | 1,581 (-11%) | 2mo | $100,000 | $63 | 75 |
| 1815 Hillcrest Ave | 0.48mi | 3/2.5 | 1,730 (-2%) | 4mo | $248,000 | $143 | 66 |
| 1645 Woodview Ln | 0.50mi | 3/2.0 | 1,751 (-1%) | 13mo | $224,000 | $128 | 62 |
| 2440 Sagamore Dr | 0.55mi | 3/2.0 | 1,703 (-4%) | 7mo | $290,000 | $170 | 60 |
| 917 Summerlin Ct | 0.51mi | 3/2.0 | 1,877 (+6%) | 8mo | $314,500 | $168 | 57 |
| 1306 Woodbine Dr | 0.14mi | 4/1.0 (+1) | 1,517 (-14%) | 11mo | $175,000 | $115 | 53 |
| 1405 Woodbine Dr | 0.10mi | 4/2.0 (+1) | 1,998 (+13%) | 17mo | $194,900 | $98 | 53 |
| 1808 Oakwood Dr | 0.42mi | 3/2.0 | 1,698 (-4%) | 22mo | $235,000 | $138 | 53 |
| 1813 Kingsley Dr | 0.53mi | 3/2.0 | 1,891 (+7%) | 12mo | $245,000 | $130 | 52 |
| Lot 34 Doe Meadow Dr | 0.45mi | 3/2.0 | 2,018 (+14%) | 4mo | $45,900 | $23 | 50 |
| 1704 Greenwood Dr | 0.33mi | 4/2.5 (+1) | 1,612 (-9%) | 20mo | $173,900 | $108 | 44 |
| 1701 Kingsley Dr | 0.58mi | 4/2.5 (+1) | 1,950 (+10%) | 21mo | $220,000 | $113 | 30 |
Match score weights: distance 35% · size 25% · config 20% · recency 20%. Top-matched comps best support the ARV.
Projected returns pro-forma
-3.0% appreciation · 3.0% rent growth · sell at horizon
- IRR
- -13.8%
- Equity multiple
- 0.50×
- Total profit
- $-21,539
- Equity at exit
- $23,111
- IRR
- -4.9%
- Equity multiple
- 0.68×
- Total profit
- $-13,994
- Equity at exit
- $13,402
Cash invested: $43,400 (down + closing). Projections, not guarantees.
Landlord ↔ Tenant lean methodology
- Overall (STATE)
- 90 Strongly Landlord-Friendly
- State Indiana
- 90 Strongly Landlord-Friendly · R+11
- County
- — inherits STATE
- City
- — inherits STATE
ZIP-level market 46011
- Home prices YoY
- -25.0%
- Active inventory
- 107
- Price-to-rent
- 8.6×
Monthly cashflow live
- Estimated rent
- $1,495 medium interval (Pro) →
- Mortgage (P&I)
- −$813
- Tax from tax record
- −$248 /mo · $2,980/yr
- Insurance
- −$65
- HOA
- −$0
- Vacancy / Maint / Mgmt
- −$314
- Net cashflow
- $55
Break-even live
Sensitivity live
| Price | -10% $143 | -5% $99 | +0% $55 | +5% $11 | +10% $-32 |
|---|---|---|---|---|---|
| Rent | -10% $-63 | -5% $-4 | +0% $55 | +5% $114 | +10% $173 |
| Rate | -1.0pp $133 | -0.5pp $95 | base $55 | +0.5pp $15 | +1.0pp $-26 |
UW: 25.0% down · 7.5% · 30yr · 1.5% tax · 5.0% vac · 8.0% maint · 8.0% mgmt
Financing live
Cash to close
- Down payment
- $38,750
- Closing costs
- $4,650
- Reserves months
- —
- Total cash needed
- —
Loan-product check · same deal, 3 products live
Conventional
25% down · 7.5% · 30yr
- Down + closing
- —
- Monthly P&I
- —
- Monthly cashflow
- —
- DSCR
- —
- Eligible?
- —
Personal DTI + credit; lowest rate.
DSCR
20% down · 8.5% · 30yr
- Down + closing
- —
- Monthly P&I
- —
- Monthly cashflow
- —
- DSCR
- —
- Eligible?
- —
No personal income docs; deal must DSCR.
Hard money
10% down · 12.0% · 12mo
- Down + closing
- —
- Monthly P&I
- —
- Monthly cashflow
- —
- DSCR
- —
- Eligible?
- —
Short-term bridge; refi at stabilization.
Rent comps 1 comps
| Address | Beds | Baths | Sqft | Rent | $/sqft | DOM | Units | Dist |
|---|---|---|---|---|---|---|---|---|
| 521 W Vinyard St Anderson, IN | 3.0 | 2.0 | 1712 | $1,495 | $0.87 | 17d | 1 | 1.22mi |
Listing history 19 events
-
2026-06-21days on market $155,000 Active 12 DOM
-
2026-06-18days on market $155,000 Active 9 DOM
-
2026-06-17days on market $155,000 Active 8 DOM
-
2026-06-16days on market $155,000 Active 7 DOM
-
2026-06-15statusdays on market $155,000 Active 6 DOM
-
2026-04-16status Pending
-
2026-04-08$155,000 Active
-
2024-10-16historical $1,350
-
2024-09-28$1,350
-
2023-03-23soldstatus $132,000 Closed 98-char remark
Show marketing remark (98 chars)
Great bi-level home on corner lot! 4 Bedrooms with many updates including new paint and flooring.
-
2023-01-26status Pending 98-char remark
Show marketing remark (98 chars)
Great bi-level home on corner lot! 4 Bedrooms with many updates including new paint and flooring.
-
2023-01-25$140,000 Active 98-char remark
Show marketing remark (98 chars)
Great bi-level home on corner lot! 4 Bedrooms with many updates including new paint and flooring.
-
2021-08-25soldstatus $110,000 Closed 719-char remark
Show marketing remark (719 chars)
This home is a Wonderful Opportunity! New Roof installed in 2020. This home is a 4 Bedroom / 1.5 Bath home. The first story has a LARGE room that can be a bedroom with a half bath or would be a Wonderful family room. The second floor has 3 bedrooms and a full bath. Kitchen, Dining Room and Living room are an open concept space. New Wood floors have been installed. Kitchen cabinets have been updated. The appliances are newer also. Washer and Dryer included. Second Floor bathroom has been totally updated. New stairway banisters have been installed. There is an antique coal stove on the first floor, but has never been used by current owners. Has a privacy fence surrounding back yard and a one card garage.
-
2021-06-25status Pending 719-char remark
Show marketing remark (719 chars)
This home is a Wonderful Opportunity! New Roof installed in 2020. This home is a 4 Bedroom / 1.5 Bath home. The first story has a LARGE room that can be a bedroom with a half bath or would be a Wonderful family room. The second floor has 3 bedrooms and a full bath. Kitchen, Dining Room and Living room are an open concept space. New Wood floors have been installed. Kitchen cabinets have been updated. The appliances are newer also. Washer and Dryer included. Second Floor bathroom has been totally updated. New stairway banisters have been installed. There is an antique coal stove on the first floor, but has never been used by current owners. Has a privacy fence surrounding back yard and a one card garage.
-
2021-06-23$135,000 Active 719-char remark
Show marketing remark (719 chars)
This home is a Wonderful Opportunity! New Roof installed in 2020. This home is a 4 Bedroom / 1.5 Bath home. The first story has a LARGE room that can be a bedroom with a half bath or would be a Wonderful family room. The second floor has 3 bedrooms and a full bath. Kitchen, Dining Room and Living room are an open concept space. New Wood floors have been installed. Kitchen cabinets have been updated. The appliances are newer also. Washer and Dryer included. Second Floor bathroom has been totally updated. New stairway banisters have been installed. There is an antique coal stove on the first floor, but has never been used by current owners. Has a privacy fence surrounding back yard and a one card garage.
-
2018-01-12soldstatus $70,000 Sold
-
2017-11-16status Pending
-
2017-11-08price $75,900
-
2017-10-11$79,900 Active
ⓘ Source: listings_history table (triggers on properties + properties_extension) + one-shot
backfill from property_details.listing_events for pre-trigger history.
Tax reassessment forecast IN · Partial reset (capped growth)
- Current annual tax
- $2,980 · $248/mo
- Projected year-2 tax
- $2,980 · $248/mo
- Expected delta
- $0/yr ($0/mo · 0.0%)
ⓘ Screening estimate from a state-policy table — verify with the county assessor before closing.
Climate risk First Street
- Flood 1/10 Low FEMA zone X (unshaded) · 0% chance over 30 yrs
- Wildfire 1/10 Low
- Heat 3/10 Moderate 7 d/yr ≥100°F today · 18 d/yr by 30 yrs out
- Wind 2/10 Low 0% chance of damaging wind over 30 yrs
- Air quality 3/10 Moderate 2 unhealthy d/yr today · 3 by 30 yrs out
Nearby sold comps map
Loading sold comps map…
Walkable amenities ~0.75 mi
Loading nearby amenities…
Taxation est. · year 1
- Rental income
- $17,940
- − Mortgage interest
- −$8,682
- − Property taxes
- −$2,980
- − Insurance
- −$775
- − Repairs & maintenance
- −$1,435
- − Management
- −$1,435
- − Depreciation
- −$4,509
- Taxable loss
- −$1,877
- Est. tax savings @ 24.0%
- +$450
- After-tax cash flow
- $1,114/yr
For passive investors: Depreciation is non-cash, so a rental often shows a tax loss while cash-flowing — sheltering income. Rental losses are passive: they offset passive income freely, and up to $25,000/yr can offset ordinary (W-2) income if you actively participate and your MAGI is under $100k (phasing out to $0 by $150k); unused losses carry forward. On sale, claimed depreciation is recaptured at up to 25%, and gains may owe capital-gains tax (a 1031 exchange can defer both). Figures are a year-1 estimate at your 24.0% rate — not tax advice; consult a CPA.
Schools (NCES district)
- District
- Anderson Community School Corporation
- NCES district ID
- 1800150
- Math proficiency
- 15% ▼ -14.00%
- Reading proficiency
- 23% ▼ -7.00%
- Median HH income
- $38,208
- Composite
- 15.93/100
- National rank
- #9250
- State rank
- #280 of 301 in IN
Livability — Anderson
- Score
- 60/100
- State rank
- #521
- US rank
- #18709
Category grades
Schools grade is shown separately in the Schools card above.
Census & demographics
- Census place
- Anderson, IN
- City population
- 57,762
- Population (ZIP)
- 17,115
Population outlook (Madison County) Hauer SSP2
- Today (2025)
- 125,800 people
- By 2030
- 122,640 · -2.5%
- By 2040
- 115,420 · -8.3%
- By 2050
- 108,148 · -14.0%
- By 2075
- 91,838 · -27.0%
- By 2100
- 75,670 · -39.8%
Race, ethnicity, and origin ACS 2023
- Neighborhood character
- Predominantly White (79%)
- Race & ethnicity
- White 79% Black 8% Hispanic / Latino 6% Two or more races 6%
- Hispanic origin (detail)
- Mexican 5%
- Common ancestry
- Italian 2% Iranian 1% Slovak 1%
- Foreign-born
- 2% · Canada
- Languages at home
- 97% English-only · Spanish 3%
Political lean MEDSL · Madison
- 2024 margin
- Strong R (+26.9) · D 35.6% · R 62.5% · Other 1.9%
- 2008→2024 swing
- -33.5pp toward R · 2008: 6.5pp · 2024: -26.9pp
- All cycles
- 2024: R+26.9 2020: R+22.6 2016: R+25.7 2012: R+4.5 2008: D+6.5
Not yet ingested
- Civics
- —
Market trends
- HPI YoY
- ▼ -90.13%
- Current HPI
- 270.0253
- Rent YoY
- —
- Metro
- —
- State GDP YoY
- ▲ 2.90%
- F500 in state
- 18
Industry mix (Fortune 500 HQ in IN)
| Industry | F500 HQs | Revenue |
|---|---|---|
| Industrial Machinery | 2 | $37B |
|
||
| Healthcare | 1 | $177B |
|
||
| Pharmaceuticals | 1 | $45B |
|
||
| Metals / Steel | 1 | $18B |
|
||
| Agriculture | 1 | $17B |
|
||
| Packaging | 1 | $12B |
|
||
Price history
+94.0% since first listed14 events — show timeline
- 2026-04-16 Pending — MIBOR as Distributed by MLS Grid
- 2026-04-08 Listed $155,000 MIBOR as Distributed by MLS Grid
- 2024-10-16 Rental Removed $1,350 MIBOR
- 2024-09-28 Listed for Rent $1,350 MIBOR
- 2023-03-23 Sold (MLS) $132,000 MIBOR as Distributed by MLS Grid
- 2023-01-26 Pending — MIBOR as Distributed by MLS Grid
- 2023-01-25 Listed $140,000 MIBOR as Distributed by MLS Grid
- 2021-08-25 Sold (MLS) $110,000 MIBOR as Distributed by MLS Grid
- 2021-06-25 Pending — MIBOR as Distributed by MLS Grid
- 2021-06-23 Listed $135,000 MIBOR as Distributed by MLS Grid
- 2018-01-12 Sold (MLS) $70,000 MIBOR as Distributed by MLS Grid
- 2017-11-16 Pending — MIBOR as Distributed by MLS Grid
- 2017-11-08 Price Changed $75,900 MIBOR as Distributed by MLS Grid
- 2017-10-11 Listed $79,900 MIBOR as Distributed by MLS Grid
Property tax history
+38.9%/yrLatest (2024): $2,980 · +196.8% YoY. Source: county tax records.
Cash-flow waterfall
monthlySold comps — $/sqft
last 12 mo · ≤1 miLoading sold comps…