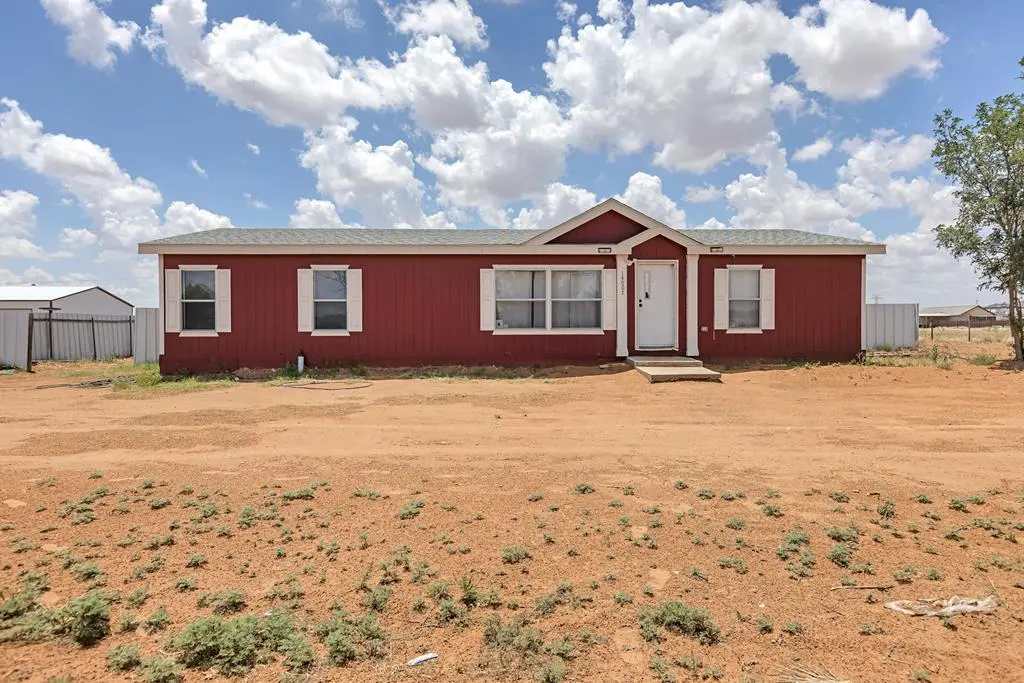
14005 N Loyola Ave · Gardendale, TX
Flood risk 1/10 · Minimal
- FEMA flood zone
- A
- Chance of flooding over 30 yrs
- 0.0%
- Est. flood insurance / yr
- $1,009 – $1,996
Fire risk 7/10 · Major
- Est. fire insurance / yr
- $1,222 – $2,270
Heat risk 6/10 · Moderate
- Hot days now (above 101°F)
- 7 days/yr
- Hot days in 30 yrs
- 23 days/yr
Wind risk 2/10 · Minimal
- Chance of severe wind over 30 yrs
- 4.0%
Air-quality risk 1/10 · Minimal
- Unhealthy air days now
- 0 days/yr
- Unhealthy air days in 30 yrs
- 0 days/yr
Risk factors via First Street. Map © Google.
Why this score? — see what drove the C- grade
The composite is a weighted blend of 9 inputs, each scored 0–100. Each bar is that input's sub-score; the figure is the points it added to the 100-point composite (weight × sub-score).
- Cash flow +22.6/30.0
- ARV discount +7.5/15.0
- DSCR +7.2/10.0
- 1% rule +5.1/10.0
- Livability +3.4/5.0
- Rent growth +2.5/5.0
- Condition / age +2.5/5.0
- Schools +2.2/10.0
- Appreciation +0.0/10.0
$220,000
🖨 Deal sheet 📄 Offer letter ✓ Due diligence
Listing remarks MLS
Loads of updates Roof replaced, Flooring replaced, Paint and much more. Take a look and see YOUR NEW HOME.
Key facts
- 1.41 acre lot
- Built 2009
- Listed 5 days
Property features AI
Exterior
- Parking: No parking provided
- Utilities: Public water; Septic tank sewer; Propane utilities; Solar energy generation
- Home design: Double wide manufactured home; Residential single-family property
- Construction: Pillar/post/pier foundation; Built with composition roofing
- Exterior features: No notable exterior features listed; Composition roof
Interior
- Kitchen: Electric range; Microwave; Dishwasher
- Flooring: Laminate
- Bathrooms: 2 full bathrooms
- Heating & cooling: Electric heating; Central electric air conditioning
- Interior features: Pantry; Breakfast bar
- Laundry & utility: Electric water heater
Neighborhood map
What this means for you Summary
Snapshot
- This is a 3-bed/2.0-bath manufactured listed at $220k.
Deal economics
- At list price, monthly cash flow is $248 ($3k/yr) — positive.
- The deal already cash-flows at list — no discount required.
- Meets the 1% rule at list price ($2k rent vs $220k).
Location & tenants
- Location reads 67/100 on livability (#562 in TX) — a middle-class / working-renter tenant base. Strengths: crime A+, employment A+, housing A+; Watch: health & safety C-, amenities F, commute F.
- Ector County ISD (urban): math 22% / reading 27% proficiency, ranked #707 of 826 in TX (top 86%) — low school quality limits family demand, transient renter base, plan for 1-2y turnover.
- Zoned schools: Barbara Jordan El (math 33% / reading 42%, grade F, #1,744 of 4,322 statewide, top 41%, 854 students, 51% FRL); Permian H S (math 19% / reading 29%, grade F, #1,333 of 1,632 statewide, top 82%, 3,978 students, 51% FRL) — zoned schools at 51% FRL track the district average.
- Market conditions: 80 active listings in the ZIP; 1,004 units permitted in Ector County in 2024 (0 in 5+ unit buildings).
Forward outlook
- Local home prices are declining (-3.0%/yr); year-one equity from $2k of loan paydown is wiped out by about $7k of value loss. Plan a longer hold.
- Ector County population projected at +78% by 2050 — long-run rental-demand tailwind backs the buy-and-hold thesis.
Negotiation context
- Only 5 days on market — expect competitive offers; lowballing is unlikely to land.
- 2 sale attempts since 2y ago with the ask held roughly flat each time — persistent listings suggest the price (not the market) is what's stuck; bring a comps-based counter.
Risks & watch-outs
- Watch-outs: flood insurance adds $125/mo.
- Climate carrying-cost: in FEMA flood zone A (mandatory federal flood insurance); major wildfire risk; extreme-heat days projected 7→23/yr by 2055 (HVAC capex compounding) — expect insurance premiums to compound above CPI over the hold.
Questions for the listing agent
- What's the actual annual flood-insurance premium (NFIP or private), and is the property in a SFHA with mandatory coverage?
- Is there a deadline driving the sale (1031 exchange, divorce, estate, relocation)? That informs how much negotiation room exists.
- Schools are F-rated, which usually means shorter tenancies and higher turnover. Who's the typical renter profile here, and what's been the actual vacancy rate?
- What's the average days-on-market for RENTAL listings here right now (not sales)? A rising rental-DOM trend means longer vacancies and softer asking-rent achievability than the comps imply.
- What's the recent tenant-quality profile in this submarket — average credit score on applications, eviction rate, late-payment / NSF rate, and stable-employment percentage? A property-management company in the area should have these aggregated.
- How much new for-sale + rental construction is in the pipeline within 1–3 miles? Heavy new supply typically softens prices + rents 12–24 months out; constrained supply supports both.
Investment metrics
- 1% rule
- 1.01% ✓
- Cap rate
- 8.33%
- Cash-on-cash
- 7.28%
- DSCR
- 1.32
- GRM
- 8.2
CMA / ARV
No comps found within radius.
Projected returns pro-forma
-3.0% appreciation · 3.0% rent growth · sell at horizon
- IRR
- -8.8%
- Equity multiple
- 0.68×
- Total profit
- $-19,800
- Equity at exit
- $32,803
- IRR
- 0.7%
- Equity multiple
- 1.05×
- Total profit
- $3,244
- Equity at exit
- $19,022
Cash invested: $61,600 (down + closing). Projections, not guarantees.
Landlord ↔ Tenant lean methodology
- Overall (STATE)
- 87 Strongly Landlord-Friendly
- State Texas
- 87 Strongly Landlord-Friendly · R+5
- County
- — inherits STATE
- City
- — inherits STATE
ZIP-level market 79758
- Home prices YoY
- -27.1%
- Active inventory
- 80
- Price-to-rent
- 8.2×
Monthly cashflow live
- Estimated rent
- $2,227 medium interval (Pro) →
- Mortgage (P&I)
- −$1,154
- Tax from tax record
- −$141 /mo · $1,688/yr
- Insurance
- −$92
- Flood insurance flood zone
- −$125 /mo · $1,502/yr
- HOA
- −$0
- Vacancy / Maint / Mgmt
- −$468
- Net cashflow
- $248
Break-even live
UW: 25.0% down · 7.5% · 30yr · 1.5% tax · 5.0% vac · 8.0% maint · 8.0% mgmt
Financing live
Cash to close
- Down payment
- $55,000
- Closing costs
- $6,600
- Reserves months
- —
- Total cash needed
- —
Loan-product check · same deal, 3 products live
Conventional
25% down · 7.5% · 30yr
- Down + closing
- —
- Monthly P&I
- —
- Monthly cashflow
- —
- DSCR
- —
- Eligible?
- —
Personal DTI + credit; lowest rate.
DSCR
20% down · 8.5% · 30yr
- Down + closing
- —
- Monthly P&I
- —
- Monthly cashflow
- —
- DSCR
- —
- Eligible?
- —
No personal income docs; deal must DSCR.
Hard money
10% down · 12.0% · 12mo
- Down + closing
- —
- Monthly P&I
- —
- Monthly cashflow
- —
- DSCR
- —
- Eligible?
- —
Short-term bridge; refi at stabilization.
Listing history 14 events
-
2026-06-03status $220,000 Pending 5 DOM
-
2026-06-01days on market $220,000 Active 5 DOM
-
2026-05-31days on market $220,000 Active 4 DOM
-
2026-05-30days on market $220,000 Active 3 DOM
-
2026-05-27$220,000 Active
-
2024-08-23soldstatus Closed 106-char remark
Show marketing remark (106 chars)
Loads of updates Roof replaced, Flooring replaced, Paint and much more. Take a look and see YOUR NEW HOME.
-
2024-08-01status Pending 106-char remark
Show marketing remark (106 chars)
Loads of updates Roof replaced, Flooring replaced, Paint and much more. Take a look and see YOUR NEW HOME.
-
2024-07-13price $199,000 106-char remark
Show marketing remark (106 chars)
Loads of updates Roof replaced, Flooring replaced, Paint and much more. Take a look and see YOUR NEW HOME.
-
2024-07-01price $212,000 106-char remark
Show marketing remark (106 chars)
Loads of updates Roof replaced, Flooring replaced, Paint and much more. Take a look and see YOUR NEW HOME.
-
2024-06-13price $219,000 106-char remark
Show marketing remark (106 chars)
Loads of updates Roof replaced, Flooring replaced, Paint and much more. Take a look and see YOUR NEW HOME.
-
2024-05-10price $224,000 106-char remark
Show marketing remark (106 chars)
Loads of updates Roof replaced, Flooring replaced, Paint and much more. Take a look and see YOUR NEW HOME.
-
2024-04-12$239,000 Active 106-char remark
Show marketing remark (106 chars)
Loads of updates Roof replaced, Flooring replaced, Paint and much more. Take a look and see YOUR NEW HOME.
-
2023-08-14price $195,000
-
2022-07-29soldstatus
ⓘ Source: listings_history table (triggers on properties + properties_extension) + one-shot
backfill from property_details.listing_events for pre-trigger history.
Tax reassessment forecast TX · Resets to sale price
- Current annual tax
- $1,688 · $141/mo
- Projected year-2 tax
- $4,026 · $336/mo
- Expected delta
- +$2,338/yr (+$195/mo · 138.5%)
ⓘ Screening estimate from a state-policy table — verify with the county assessor before closing.
Climate risk First Street
- Flood 1/10 Low FEMA zone A · 0% chance over 30 yrs
- Wildfire 7/10 Severe
- Heat 6/10 Major 7 d/yr ≥101°F today · 23 d/yr by 30 yrs out
- Wind 2/10 Low 4% chance of damaging wind over 30 yrs
- Air quality 1/10 Low 0 unhealthy d/yr today · 0 by 30 yrs out
Nearby sold comps map
Loading sold comps map…
Walkable amenities ~0.75 mi
Loading nearby amenities…
Taxation est. · year 1
- Rental income
- $26,729
- − Mortgage interest
- −$12,323
- − Property taxes
- −$1,688
- − Insurance
- −$2,602
- − Repairs & maintenance
- −$2,138
- − Management
- −$2,138
- − Depreciation
- −$6,400
- Taxable loss
- −$562
- Est. tax savings @ 24.0%
- +$135
- After-tax cash flow
- $3,116/yr
For passive investors: Depreciation is non-cash, so a rental often shows a tax loss while cash-flowing — sheltering income. Rental losses are passive: they offset passive income freely, and up to $25,000/yr can offset ordinary (W-2) income if you actively participate and your MAGI is under $100k (phasing out to $0 by $150k); unused losses carry forward. On sale, claimed depreciation is recaptured at up to 25%, and gains may owe capital-gains tax (a 1031 exchange can defer both). Figures are a year-1 estimate at your 24.0% rate — not tax advice; consult a CPA.
Schools (NCES district)
- District
- Ector County ISD
- NCES district ID
- 4818000
- Math proficiency
- 22% ▼ -9.00%
- Reading proficiency
- 27% ▼ -4.00%
- Median HH income
- $52,740
- Composite
- 21.89/100
- National rank
- #8233
- State rank
- #707 of 826 in TX
Livability — Gardendale
- Score
- 67/100
- State rank
- #562
- US rank
- #10774
Category grades
Schools grade is shown separately in the Schools card above.
Census & demographics
- Population (ZIP)
- 2,568
Population outlook (Ector County) Hauer SSP2
- Today (2025)
- 212,765 people
- By 2030
- 241,962 · +13.7%
- By 2040
- 306,582 · +44.1%
- By 2050
- 379,755 · +78.5%
- By 2075
- 568,991 · +167.4%
- By 2100
- 709,829 · +233.6%
Race, ethnicity, and origin ACS 2023
- Neighborhood character
- Majority White (57%)
- Race & ethnicity
- White 57% Hispanic / Latino 40% Two or more races 9%
- Hispanic origin (detail)
- Mexican 39%
- Common ancestry
- Serbian 3% German 2% Subsaharan African 2%
- Foreign-born
- 7% · Canada
- Languages at home
- 73% English-only · Spanish 26% Russian/Polish/Slavic 1% French/Haitian/Cajun 1%
Political lean MEDSL · Ector
- 2024 margin
- Solid R (+52.9) · D 23.2% · R 76.1%
- 2008→2024 swing
- -4.9pp toward R · 2008: -48.0pp · 2024: -52.9pp
- All cycles
- 2024: R+52.9 2020: R+47.8 2016: R+40.6 2012: R+48.9 2008: R+48.0
Not yet ingested
- Civics
- —
Market trends
- HPI YoY
- ▼ -81.41%
- Current HPI
- 219.4945
- Rent YoY
- —
- Metro
- —
- State GDP YoY
- ▲ 3.95%
- F500 in state
- 110
Industry mix (Fortune 500 HQ in TX)
| Industry | F500 HQs | Revenue |
|---|---|---|
| Energy | 16 | $1,198B |
|
||
| Technology | 5 | $198B |
|
||
| Engineering / Construction | 4 | $72B |
|
||
| Energy Services | 3 | $60B |
|
||
| Utilities | 3 | $41B |
|
||
| Healthcare | 2 | $330B |
|
||
Price history
+12.8% since first listed10 events — show timeline
- 2026-05-27 Listed $220,000 ODMLS
- 2024-08-23 Sold (MLS) — ODMLS
- 2024-08-01 Pending — ODMLS
- 2024-07-13 Price Changed $199,000 ODMLS
- 2024-07-01 Price Changed $212,000 ODMLS
- 2024-06-13 Price Changed $219,000 ODMLS
- 2024-05-10 Price Changed $224,000 ODMLS
- 2024-04-12 Listed $239,000 ODMLS
- 2023-08-14 Price Changed $195,000 ODMLS
- 2022-07-29 Sold (Public Records) — Public Records
Property tax history
+12.3%/yrLatest (2025): $1,688 · +14.6% YoY. Source: county tax records.
Cash-flow waterfall
monthlySold comps — $/sqft
last 12 mo · ≤1 miLoading sold comps…