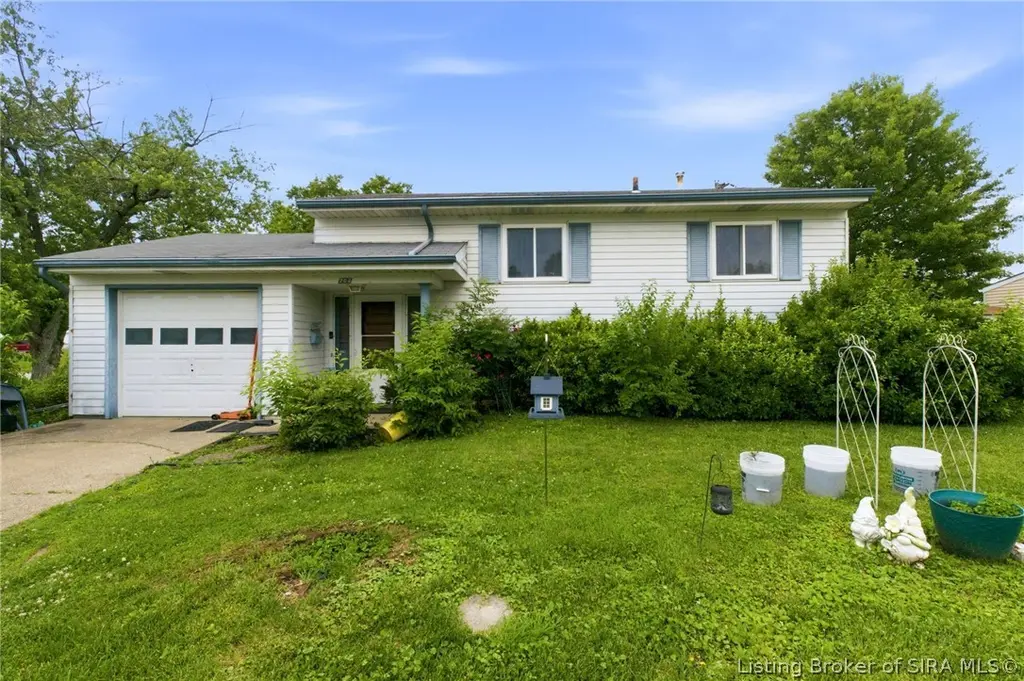
702 Cherokee Dr · New Albany, IN
Flood risk 1/10 · Minimal
- FEMA flood zone
- X (unshaded)
- Chance of flooding over 30 yrs
- 0.0%
- Est. flood insurance / yr
- $473 – $860
Fire risk 1/10 · Minimal
- Est. fire insurance / yr
- $717 – $1,331
Heat risk 5/10 · Moderate
- Hot days now (above 106°F)
- 7 days/yr
- Hot days in 30 yrs
- 20 days/yr
Wind risk 2/10 · Minimal
- Chance of severe wind over 30 yrs
- 1.0%
Air-quality risk 2/10 · Minimal
- Unhealthy air days now
- 1 days/yr
- Unhealthy air days in 30 yrs
- 2 days/yr
Risk factors via First Street. Map © Google.
Why this score? — see what drove the D+ grade
The composite is a weighted blend of 9 inputs, each scored 0–100. Each bar is that input's sub-score; the figure is the points it added to the 100-point composite (weight × sub-score).
- ARV discount +15.0/15.0
- Cash flow +12.4/30.0
- Rent growth +4.3/5.0
- Schools +4.2/10.0
- DSCR +3.7/10.0
- Livability +3.7/5.0
- 1% rule +2.9/10.0
- Condition / age +2.5/5.0
- Appreciation +0.0/10.0
$185,000
🖨 Deal sheet (PDF) 📄 Offer letter ✓ Due diligence
Listing remarks MLS
Spacious Bi-Level on a Large Corner Lot offering 1,536 square feet! 4 Bedrooms, 1.5 Bath home with large Eat-In Kitchen, Formal Living Room and Family Room, Garage, Fenced Yard. .. Great Home at a Great Price! New Paint and Carpeting! Appliances are negotiable. Average Utilities: Electric-$82, Gas-$63, All measurements are approximate and not guarenteed.
Key facts
- Oversized corner lot
- Open concept kitchen
- Fenced back yard
Tags
Property features AI
Exterior
- Parking: Attached garage (1 car) with garage facing front
- Utilities: Public sewer; Public water (connected)
- Home design: Vinyl siding; Frame construction; Resale property
- Construction: Vinyl siding and frame construction; Below-grade finished area present
- Exterior features: Paved driveway; Walk-out basement access
Interior
- Kitchen: Eat-in kitchen
- Bedrooms: Includes a family room
- Bathrooms: 1 full bathroom; 1 half bathroom
- Heating & cooling: Forced air heating; Central air conditioning
- Interior features: Ceiling fan(s); Entrance foyer; Eat-in kitchen; Mud room; Utility room
- Laundry & utility: Laundry room in basement; Basement utility/sump pump
Neighborhood map
What this means for you Summary
Snapshot
- This is a 3-bed/1.5-bath single-family listed at $185k.
Deal economics
- At list price, monthly cash flow is $-31 ($-377/yr) — negative.
- To cash-flow at today's rent, offer at most $179k (3.0% below list).
- To meet the 1% rule (rent ≥ 1% of price), the offer needs to be $146k (20.8% below list).
- Recommended offer: $146k (20.8% below list) — sets the bar for 1% rule.
- Cap rate 6.1% vs local median 3.8% in New Albany — top-decile yield for the area; either an underpriced asset or a hidden risk that comps aren't pricing in. Stress-test before assuming the spread holds.
Location & tenants
- Location reads 73/100 on livability (#100 in IN) — a middle-class / working-renter tenant base. Strengths: cost of living A+, housing A+, health & safety B; Watch: commute C-, employment D+, schools D.
- New Albany-Floyd County Consolidated Schools (suburban): math 46% / reading 50% proficiency, ranked #68 of 301 in IN (top 23%) — families likely to look elsewhere, expect single-tenant / working-renter base with shorter leases.
- Market conditions: Rents rising fast (+7.2%/yr); 269 active listings in the ZIP; 7 comparable units currently listed for rent nearby; rentals at typical pace (median 17d on market — plan ~3-4 weeks tenant-placement turnaround); 297 units permitted in Floyd County in 2024 (84 in 5+ unit buildings).
Forward outlook
- Local home prices are declining (-3.0%/yr); year-one equity from $1k of loan paydown is wiped out by about $6k of value loss. Plan a longer hold.
- Floyd County population projected at +10% by 2050 — modest demand growth; plan on rents tracking national, not racing it.
Negotiation context
- Only 5 days on market — expect competitive offers; lowballing is unlikely to land.
- 2 sale attempts since 15y ago with the ask held roughly flat each time — persistent listings suggest the price (not the market) is what's stuck; bring a comps-based counter.
- Current owner paid $90k; list at $185k implies a 106% gain — meaningful room to come down on a strong offer.
Risks & watch-outs
- Climate carrying-cost: extreme-heat days projected 7→20/yr by 2055 (HVAC capex compounding) — expect insurance premiums to compound above CPI over the hold.
Questions for the listing agent
- What do current leases actually rent for vs. the listed asking? Can we see a recent rent roll and the last 12 months of T-12 income?
- Built in 1963 — when were the roof, HVAC, electrical panel, plumbing, and water heater last replaced?
- Is there a deadline driving the sale (1031 exchange, divorce, estate, relocation)? That informs how much negotiation room exists.
- Schools are D-rated, which usually means shorter tenancies and higher turnover. Who's the typical renter profile here, and what's been the actual vacancy rate?
- The area grade is low — what's the realistic commute time and amenity access for the typical tenant pool here? Any planned neighborhood developments (good or bad) we should know about?
- What's the average days-on-market for RENTAL listings here right now (not sales)? A rising rental-DOM trend means longer vacancies and softer asking-rent achievability than the comps imply.
- What's the recent tenant-quality profile in this submarket — average credit score on applications, eviction rate, late-payment / NSF rate, and stable-employment percentage? A property-management company in the area should have these aggregated.
- How much new for-sale + rental construction is in the pipeline within 1–3 miles? Heavy new supply typically softens prices + rents 12–24 months out; constrained supply supports both.
Investment metrics
- 1% rule
- 0.79% ✗
- Cap rate
- 6.09%
- Cash-on-cash
- -0.73%
- DSCR
- 0.97
- GRM
- 10.5
CMA / ARV
- ARV (on-the-fly)
- $230,400
- Comps found
- 12
Show comp detail 12 sales within ~0.75 mi
| Address | Dist | Beds/Ba | Sqft | Sold | Price | $/sf | Match |
|---|---|---|---|---|---|---|---|
| 613 Cherokee Dr | 0.03mi | 3/1.5 | 1,536 (0%) | 6mo | $247,000 | $161 | 93 |
| 604 Navajo Dr | 0.09mi | 3/1.5 | 1,636 (+6%) | 4mo | $245,000 | $150 | 81 |
| 701 Cherokee Dr | 0.05mi | 4/1.5 (+1) | 1,728 (+12%) | 3mo | $255,000 | $148 | 69 |
| 806 Elmwood Ave | 0.35mi | 3/1.5 | 1,394 (-9%) | 1mo | $225,000 | $161 | 67 |
| 15 Robin Rd | 0.56mi | 4/2.0 (+1) | 1,510 (-2%) | 0mo | $253,000 | $168 | 64 |
| 2424 Stover Dr | 0.52mi | 3/1.5 | 1,400 (-9%) | 2mo | $244,900 | $175 | 59 |
| 2319 Alta Ave | 0.44mi | 2/1.0 (-1) | 1,384 (-10%) | 0mo | $125,000 | $90 | 56 |
| 1801 Rita Dr | 0.49mi | 3/1.5 | 1,722 (+12%) | 2mo | $255,000 | $148 | 55 |
| 1763 N Audubon Dr | 0.74mi | 4/1.0 (+1) | 1,536 (0%) | 5mo | $160,000 | $104 | 54 |
| 2592 E Robin Rd | 0.59mi | 2/1.0 (-1) | 1,414 (-8%) | 7mo | $183,000 | $129 | 47 |
| 211 Lawn Ct | 0.71mi | 3/1.0 | 1,754 (+14%) | 1mo | $180,000 | $103 | 41 |
| 2653 Roanoke Ave | 0.72mi | 4/2.0 (+1) | 1,355 (-12%) | 4mo | $299,000 | $221 | 37 |
Match score weights: distance 35% · size 25% · config 20% · recency 20%. Top-matched comps best support the ARV.
Projected returns pro-forma
-3.0% appreciation · 7.24% rent growth · sell at horizon
- IRR
- -13.2%
- Equity multiple
- 0.51×
- Total profit
- $-25,497
- Equity at exit
- $27,584
- IRR
- 1.0%
- Equity multiple
- 1.08×
- Total profit
- $4,262
- Equity at exit
- $15,995
Cash invested: $51,800 (down + closing). Projections, not guarantees.
Landlord ↔ Tenant lean methodology
- Overall (STATE)
- 90 Strongly Landlord-Friendly
- State Indiana
- 90 Strongly Landlord-Friendly · R+11
- County
- — inherits STATE
- City
- — inherits STATE
ZIP-level market 47150
- Rents YoY
- 7.2%
- Active inventory
- 269
- Price-to-rent
- 10.5×
Monthly cashflow live
- Estimated rent
- $1,464 high interval (Pro) →
- Mortgage (P&I)
- −$970
- Tax from tax record
- −$141 /mo · $1,692/yr
- Insurance
- −$77
- HOA
- −$0
- Vacancy / Maint / Mgmt
- −$308
- Net cashflow
- $-31
Break-even live
Sensitivity live
| Price | -10% $73 | -5% $21 | +0% $-31 | +5% $-84 | +10% $-136 |
|---|---|---|---|---|---|
| Rent | -10% $-147 | -5% $-89 | +0% $-31 | +5% $26 | +10% $84 |
| Rate | -1.0pp $62 | -0.5pp $16 | base $-31 | +0.5pp $-79 | +1.0pp $-128 |
UW: 25.0% down · 7.5% · 30yr · 1.5% tax · 5.0% vac · 8.0% maint · 8.0% mgmt
Financing live
Cash to close
- Down payment
- $46,250
- Closing costs
- $5,550
- Reserves months
- —
- Total cash needed
- —
Loan-product check · same deal, 3 products live
Conventional
25% down · 7.5% · 30yr
- Down + closing
- —
- Monthly P&I
- —
- Monthly cashflow
- —
- DSCR
- —
- Eligible?
- —
Personal DTI + credit; lowest rate.
DSCR
20% down · 8.5% · 30yr
- Down + closing
- —
- Monthly P&I
- —
- Monthly cashflow
- —
- DSCR
- —
- Eligible?
- —
No personal income docs; deal must DSCR.
Hard money
10% down · 12.0% · 12mo
- Down + closing
- —
- Monthly P&I
- —
- Monthly cashflow
- —
- DSCR
- —
- Eligible?
- —
Short-term bridge; refi at stabilization.
Rent comps 7 comps
| Address | Beds | Baths | Sqft | Rent | $/sqft | DOM | Units | Dist |
|---|---|---|---|---|---|---|---|---|
| 3133 Murr Ln New Albany, IN | 3.0 | 2.0 | 1533 | $1,850 | $1.21 | 21d | 1 | 0.73mi |
| 940 University Woods Dr New Albany, IN | 1.0–2.0 | 1.0–1.5 | 1000 | $1,049 | $1.05 | 16d | 1 | 0.78mi |
| 212 Maevi Dr New Albany, IN | 3.0 | 1.0 | 1251 | $1,375 | $1.10 | 21d | 1 | 1.05mi |
| 1808 Bono Rd New Albany, IN | 1.0–2.0 | 1.0–2.0 | 1000 | $1,035 | $1.03 | 3d | 1 | 1.11mi |
| 1429 Slate Run Rd New Albany, IN | 1.0–2.0 | 1.0–2.0 | 1200 | $1,365 | $1.14 | 15d | 4 | 1.17mi |
| 2000 Paddle Wheel Ct Jeffersonville, IN | 3.0–4.0 | 2.0 | 1175 | $1,470 | $1.25 | 2d | 1 | 1.18mi |
| 1559 Old Ford Rd New Albany, IN | 2.0 | 1.0 | 1300 | $1,500 | $1.15 | 21d | 1 | 1.49mi |
Listing history 3 events
-
2026-05-25$185,000 Active
-
2012-04-09soldstatus $90,000 356-char remark
Show marketing remark (356 chars)
Spacious Bi-Level on a Large Corner Lot offering 1,536 square feet! 4 Bedrooms, 1.5 Bath home with large Eat-In Kitchen, Formal Living Room and Family Room, Garage, Fenced Yard. .. Great Home at a Great Price! New Paint and Carpeting! Appliances are negotiable. Average Utilities: Electric-$82, Gas-$63, All measurements are approximate and not guarenteed.
-
2011-12-16$99,990 356-char remark
Show marketing remark (356 chars)
Spacious Bi-Level on a Large Corner Lot offering 1,536 square feet! 4 Bedrooms, 1.5 Bath home with large Eat-In Kitchen, Formal Living Room and Family Room, Garage, Fenced Yard. .. Great Home at a Great Price! New Paint and Carpeting! Appliances are negotiable. Average Utilities: Electric-$82, Gas-$63, All measurements are approximate and not guarenteed.
ⓘ Source: listings_history table (triggers on properties + properties_extension) + one-shot
backfill from property_details.listing_events for pre-trigger history.
Tax reassessment forecast IN · Partial reset (capped growth)
- Current annual tax
- $1,692 · $141/mo
- Projected year-2 tax
- $1,692 · $141/mo
- Expected delta
- $0/yr ($0/mo · 0.0%)
ⓘ Screening estimate from a state-policy table — verify with the county assessor before closing.
Climate risk First Street
- Flood 1/10 Low FEMA zone X (unshaded) · 0% chance over 30 yrs
- Wildfire 1/10 Low
- Heat 5/10 Major 7 d/yr ≥106°F today · 20 d/yr by 30 yrs out
- Wind 2/10 Low 100% chance of damaging wind over 30 yrs
- Air quality 2/10 Low 1 unhealthy d/yr today · 2 by 30 yrs out
Nearby sold comps map
Loading sold comps map…
Walkable amenities ~0.75 mi
Loading nearby amenities…
Taxation est. · year 1
- Rental income
- $17,572
- − Mortgage interest
- −$10,363
- − Property taxes
- −$1,692
- − Insurance
- −$925
- − Repairs & maintenance
- −$1,406
- − Management
- −$1,406
- − Depreciation
- −$5,382
- Taxable loss
- −$3,601
- Est. tax savings @ 24.0%
- +$864
- After-tax cash flow
- $487/yr
For passive investors: Depreciation is non-cash, so a rental often shows a tax loss while cash-flowing — sheltering income. Rental losses are passive: they offset passive income freely, and up to $25,000/yr can offset ordinary (W-2) income if you actively participate and your MAGI is under $100k (phasing out to $0 by $150k); unused losses carry forward. On sale, claimed depreciation is recaptured at up to 25%, and gains may owe capital-gains tax (a 1031 exchange can defer both). Figures are a year-1 estimate at your 24.0% rate — not tax advice; consult a CPA.
Schools (NCES district)
- District
- New Albany-Floyd County Consolidated Schools
- NCES district ID
- 1807410
- Math proficiency
- 46% ▼ -4.00%
- Reading proficiency
- 50% ▼ -3.00%
- Median HH income
- $54,709
- Composite
- 41.57/100
- National rank
- #3441
- State rank
- #68 of 301 in IN
Livability — New Albany
- Score
- 73/100
- State rank
- #100
- US rank
- #5454
Category grades
Schools grade is shown separately in the Schools card above.
Census & demographics
- Census place
- New Albany, IN
- County
- Floyd County · 49,144 people
- City population
- 49,144
- Metro
- Louisville/Jefferson County, KY-IN
- Population (ZIP)
- 49,144
- Household income
- $62,820
- Rent vs Own
- Severe rent burden
- 1737.0
Population outlook (Floyd County) Hauer SSP2
- Today (2025)
- 82,092 people
- By 2030
- 84,384 · +2.8%
- By 2040
- 87,919 · +7.1%
- By 2050
- 89,958 · +9.6%
- By 2075
- 94,159 · +14.7%
- By 2100
- 91,907 · +12.0%
Race, ethnicity, and origin ACS 2023
- Neighborhood character
- Predominantly White (82%)
- Race & ethnicity
- White 82% Black 8% Two or more races 6% Hispanic / Latino 5% Asian 1%
- Common ancestry
- Italian 3% Slovak 2% Lithuanian 2%
- Foreign-born
- 3% · Canada
- Languages at home
- 96% English-only · Spanish 2% Other Asian/Pacific 1%
Political lean MEDSL · Floyd
- 2024 margin
- R (+15.5) · D 41.4% · R 56.9% · Other 1.7%
- 2008→2024 swing
- -5.4pp toward R · 2008: -10.1pp · 2024: -15.5pp
- All cycles
- 2024: R+15.5 2020: R+14.1 2016: R+20.1 2012: R+14.3 2008: R+10.1
Not yet ingested
- Civics
- —
Market trends
- HPI YoY
- ▼ -185.20%
- Current HPI
- 206.7738
- Rent YoY
- ▲ 7.24%
- Metro
- Louisville/Jefferson County, KY-IN
- State GDP YoY
- ▲ 2.90%
- F500 in state
- 18
Industry mix (Fortune 500 HQ in IN)
| Industry | F500 HQs | Revenue |
|---|---|---|
| Industrial Machinery | 2 | $37B |
|
||
| Healthcare | 1 | $177B |
|
||
| Pharmaceuticals | 1 | $45B |
|
||
| Metals / Steel | 1 | $18B |
|
||
| Agriculture | 1 | $17B |
|
||
| Packaging | 1 | $12B |
|
||
Price history
+85.0% since first listed3 events — show timeline
- 2026-05-25 Listed $185,000 SIRA
- 2012-04-09 Sold (MLS) $90,000 SIRA
- 2011-12-16 Listed $99,990 SIRA
Property tax history
-1.3%/yrLatest (2024): $1,692 · -5.0% YoY. Source: county tax records.
Cash-flow waterfall
monthlySold comps — $/sqft
last 12 mo · ≤1 miLoading sold comps…