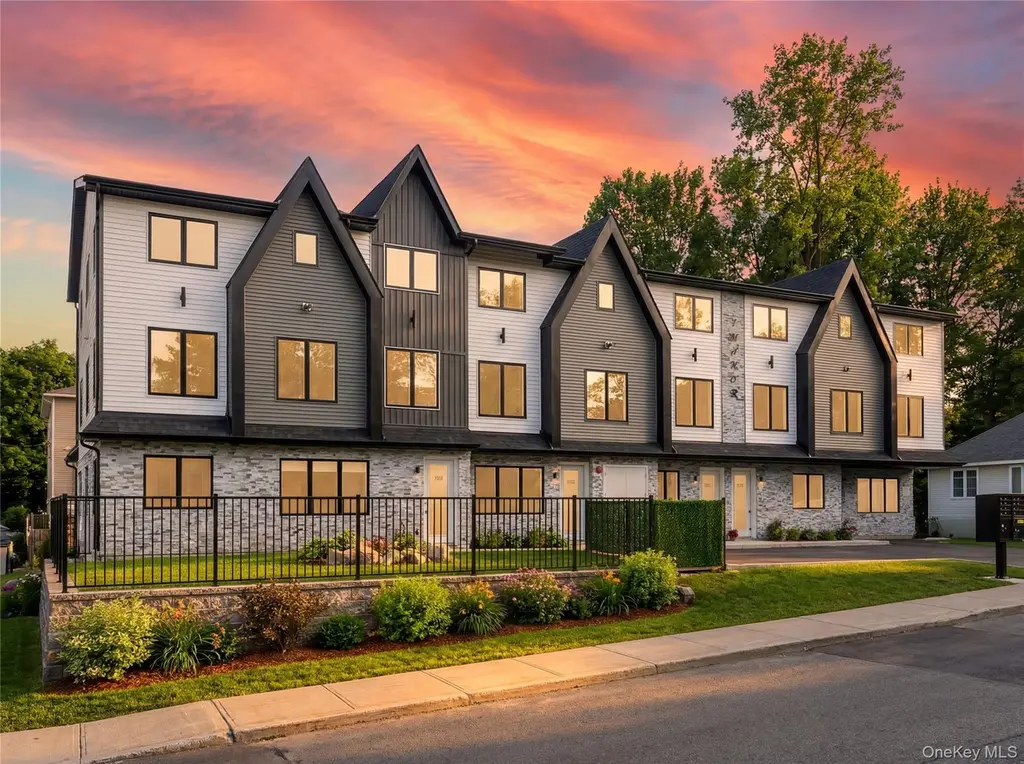
1 Manor Dr #202 · Monsey, NY
Flood risk 1/10 · Minimal
- FEMA flood zone
- X (unshaded)
- Chance of flooding over 30 yrs
- 0.0%
- Est. flood insurance / yr
- $473 – $860
Fire risk 1/10 · Minimal
- Est. fire insurance / yr
- $691 – $1,283
Heat risk 5/10 · Moderate
- Hot days now (above 97°F)
- 7 days/yr
- Hot days in 30 yrs
- 15 days/yr
Wind risk 5/10 · Moderate
- Chance of severe wind over 30 yrs
- 26.0%
Air-quality risk 3/10 · Minor
- Unhealthy air days now
- 2 days/yr
- Unhealthy air days in 30 yrs
- 4 days/yr
Risk factors via First Street. Map © Google.
Why this score? — see what drove the D grade
The composite is a weighted blend of 9 inputs, each scored 0–100. Each bar is that input's sub-score; the figure is the points it added to the 100-point composite (weight × sub-score).
- Cash flow +16.9/30.0
- DSCR +5.3/10.0
- 1% rule +5.0/10.0
- Condition / age +4.8/5.0
- Livability +3.1/5.0
- Schools +2.6/10.0
- Rent growth +2.5/5.0
- ARV discount +0.4/15.0
- Appreciation +0.0/10.0
$1,199,000
🖨 Deal sheet (PDF) 📄 Offer letter ✓ Due diligence
Listing remarks MLS
Move in Ready! Welcome to this spacious 5-bedroom, 3 full bath condo with a full basement, located at the desirable 1 Manor Drive. Built by the renowned Trodale Developers, this home showcases quality craftsmanship and modern design. Features include: Bright and open layout with generous living space Private full basement offering endless possibilities—family room, office, or extra storage 5 comfortable bedrooms and 3 full bathrooms thoughtfully designed for convenience Built with the high standards and attention to detail Trodale is known for Set in a prime location, this condo combines comfort, style, and practicality—an excellent choice for family living or investment.
Key facts
- Modern design
- Full basement
- Prime location
Tags
Neighborhood map
What this means for you Summary
Snapshot
- This is a 5-bed/3.5-bath condo listed at $1.20M. Condition is rated excellent.
Deal economics
- At list price, monthly cash flow is $799 ($10k/yr) — positive.
- The deal already cash-flows at list — no discount required.
- Meets the 1% rule at list price ($12k rent vs $1.20M).
- Recommended offer: $1.06M (12.0% below list) — sets the bar for market timing.
- Cap rate 7.1% vs local median 1.7% in Monsey — top-decile yield for the area; either an underpriced asset or a hidden risk that comps aren't pricing in. Stress-test before assuming the spread holds.
Location & tenants
- Location reads 62/100 on livability (#862 in NY) — a middle-class / working-renter tenant base. Strengths: health & safety A-, crime B; Watch: employment D+, amenities D, commute F.
- East Ramapo Central School District (Spring Valley) (suburban): math 22% / reading 34% proficiency, ranked #576 of 590 in NY (top 98%) — low school quality limits family demand, transient renter base, plan for 1-2y turnover; 68% free/reduced lunch — lower-income household profile, screen leases tightly.
- Zoned schools: Margetts Elementary School (math 22% / reading 32%, grade F, #1,786 of 2,108 statewide, top 86%, 609 students, 68% FRL); Chestnut Ridge Middle School (math 9% / reading 30%, grade F, #685 of 729 statewide, top 94%, 646 students, 83% FRL); Spring Valley High School (math 67% / reading 77%, grade B+, #677 of 1,100 statewide, top 63%, 1,434 students, 82% FRL).
- Market conditions: 154 active listings in the ZIP; 1 comparable units currently listed for rent nearby; 429 units permitted in Rockland County in 2024 (231 in 5+ unit buildings).
Forward outlook
- Local home prices are declining (-3.0%/yr); year-one equity from $8k of loan paydown is wiped out by about $36k of value loss. Plan a longer hold.
- Rockland County population projected at +7% by 2050 — modest demand growth; plan on rents tracking national, not racing it.
Negotiation context
- It's been on market 121 days — a 12% lower offer ($1.06M) is reasonable based on typical stale-listing flexibility.
- 2 sale attempts with the ask held roughly flat each time — persistent listings suggest the price (not the market) is what's stuck; bring a comps-based counter.
Risks & watch-outs
- Climate carrying-cost: moderate wind risk, 26% chance of damaging wind over 30y; extreme-heat days projected 7→15/yr by 2055 (HVAC capex compounding) — expect insurance premiums to compound above CPI over the hold.
Questions for the listing agent
- It's been on market 121 days. Have you received any prior offers? Is the seller open to a 12% concession, seller financing, or rate buy-down credit?
- What does the HOA fee cover, when was the last increase, and are there any pending special assessments or reserve-fund shortfalls?
- Any open or pending special assessments — roof, HVAC, plumbing, elevator, façade? What's the per-unit balance and payoff schedule, and is the seller paying it off at close or rolling it to the buyer?
- Why hasn't it sold? Are there any deal-killer items the seller is aware of (foundation, flood, title, zoning, code violations)?
- Is there a deadline driving the sale (1031 exchange, divorce, estate, relocation)? That informs how much negotiation room exists.
- Schools are D-rated, which usually means shorter tenancies and higher turnover. Who's the typical renter profile here, and what's been the actual vacancy rate?
- The area grade is low — what's the realistic commute time and amenity access for the typical tenant pool here? Any planned neighborhood developments (good or bad) we should know about?
- What's the average days-on-market for RENTAL listings here right now (not sales)? A rising rental-DOM trend means longer vacancies and softer asking-rent achievability than the comps imply.
- What's the recent tenant-quality profile in this submarket — average credit score on applications, eviction rate, late-payment / NSF rate, and stable-employment percentage? A property-management company in the area should have these aggregated.
- How much new apartment / multifamily construction is in the pipeline within 1–3 miles? Heavy new supply (>2% of stock underway) typically softens rents 12–24 months out; light construction supports rent growth.
Investment metrics
- 1% rule
- 1.00% ✓
- Cap rate
- 7.09%
- Cash-on-cash
- 2.86%
- DSCR
- 1.13
- GRM
- 8.3
CMA / ARV
- ARV (median comp)
- $1,035,083
- List price
- $1,199,000
- Delta
- 15.84%
- Verdict
- OVERPRICED
- Comps
- 20 within 1.0 mi
Projected returns pro-forma
-3.0% appreciation · 3.0% rent growth · sell at horizon
- IRR
- -11.8%
- Equity multiple
- 0.57×
- Total profit
- $-142,978
- Equity at exit
- $178,775
- IRR
- -2.5%
- Equity multiple
- 0.83×
- Total profit
- $-57,255
- Equity at exit
- $103,668
Cash invested: $335,720 (down + closing). Projections, not guarantees.
Landlord ↔ Tenant lean methodology
- Overall (STATE)
- 15 Strongly Tenant-Friendly
- State New York
- 15 Strongly Tenant-Friendly · D+10
- County
- — inherits STATE
- City
- — inherits STATE
ZIP-level market 10952
- Active inventory
- 154
- Price-to-rent
- 8.3×
Monthly cashflow live
- Estimated rent
- $12,000 medium interval (Pro) →
- Mortgage (P&I)
- −$6,288
- Tax est. 1.5%
- −$1,499 /mo · $17,985/yr
- Insurance
- −$500
- HOA
- −$395
- Vacancy / Maint / Mgmt
- −$2,520
- Net cashflow
- $799
Break-even live
Sensitivity live
| Price | -10% $1,628 | -5% $1,213 | +0% $799 | +5% $385 | +10% $-30 |
|---|---|---|---|---|---|
| Rent | -10% $-149 | -5% $325 | +0% $799 | +5% $1,273 | +10% $1,747 |
| Rate | -1.0pp $1,403 | -0.5pp $1,104 | base $799 | +0.5pp $488 | +1.0pp $172 |
UW: 25.0% down · 7.5% · 30yr · 1.5% tax · 5.0% vac · 8.0% maint · 8.0% mgmt
Financing live
Cash to close
- Down payment
- $299,750
- Closing costs
- $35,970
- Reserves months
- —
- Total cash needed
- —
Loan-product check · same deal, 3 products live
Conventional
25% down · 7.5% · 30yr
- Down + closing
- —
- Monthly P&I
- —
- Monthly cashflow
- —
- DSCR
- —
- Eligible?
- —
Personal DTI + credit; lowest rate.
DSCR
20% down · 8.5% · 30yr
- Down + closing
- —
- Monthly P&I
- —
- Monthly cashflow
- —
- DSCR
- —
- Eligible?
- —
No personal income docs; deal must DSCR.
Hard money
10% down · 12.0% · 12mo
- Down + closing
- —
- Monthly P&I
- —
- Monthly cashflow
- —
- DSCR
- —
- Eligible?
- —
Short-term bridge; refi at stabilization.
Rent comps 1 comps
| Address | Beds | Baths | Sqft | Rent | $/sqft | DOM | Units | Dist |
|---|---|---|---|---|---|---|---|---|
| 9 E Stemmer Ln Suffern, NY | 5.0 | 3.0 | 2432 | $12,000 | $4.93 | 0d | 1 | 1.45mi |
HOA detail condo
- Monthly dues
- $395 · $4,740/yr
- Assessments
- None detected in remarks — confirm with the listing agent.
Listing history 18 events
-
2026-06-21days on market $1,199,000 Active 121 DOM
-
2026-06-18days on market $1,199,000 Active 118 DOM
-
2026-06-17days on market $1,199,000 Active 117 DOM
-
2026-06-16days on market $1,199,000 Active 116 DOM
-
2026-06-15days on market $1,199,000 Active 115 DOM
-
2026-06-13days on market $1,199,000 Active 113 DOM
-
2026-06-13days on market $1,199,000 Active 112 DOM
-
2026-06-09days on market $1,199,000 Active 109 DOM
-
2026-06-08days on market $1,199,000 Active 108 DOM
-
2026-06-07days on market $1,199,000 Active 107 DOM
-
2026-06-04days on market $1,199,000 Active 104 DOM
-
2026-06-03days on market $1,199,000 Active 103 DOM
-
2026-06-02days on market $1,199,000 Active 102 DOM
-
2026-06-01days on market $1,199,000 Active 101 DOM
-
2026-05-31days on market $1,199,000 Active 100 DOM
-
2026-02-19$1,199,000 Active 695-char remark
Show marketing remark (695 chars)
Move in Ready! Welcome to this spacious 5-bedroom, 3 full bath condo with a full basement, located at the desirable 1 Manor Drive. Built by the renowned Trodale Developers, this home showcases quality craftsmanship and modern design. Features include: Bright and open layout with generous living space Private full basement offering endless possibilities—family room, office, or extra storage 5 comfortable bedrooms and 3 full bathrooms thoughtfully designed for convenience Built with the high standards and attention to detail Trodale is known for Set in a prime location, this condo combines comfort, style, and practicality—an excellent choice for family living or investment.
-
2025-09-14$1,175,000 Active
-
2025-09-12historical
ⓘ Source: listings_history table (triggers on properties + properties_extension) + one-shot
backfill from property_details.listing_events for pre-trigger history.
Climate risk First Street
- Flood 1/10 Low FEMA zone X (unshaded) · 0% chance over 30 yrs
- Wildfire 1/10 Low
- Heat 5/10 Major 7 d/yr ≥97°F today · 15 d/yr by 30 yrs out
- Wind 5/10 Major 26% chance of damaging wind over 30 yrs
- Air quality 3/10 Moderate 2 unhealthy d/yr today · 4 by 30 yrs out
Nearby sold comps map
Loading sold comps map…
Walkable amenities ~0.75 mi
Loading nearby amenities…
Taxation est. · year 1
- Rental income
- $144,000
- − Mortgage interest
- −$67,163
- − Property taxes
- −$17,985
- − Insurance
- −$5,995
- − Repairs & maintenance
- −$11,520
- − Management
- −$11,520
- − HOA
- −$4,740
- − Depreciation
- −$34,880
- Taxable loss
- −$9,803
- Est. tax savings @ 24.0%
- +$2,353
- After-tax cash flow
- $11,940/yr
For passive investors: Depreciation is non-cash, so a rental often shows a tax loss while cash-flowing — sheltering income. Rental losses are passive: they offset passive income freely, and up to $25,000/yr can offset ordinary (W-2) income if you actively participate and your MAGI is under $100k (phasing out to $0 by $150k); unused losses carry forward. On sale, claimed depreciation is recaptured at up to 25%, and gains may owe capital-gains tax (a 1031 exchange can defer both). Figures are a year-1 estimate at your 24.0% rate — not tax advice; consult a CPA.
Condition & rehab AI · 13 photos
This move-in-ready condo is in excellent condition with no visible repairs needed. It offers a spacious layout, modern design, and prime location, making it an excellent choice for family living or investment.
Value-add opportunities
- Both Painting the exterior and interior walls — Fresh paint enhances curb appeal and interior aesthetics
- Both Landscaping improvements — Enhances curb appeal and adds value
- Both Adding smart home features — Improves convenience and adds modern appeal
Renovation cost estimate screening
Value-add ROI direction
- Both Painting the exterior and interior walls — Fresh paint enhances curb appeal and interior aesthetics ↑
- Both Landscaping improvements — Enhances curb appeal and adds value ↑
- Both Adding smart home features — Improves convenience and adds modern appeal ↑
ⓘ Cost ranges are severity-bucket heuristics (US national rule-of-thumb). Get contractor quotes + a written scope before underwriting a rehab budget.
Schools (NCES district)
- District
- East Ramapo Central School District (Spring Valley)
- NCES district ID
- 3627810
- Math proficiency
- 22% ▼ -10.00%
- Reading proficiency
- 34% ▼ -2.00%
- Median HH income
- $61,547
- Composite
- 25.6/100
- National rank
- #7418
- State rank
- #576 of 590 in NY
Livability — Monsey
- Score
- 62/100
- State rank
- #862
- US rank
- #16633
Category grades
Schools grade is shown separately in the Schools card above.
Census & demographics
- Census place
- Monsey, NY
- City population
- 47,169
- Population (ZIP)
- 47,169
Population outlook (Rockland County) Hauer SSP2
- Today (2025)
- 339,642 people
- By 2030
- 345,987 · +1.9%
- By 2040
- 357,178 · +5.2%
- By 2050
- 362,456 · +6.7%
- By 2075
- 367,281 · +8.1%
- By 2100
- 328,211 · -3.4%
Race, ethnicity, and origin ACS 2023
- Neighborhood character
- Predominantly White (88%)
- Race & ethnicity
- White 88% Black 6% Hispanic / Latino 4% Two or more races 3%
- Common ancestry
- Romanian 7% Italian 5% Hispanic 5%
- Foreign-born
- 12% · Canada
- Languages at home
- 34% English-only · German/W. Germanic 55% French/Haitian/Cajun 5% Spanish 2%
Political lean MEDSL · Rockland
- 2024 margin
- R (+11.8) · D 44.1% · R 55.9%
- 2008→2024 swing
- -17.7pp toward R · 2008: 5.9pp · 2024: -11.8pp
- All cycles
- 2024: R+11.8 2020: D+1.7 2016: D+5.1 2012: D+6.6 2008: D+5.9
Not yet ingested
- Civics
- —
Market trends
- HPI YoY
- ▼ -671.35%
- Current HPI
- 399.2068
- Rent YoY
- —
- Metro
- —
- State GDP YoY
- ▲ 2.60%
- F500 in state
- 92
Industry mix (Fortune 500 HQ in NY)
| Industry | F500 HQs | Revenue |
|---|---|---|
| Financial Services | 10 | $950B |
|
||
| Consumer Goods | 9 | $162B |
|
||
| Insurance | 4 | $225B |
|
||
| Telecommunications | 2 | $144B |
|
||
| Pharmaceuticals | 2 | $112B |
|
||
| Media / Entertainment | 2 | $69B |
|
||
Price history
+2.0% since first listed3 events — show timeline
- 2026-02-19 Listed $1,199,000 OneKey® MLS as Distributed by MLS Grid
- 2025-09-14 Listed $1,175,000 OneKey® MLS as Distributed by MLS Grid
- 2025-09-12 Coming Soon — OneKey® MLS as Distributed by MLS Grid
Cash-flow waterfall
monthlySold comps — $/sqft
last 12 mo · ≤1 miLoading sold comps…