 Multi-family
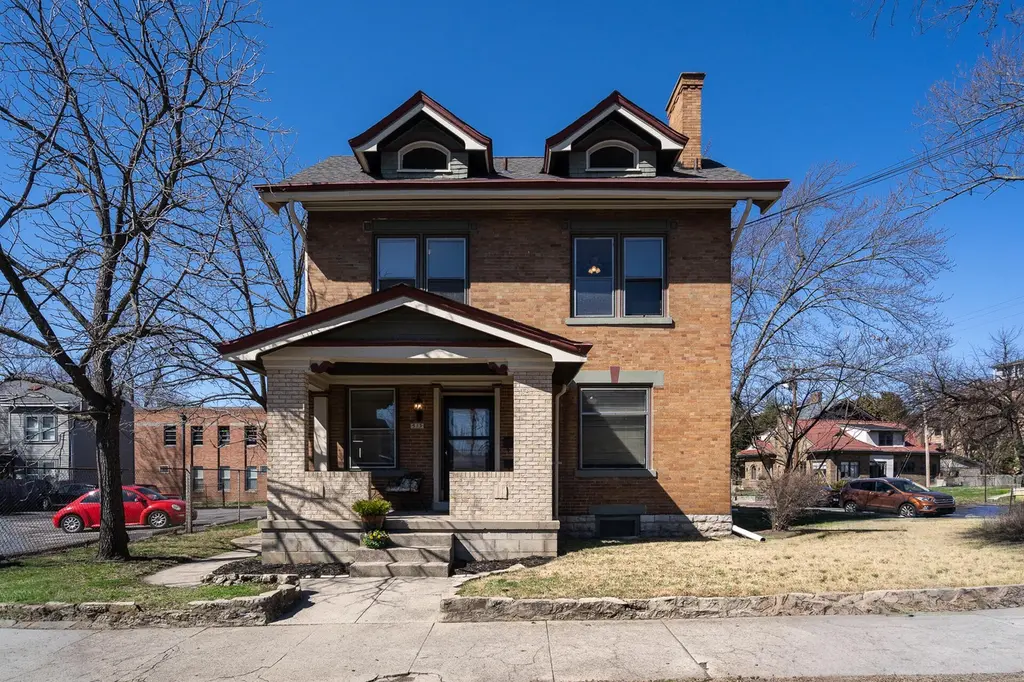
513 E 6th St · Newport, KY
Flood risk No data
- FEMA flood zone
- —
- Chance of flooding over 30 yrs
- —
- Est. flood insurance / yr
- —
Fire risk No data
- Est. fire insurance / yr
- —
Heat risk No data
- Hot days now (above threshold)
- —
- Hot days in 30 yrs
- —
Wind risk No data
- Chance of severe wind over 30 yrs
- —
Air-quality risk No data
- Unhealthy air days now
- —
- Unhealthy air days in 30 yrs
- —
Risk factors via First Street. Map © Google.
Why this score? — see what drove the B- grade
The composite is a weighted blend of 9 inputs, each scored 0–100. Each bar is that input's sub-score; the figure is the points it added to the 100-point composite (weight × sub-score).
- Cash flow +28.7/30.0
- DSCR +10.0/10.0
- ARV discount +7.5/15.0
- 1% rule +6.6/10.0
- Livability +4.1/5.0
- Condition / age +3.8/5.0
- Rent growth +3.7/5.0
- Schools +1.7/10.0
- Appreciation +0.0/10.0
$710,500
🖨 Deal sheet (PDF) 📄 Offer letter ✓ Due diligence
Multi-family units
County records classify this as Multi-Family (5+ Unit). Listing-text estimate: 1 unit. estimate disagrees with records
5+ unit building — per-unit beds/baths from public records are typically unavailable; the breakdown below (if shown) is an estimate from the listing text.
Listing remarks MLS
Situated on a desirable corner lot at 6th and Park Avenue. This charming 6-unit multi-family property features three 1-bedroom units and three studio units, each with one full bathroom. The building showcases beautiful natural woodwork throughout and is filled with classic character and historic charm. Situated on a desirable corner lot, this property offers excellent visibility and strong rental potential. A great opportunity for investors looking for a well-located property with timeless appeal. This can also be restored to an original single-family historic home.
Key facts
- Natural woodwork
- Historic charm
- Classic character
Tags
Neighborhood map
What this means for you Summary
Snapshot
- This is a 3-bed/4.0-bath multifamily listed at $710k. Condition is rated good.
Deal economics
- At list price, monthly cash flow is $2k ($28k/yr) — positive.
- The deal already cash-flows at list — no discount required.
- Meets the 1% rule at list price ($8k rent vs $710k).
- Recommended offer: $647k (9.0% below list) — sets the bar for market timing.
- Cap rate 10.3% vs local median 4.9% in Newport — top-decile yield for the area; either an underpriced asset or a hidden risk that comps aren't pricing in. Stress-test before assuming the spread holds.
Location & tenants
- Location reads 82/100 on livability (#58 in KY, #1,070 nationally) — a professional / high-income tenant draw. Strengths: amenities A+, commute A+, cost of living A+; Watch: crime F, employment D-.
- Newport Independent (suburban): math 14% / reading 26% proficiency, ranked #160 of 165 in KY (top 97%) — low school quality limits family demand, transient renter base, plan for 1-2y turnover; 79% free/reduced lunch — lower-income household profile, screen leases tightly.
- Zoned schools: Newport Intermediate School (math 12% / reading 22%, grade F, #607 of 676 statewide, top 91%, 387 students, 89% FRL); Newport High School (math 16% / reading 28%, grade F, #202 of 254 statewide, top 82%, 579 students, 84% FRL).
- Market conditions: Rents rising fast (+4.6%/yr); 239 active listings in the ZIP; 8 comparable units currently listed for rent nearby; rentals leasing fast (median 14d on market — plan ~1-2 weeks tenant-placement turnaround); 247 units permitted in Campbell County in 2024 (77 in 5+ unit buildings).
- At $8,261/mo this rent would consume 165% of the median local household income ($60k/yr) (locally 1136% of renters already pay >50% of income on rent) — very limited rent-growth headroom before tenants either downsize or default.
Forward outlook
- Local home prices are declining (-3.0%/yr); year-one equity from $5k of loan paydown is wiped out by about $21k of value loss. Plan a longer hold.
- At projected returns (-3.0% appreciation + 4.6% rent growth), your $199k cash investment doubles in ~8 years — after that, you're playing with house money.
Negotiation context
- It's been on market 101 days — a 9% lower offer ($647k) is reasonable based on typical stale-listing flexibility.
- 6 sale attempts since 28y ago with the ask held roughly flat each time — persistent listings suggest the price (not the market) is what's stuck; bring a comps-based counter.
- Current owner paid $175k; list at $710k implies a 306% gain — meaningful room to come down on a strong offer.
Risks & watch-outs
- Watch-outs: built in 1906 — expect roof / HVAC / electrical / plumbing capex.
Questions for the listing agent
- It's been on market 101 days. Have you received any prior offers? Is the seller open to a 9% concession, seller financing, or rate buy-down credit?
- Built in 1906 — when were the roof, HVAC, electrical panel, plumbing, and water heater last replaced?
- Why hasn't it sold? Are there any deal-killer items the seller is aware of (foundation, flood, title, zoning, code violations)?
- Is there a deadline driving the sale (1031 exchange, divorce, estate, relocation)? That informs how much negotiation room exists.
- Schools are D-rated, which usually means shorter tenancies and higher turnover. Who's the typical renter profile here, and what's been the actual vacancy rate?
- Crime grade is F in this area — have there been break-ins, vandalism, or insurance claims at this property in the last 3 years? What carrier currently insures it and at what premium?
- What's the average days-on-market for RENTAL listings here right now (not sales)? A rising rental-DOM trend means longer vacancies and softer asking-rent achievability than the comps imply.
- What's the recent tenant-quality profile in this submarket — average credit score on applications, eviction rate, late-payment / NSF rate, and stable-employment percentage? A property-management company in the area should have these aggregated.
- How much new apartment / multifamily construction is in the pipeline within 1–3 miles? Heavy new supply (>2% of stock underway) typically softens rents 12–24 months out; light construction supports rent growth.
Investment metrics
- 1% rule
- 1.16% ✓
- Cap rate
- 10.30%
- Cash-on-cash
- 14.31%
- DSCR
- 1.64
- GRM
- 7.2
CMA / ARV
- ARV (median comp)
- $341,409
- List price
- $710,500
- Delta
- 108.11%
- Verdict
- OVERPRICED
- Comps
- 20 within 1.0 mi
Show comp detail 7 sales within ~0.75 mi
| Address | Dist | Beds/Ba | Sqft | Sold | Price | $/sf | Match |
|---|---|---|---|---|---|---|---|
| 224 - 226 E 7th St | 0.23mi | 4/2.0 (+1) | 2,903 (+9%) | 2mo | $218,000 | $75 | 59 |
| 945 Washington Ave | 0.42mi | 4/2.5 (+1) | 2,573 (-4%) | 6mo | $301,000 | $117 | 59 |
| 939 Washington Ave | 0.41mi | 4/4.0 (+1) | 2,451 (-8%) | 6mo | $302,000 | $123 | 57 |
| 531 Lexington Ave | 0.20mi | 4/2.5 (+1) | 2,298 (-14%) | 9mo | $450,000 | $196 | 49 |
| 807 Central Ave | 0.62mi | 4/3.0 (+1) | 2,554 (-4%) | 16mo | $255,000 | $100 | 42 |
| 719 Saratoga St | 0.29mi | 3/2.0 | 2,284 (-14%) | 20mo | $340,000 | $149 | 38 |
| 932 Columbia St | 0.64mi | 4/2.0 (+1) | 2,420 (-9%) | 13mo | $258,000 | $107 | 30 |
Match score weights: distance 35% · size 25% · config 20% · recency 20%. Top-matched comps best support the ARV.
Projected returns pro-forma
-3.0% appreciation · 4.64% rent growth · sell at horizon
- IRR
- 6.3%
- Equity multiple
- 1.25×
- Total profit
- $49,475
- Equity at exit
- $105,938
- IRR
- 16.9%
- Equity multiple
- 2.48×
- Total profit
- $295,041
- Equity at exit
- $61,431
Cash invested: $198,940 (down + closing). Projections, not guarantees.
Landlord ↔ Tenant lean methodology
- Overall (STATE)
- 83 Strongly Landlord-Friendly
- State Kentucky
- 83 Strongly Landlord-Friendly · R+16
- County
- — inherits STATE
- City
- — inherits STATE
ZIP-level market 41071
- Rents YoY
- 4.6%
- Active inventory
- 239
- Price-to-rent
- 37.2×
Monthly cashflow live
- Estimated rent
- $8,261 medium interval (Pro) →
- Mortgage (P&I)
- −$3,726
- Tax from tax record
- −$132 /mo · $1,583/yr
- Insurance
- −$296
- HOA
- −$0
- Vacancy / Maint / Mgmt
- −$1,735
- Net cashflow
- $2,372
Break-even live
Sensitivity live
| Price | -10% $2,774 | -5% $2,573 | +0% $2,372 | +5% $2,171 | +10% $1,970 |
|---|---|---|---|---|---|
| Rent | -10% $1,720 | -5% $2,046 | +0% $2,372 | +5% $2,699 | +10% $3,025 |
| Rate | -1.0pp $2,730 | -0.5pp $2,553 | base $2,372 | +0.5pp $2,188 | +1.0pp $2,001 |
6-unit breakdown (identical units grouped — click to expand)
| Units | Beds | Baths | Est. rent |
|---|---|---|---|
| 3× units | 1 | 1 | $4,770 |
| #1 | 1 | 1 | $1,590 |
| #2 | 1 | 1 | $1,590 |
| #3 | 1 | 1 | $1,590 |
| 3× units | 0 | 1 | $3,492 |
| #4 | 0 | 1 | $1,164 |
| #5 | 0 | 1 | $1,164 |
| #6 | 0 | 1 | $1,164 |
| Total (6 units) | $8,261 | ||
UW: 25.0% down · 7.5% · 30yr · 1.5% tax · 5.0% vac · 8.0% maint · 8.0% mgmt
Financing live
Cash to close
- Down payment
- $177,625
- Closing costs
- $21,315
- Reserves months
- —
- Total cash needed
- —
Loan-product check · same deal, 3 products live
Conventional
25% down · 7.5% · 30yr
- Down + closing
- —
- Monthly P&I
- —
- Monthly cashflow
- —
- DSCR
- —
- Eligible?
- —
Personal DTI + credit; lowest rate.
DSCR
20% down · 8.5% · 30yr
- Down + closing
- —
- Monthly P&I
- —
- Monthly cashflow
- —
- DSCR
- —
- Eligible?
- —
No personal income docs; deal must DSCR.
Hard money
10% down · 12.0% · 12mo
- Down + closing
- —
- Monthly P&I
- —
- Monthly cashflow
- —
- DSCR
- —
- Eligible?
- —
Short-term bridge; refi at stabilization.
Rent comps 8 comps
| Address | Beds | Baths | Sqft | Rent | $/sqft | DOM | Units | Dist |
|---|---|---|---|---|---|---|---|---|
| 987 Hill St Cincinnati, OH | 3.0 | 3.0 | 2878 | $7,000 | $2.43 | 3d | 1 | 0.89mi |
| 140 W 13th St Newport, KY | 3.0 | 3.5 | 2505 | $4,200 | $1.68 | 13d | 1 | 0.95mi |
| 923 Paradrome St Cincinnati, OH | 3.0 | 2.5 | 2098 | $3,000 | $1.43 | 25d | 1 | 1.15mi |
| 634 Sycamore St Cincinnati, OH | 2.0 | 1.0–1.5 | 1261 | $2,615 | $2.07 | 6d | 9 | 1.22mi |
| 1287 Ida St Cincinnati, OH | 3.0 | 2.5 | 2494 | $4,700 | $1.88 | 18d | 1 | 1.27mi |
| 1 W 4th St Cincinnati, OH | 3.0 | 1.0–3.5 | 1675 | $9,200 | $5.49 | 4d | 96 | 1.33mi |
| 516 E 12th St Unit 1314562P Cincinnati, OH | 4.0 | 2.0 | 2023 | $10,170 | $5.03 | 25d | 1 | 1.39mi |
| 1304 Broadway Unit 1056130P Cincinnati, OH | 1.0–5.0 | 1.0–4.0 | 2072 | $5,808 | $2.80 | 12d | 2 | 1.50mi |
Listing history 30 events
-
2026-06-21days on market $710,500 Active 101 DOM
-
2026-06-18days on market $710,500 Active 98 DOM
-
2026-06-17days on market $710,500 Active 97 DOM
-
2026-06-16days on market $710,500 Active 96 DOM
-
2026-06-15days on market $710,500 Active 95 DOM
-
2026-06-13days on market $710,500 Active 93 DOM
-
2026-06-09days on market $710,500 Active 89 DOM
-
2026-06-08days on market $710,500 Active 88 DOM
-
2026-06-07days on market $710,500 Active 87 DOM
-
2026-06-05days on market $710,500 Active 84 DOM
-
2026-06-03days on market $710,500 Active 83 DOM
-
2026-06-02days on market $710,500 Active 82 DOM
-
2026-06-01days on market $710,500 Active 81 DOM
-
2026-05-31days on market $710,500 Active 80 DOM
-
2026-03-31price $710,500 573-char remark
Show marketing remark (573 chars)
Situated on a desirable corner lot at 6th and Park Avenue. This charming 6-unit multi-family property features three 1-bedroom units and three studio units, each with one full bathroom. The building showcases beautiful natural woodwork throughout and is filled with classic character and historic charm. Situated on a desirable corner lot, this property offers excellent visibility and strong rental potential. A great opportunity for investors looking for a well-located property with timeless appeal. This can also be restored to an original single-family historic home.
-
2026-03-12$725,000 Active 573-char remark
Show marketing remark (573 chars)
Situated on a desirable corner lot at 6th and Park Avenue. This charming 6-unit multi-family property features three 1-bedroom units and three studio units, each with one full bathroom. The building showcases beautiful natural woodwork throughout and is filled with classic character and historic charm. Situated on a desirable corner lot, this property offers excellent visibility and strong rental potential. A great opportunity for investors looking for a well-located property with timeless appeal. This can also be restored to an original single-family historic home.
-
2021-12-31historical
-
2021-12-31historical
-
2021-06-03price $499,000
-
2021-06-03price $499,000
-
2020-08-03price $529,000
-
2020-08-03price $529,000
-
2020-06-16status Active
-
2020-06-16historical
-
2020-06-11$549,900 Active
-
2020-06-08$549,900 Active
-
2001-11-20soldstatus $174,900
-
2001-11-20soldstatus $174,900
-
1998-03-25$189,900
-
1998-03-25$189,900
ⓘ Source: listings_history table (triggers on properties + properties_extension) + one-shot
backfill from property_details.listing_events for pre-trigger history.
Tax reassessment forecast KY · Resets to sale price
- Current annual tax
- $1,583 · $132/mo
- Projected year-2 tax
- $6,110 · $509/mo
- Expected delta
- +$4,527/yr (+$377/mo · 286.0%)
ⓘ Screening estimate from a state-policy table — verify with the county assessor before closing.
Nearby sold comps map
Loading sold comps map…
Walkable amenities ~0.75 mi
Loading nearby amenities…
Taxation est. · year 1
- Rental income
- $99,132
- − Mortgage interest
- −$39,799
- − Property taxes
- −$1,583
- − Insurance
- −$3,552
- − Repairs & maintenance
- −$7,931
- − Management
- −$7,931
- − Depreciation
- −$20,669
- Taxable income
- $17,667
- Est. tax owed @ 24.0%
- −$4,240
- After-tax cash flow
- $24,227/yr
For passive investors: Depreciation is non-cash, so a rental often shows a tax loss while cash-flowing — sheltering income. Rental losses are passive: they offset passive income freely, and up to $25,000/yr can offset ordinary (W-2) income if you actively participate and your MAGI is under $100k (phasing out to $0 by $150k); unused losses carry forward. On sale, claimed depreciation is recaptured at up to 25%, and gains may owe capital-gains tax (a 1031 exchange can defer both). Figures are a year-1 estimate at your 24.0% rate — not tax advice; consult a CPA.
Condition & rehab AI · 13 photos
This charming multi-family property is in good condition with cosmetic updates, offering strong rental potential and a great investment opportunity.
Value-add opportunities
- Resale Paint exterior — Enhances curb appeal
- Both Landscaping — Improves curb appeal and rental potential
Renovation cost estimate screening
Value-add ROI direction
- Resale Paint exterior — Enhances curb appeal ↑
- Both Landscaping — Improves curb appeal and rental potential ↑
ⓘ Cost ranges are severity-bucket heuristics (US national rule-of-thumb). Get contractor quotes + a written scope before underwriting a rehab budget.
Schools (NCES district)
- District
- Newport Independent
- NCES district ID
- 2104440
- Math proficiency
- 14% ▼ -11.00%
- Reading proficiency
- 26% ▼ -6.00%
- Median HH income
- $35,783
- Composite
- 16.51/100
- National rank
- #9182
- State rank
- #160 of 165 in KY
Livability — Newport
- Score
- 82/100
- State rank
- #58
- US rank
- #1070
Category grades
Schools grade is shown separately in the Schools card above.
Census & demographics
- Census place
- Newport, KY
- County
- Campbell County · 84,793 people
- City population
- 19,680
- Metro
- Cincinnati, OH-KY-IN
- Population (ZIP)
- 19,680
- Household income
- $59,976
- Rent vs Own
- Severe rent burden
- 1136.0
Population outlook (Campbell County) Hauer SSP2
- Today (2025)
- 95,668 people
- By 2030
- 96,886 · +1.3%
- By 2040
- 97,734 · +2.2%
- By 2050
- 96,413 · +0.8%
- By 2075
- 90,211 · -5.7%
- By 2100
- 79,434 · -17.0%
Race, ethnicity, and origin ACS 2023
- Neighborhood character
- Predominantly White (84%)
- Race & ethnicity
- White 84% Black 7% Two or more races 6% Hispanic / Latino 5%
- Common ancestry
- Slovak 3% Lithuanian 2% Italian 2%
- Foreign-born
- 4% · Canada
- Languages at home
- 95% English-only · Spanish 3% Other Indo-European 1%
Political lean MEDSL · Campbell
- 2024 margin
- R (+19.7) · D 39.2% · R 58.9% · Other 1.9%
- 2008→2024 swing
- +1.2pp toward D · 2008: -20.9pp · 2024: -19.7pp
- All cycles
- 2024: R+19.7 2020: R+18.6 2016: R+24.5 2012: R+22.8 2008: R+20.9
Not yet ingested
- Civics
- —
Market trends
- HPI YoY
- ▼ -193.38%
- Current HPI
- 244.9069
- Rent YoY
- ▲ 4.64%
- Metro
- Cincinnati, OH-KY-IN
- State GDP YoY
- ▲ 1.81%
- F500 in state
- 4
Industry mix (Fortune 500 HQ in KY)
| Industry | F500 HQs | Revenue |
|---|---|---|
| Healthcare | 1 | $118B |
|
||
| Food / Beverage | 1 | $7B |
|
||
Price history
+274.1% since first listed16 events — show timeline
- 2026-03-31 Price Changed $710,500 NKMLS
- 2026-03-12 Listed $725,000 NKMLS
- 2021-12-31 Listing Removed — NKMLS
- 2021-12-31 Listing Removed — NKMLS
- 2021-06-03 Price Changed $499,000 NKMLS
- 2021-06-03 Price Changed $499,000 NKMLS
- 2020-08-03 Price Changed $529,000 NKMLS
- 2020-08-03 Price Changed $529,000 NKMLS
- 2020-06-16 Relisted — NKMLS
- 2020-06-16 Listing Removed — NKMLS
- 2020-06-11 Listed $549,900 NKMLS
- 2020-06-08 Listed $549,900 NKMLS
- 2001-11-20 Sold (MLS) $174,900 NKMLS
- 2001-11-20 Sold (MLS) $174,900 NKMLS
- 1998-03-25 Listed $189,900 NKMLS
- 1998-03-25 Listed $189,900 NKMLS
Property tax history
-2.1%/yrLatest (2025): $1,583 · -3.1% YoY. Source: county tax records.
Cash-flow waterfall
monthlySold comps — $/sqft
last 12 mo · ≤1 miLoading sold comps…