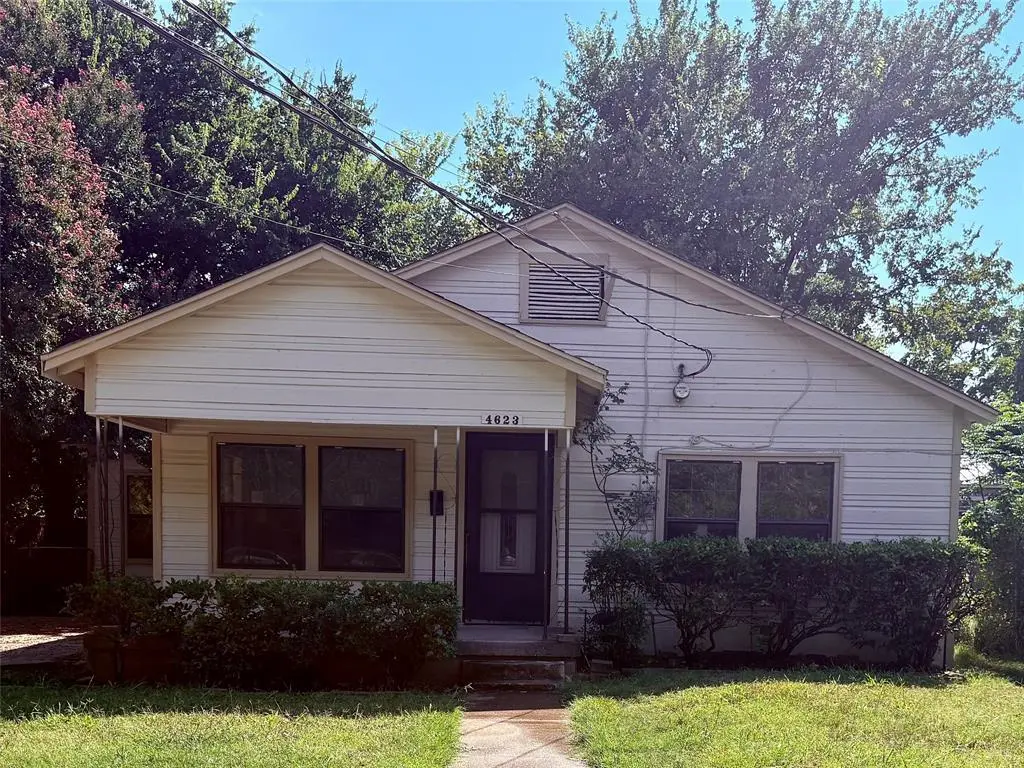
4623 Spring Garden Rd · Dallas, TX
Flood risk 1/10 · Minimal
- FEMA flood zone
- X (unshaded)
- Chance of flooding over 30 yrs
- 0.0%
- Est. flood insurance / yr
- $507 – $1,088
Fire risk 3/10 · Minor
- Est. fire insurance / yr
- $1,222 – $2,270
Heat risk 7/10 · Major
- Hot days now (above 110°F)
- 7 days/yr
- Hot days in 30 yrs
- 24 days/yr
Wind risk 6/10 · Moderate
- Chance of severe wind over 30 yrs
- 27.0%
Air-quality risk 2/10 · Minimal
- Unhealthy air days now
- 2 days/yr
- Unhealthy air days in 30 yrs
- 2 days/yr
Risk factors via First Street. Map © Google.
Why this score? — see what drove the C+ grade
The composite is a weighted blend of 9 inputs, each scored 0–100. Each bar is that input's sub-score; the figure is the points it added to the 100-point composite (weight × sub-score).
- Cash flow +19.1/30.0
- ARV discount +13.3/15.0
- DSCR +6.0/10.0
- 1% rule +5.7/10.0
- Appreciation +5.4/10.0
- Rent growth +4.3/5.0
- Livability +4.0/5.0
- Schools +2.8/10.0
- Condition / age +2.5/5.0
$150,000
🖨 Deal sheet (PDF) 📄 Offer letter ✓ Due diligence
Listing remarks MLS
Welcome to 4623 Spring Garden Road — a hidden gem with massive potential in the heart of Dallas, TX. This 3-bedroom, 1-bathroom single-family home offers a great canvas for savvy investors, renovators, or anyone looking to customize their dream home. Sitting on a spacious lot, this property features solid bones, a functional layout, and a large backyard with room for expansion or outdoor living upgrades. With some TLC and vision, this house could be transformed into a stunning residence or an income-generating rental in a neighborhood seeing steady revitalization. Located just minutes from downtown Dallas, major highways, and local schools, the property offers both convenience and long-term value. Whether you’re a flipper, landlord, or DIY enthusiast, this is your perfect chance to own in Dallas. Great bones with plenty of opportunity to renovate or rent!
Key facts
- Large backyard
- Spacious lot
- Functional layout
Tags
Neighborhood map
What this means for you Summary
Snapshot
- This is a 2-bed/1.0-bath single-family listed at $150k.
Deal economics
- At list price, monthly cash flow is $159 ($2k/yr) — positive.
- The deal already cash-flows at list — no discount required.
- Meets the 1% rule at list price ($2k rent vs $150k).
- Recommended offer: $132k (12.0% below list) — sets the bar for market timing.
- Cap rate 7.6% vs local median 2.3% in Dallas — top-decile yield for the area; either an underpriced asset or a hidden risk that comps aren't pricing in. Stress-test before assuming the spread holds.
Location & tenants
- Location reads 81/100 on livability (#24 in TX, #1,380 nationally) — a professional / high-income tenant draw. Strengths: amenities A+, commute A+, housing A+; Watch: schools C-, crime F.
- Dallas ISD (urban): math 31% / reading 36% proficiency, ranked #559 of 826 in TX (top 68%) — families likely to look elsewhere, expect single-tenant / working-renter base with shorter leases; 83% free/reduced lunch — lower-income household profile, screen leases tightly.
- Market conditions: Rents rising fast (+7.2%/yr); 248 active listings in the ZIP; 40 comparable units currently listed for rent nearby; rentals at typical pace (median 16d on market — plan ~3-4 weeks tenant-placement turnaround); 12,577 units permitted in Dallas County in 2024 (6,829 in 5+ unit buildings).
- This rent runs 42% of the median local income ($46k/yr) — at the standard rent-burdened threshold; future hikes will face affordability resistance.
Forward outlook
- In year one you build about $2k of equity ($1k loan paydown + $1k appreciation (0.8% local appreciation)).
- Dallas County population projected at +35% by 2050 — long-run rental-demand tailwind backs the buy-and-hold thesis.
- At projected returns (0.8% appreciation + 7.2% rent growth), your $42k cash investment doubles in ~6 years — after that, you're playing with house money.
Negotiation context
- It's been on market 302 days — a 12% lower offer ($132k) is reasonable based on typical stale-listing flexibility.
- Current owner paid $36k; list at $150k implies a 318% gain — meaningful room to come down on a strong offer.
Risks & watch-outs
- Watch-outs: built in 1928 — expect roof / HVAC / electrical / plumbing capex.
- Climate carrying-cost: major wind risk, 27% chance of damaging wind over 30y; extreme-heat days projected 7→24/yr by 2055 (HVAC capex compounding) — expect insurance premiums to compound above CPI over the hold.
Questions for the listing agent
- It's been on market 302 days. Have you received any prior offers? Is the seller open to a 12% concession, seller financing, or rate buy-down credit?
- Built in 1928 — when were the roof, HVAC, electrical panel, plumbing, and water heater last replaced?
- Why hasn't it sold? Are there any deal-killer items the seller is aware of (foundation, flood, title, zoning, code violations)?
- Is there a deadline driving the sale (1031 exchange, divorce, estate, relocation)? That informs how much negotiation room exists.
- Crime grade is F in this area — have there been break-ins, vandalism, or insurance claims at this property in the last 3 years? What carrier currently insures it and at what premium?
- What's the average days-on-market for RENTAL listings here right now (not sales)? A rising rental-DOM trend means longer vacancies and softer asking-rent achievability than the comps imply.
- What's the recent tenant-quality profile in this submarket — average credit score on applications, eviction rate, late-payment / NSF rate, and stable-employment percentage? A property-management company in the area should have these aggregated.
- How much new for-sale + rental construction is in the pipeline within 1–3 miles? Heavy new supply typically softens prices + rents 12–24 months out; constrained supply supports both.
Investment metrics
- 1% rule
- 1.07% ✓
- Cap rate
- 7.56%
- Cash-on-cash
- 4.53%
- DSCR
- 1.20
- GRM
- 7.8
CMA / ARV
- ARV (median comp)
- $172,314
- List price
- $150,000
- Delta
- -12.95%
- Verdict
- UNDERPRICED
- Comps
- 20 within 1.0 mi
Show comp detail 12 sales within ~0.75 mi
| Address | Dist | Beds/Ba | Sqft | Sold | Price | $/sf | Match |
|---|---|---|---|---|---|---|---|
| 4502 Bradshaw St | 0.10mi | 2/1.5 | 1,112 (+4%) | 12mo | $144,000 | $129 | 77 |
| 3603 York St | 0.23mi | 2/1.0 | 986 (-8%) | 4mo | $160,000 | $162 | 73 |
| 3516 York St | 0.18mi | 2/1.0 | 990 (-8%) | 8mo | $114,900 | $116 | 72 |
| 3814 Pine St | 0.55mi | 3/1.0 (+1) | 1,120 (+4%) | 0mo | $210,000 | $188 | 62 |
| 2726 Carpenter Ave | 0.54mi | 3/1.0 (+1) | 1,008 (-6%) | 6mo | $119,000 | $118 | 55 |
| 3622 Cauthorn Dr | 0.36mi | 3/2.0 (+1) | 1,200 (+12%) | 1mo | $210,000 | $175 | 53 |
| 3111 Mcdermott Ave | 0.67mi | 3/2.0 (+1) | 1,043 (-3%) | 4mo | $226,000 | $217 | 52 |
| 3519 Frank St | 0.62mi | 2/1.0 | 924 (-14%) | 4mo | $90,000 | $97 | 44 |
| 4103 Copeland St | 0.62mi | 3/1.0 (+1) | 948 (-12%) | 8mo | $90,000 | $95 | 40 |
| 5128 Dimple Jackson St | 0.69mi | 3/2.0 (+1) | 992 (-8%) | 8mo | $199,999 | $202 | 40 |
| 2714 Stephenson Dr | 0.68mi | 3/2.5 (+1) | 1,225 (+14%) | 1mo | $210,000 | $171 | 33 |
| 3719 Meadow St | 0.72mi | 3/2.0 (+1) | 1,222 (+14%) | 2mo | $225,000 | $184 | 32 |
Match score weights: distance 35% · size 25% · config 20% · recency 20%. Top-matched comps best support the ARV.
Projected returns pro-forma
0.79% appreciation · 7.19% rent growth · sell at horizon
- IRR
- 8.5%
- Equity multiple
- 1.44×
- Total profit
- $18,502
- Equity at exit
- $49,569
- IRR
- 15.5%
- Equity multiple
- 3.08×
- Total profit
- $87,317
- Equity at exit
- $64,623
Cash invested: $42,000 (down + closing). Projections, not guarantees.
Landlord ↔ Tenant lean methodology
- Overall (STATE)
- 87 Strongly Landlord-Friendly
- State Texas
- 87 Strongly Landlord-Friendly · R+5
- County
- — inherits STATE
- City
- — inherits STATE
ZIP-level market 75215
- Home prices YoY
- 0.3%
- Rents YoY
- 7.2%
- Active inventory
- 248
- Price-to-rent
- 7.8×
Monthly cashflow live
- Estimated rent
- $1,609 high interval (Pro) →
- Mortgage (P&I)
- −$787
- Tax from tax record
- −$263 /mo · $3,160/yr
- Insurance
- −$62
- HOA
- −$0
- Vacancy / Maint / Mgmt
- −$338
- Net cashflow
- $159
Break-even live
Sensitivity live
| Price | -10% $243 | -5% $201 | +0% $159 | +5% $116 | +10% $74 |
|---|---|---|---|---|---|
| Rent | -10% $31 | -5% $95 | +0% $159 | +5% $222 | +10% $286 |
| Rate | -1.0pp $234 | -0.5pp $197 | base $159 | +0.5pp $120 | +1.0pp $80 |
UW: 25.0% down · 7.5% · 30yr · 1.5% tax · 5.0% vac · 8.0% maint · 8.0% mgmt
Financing live
Cash to close
- Down payment
- $37,500
- Closing costs
- $4,500
- Reserves months
- —
- Total cash needed
- —
Loan-product check · same deal, 3 products live
Conventional
25% down · 7.5% · 30yr
- Down + closing
- —
- Monthly P&I
- —
- Monthly cashflow
- —
- DSCR
- —
- Eligible?
- —
Personal DTI + credit; lowest rate.
DSCR
20% down · 8.5% · 30yr
- Down + closing
- —
- Monthly P&I
- —
- Monthly cashflow
- —
- DSCR
- —
- Eligible?
- —
No personal income docs; deal must DSCR.
Hard money
10% down · 12.0% · 12mo
- Down + closing
- —
- Monthly P&I
- —
- Monthly cashflow
- —
- DSCR
- —
- Eligible?
- —
Short-term bridge; refi at stabilization.
Rent comps 40 comps
| Address | Beds | Baths | Sqft | Rent | $/sqft | DOM | Units | Dist |
|---|---|---|---|---|---|---|---|---|
| 4611 Bradshaw St Dallas, TX | 3.0 | 2.0 | 1145 | $1,550 | $1.35 | 25d | 1 | 0.03mi |
| 4722 Meadow St Dallas, TX | 2.0–3.0 | 2.0 | 1107 | $1,275 | $1.15 | 12d | 4 | 0.19mi |
| 3526 Elsie Faye Heggins St Dallas, TX | 3.0 | 2.0 | 1113 | $1,795 | $1.61 | 25d | 1 | 0.22mi |
| 3526 Elsie Faye Heggins St Dallas, TX | 3.0 | 2.0 | 1113 | $1,795 | $1.61 | 8d | 1 | 0.22mi |
| 3619 York St Dallas, TX | 3.0 | 2.0 | 1298 | $1,714 | $1.32 | 0d | 1 | 0.28mi |
| 3627 Sidney St Dallas, TX | 3.0 | 2.0 | 1090 | $1,600 | $1.47 | 0d | 1 | 0.30mi |
| 3408 Spring Ave Dallas, TX | 3.0 | 2.0 | 780 | $1,314 | $1.68 | 0d | 1 | 0.40mi |
| 3639 Pine St Dallas, TX | 3.0 | 2.0 | 1090 | $1,490 | $1.37 | 14d | 1 | 0.48mi |
| 3726 Copeland St Dallas, TX | 3.0 | 2.0 | 1298 | $1,680 | $1.29 | 0d | 1 | 0.48mi |
| 2840 Oakdale St Dallas, TX | 3.0 | 2.0 | 1379 | $1,900 | $1.38 | 44d | 1 | 0.49mi |
| 2829 Oakdale St Dallas, TX | 3.0 | 2.0 | 1028 | $1,814 | $1.76 | 0d | 1 | 0.49mi |
| 2714 Hector St Dallas, TX | 3.0 | 2.0 | 1233 | $2,100 | $1.70 | 25d | 1 | 0.55mi |
| 2838 Frost Ave Dallas, TX | 2.0 | 1.0 | 1200 | $1,400 | $1.17 | 25d | 1 | 0.56mi |
| 3907 Roberts Ave Dallas, TX | 3.0 | 1.0 | 908 | $1,395 | $1.54 | 15d | 1 | 0.56mi |
| 2711 Cross St Dallas, TX | 2.0 | 1.0 | 700 | $1,249 | $1.78 | 0d | 1 | 0.56mi |
| 4024 Myrtle St Dallas, TX | 3.0 | 2.0 | 1106 | $1,595 | $1.44 | 5d | 1 | 0.62mi |
| 5000 Linder Ave Dallas, TX | 3.0 | 2.0 | 1327 | $1,950 | $1.47 | 44d | 1 | 0.63mi |
| 3927 S Malcolm X Blvd Dallas, TX | 1.0 | 1.0 | 1248 | $1,200 | $0.96 | 2d | 1 | 0.64mi |
| 2627 Elsie Faye Heggins St Dallas, TX | 3.0 | 2.0 | 876 | $1,280 | $1.46 | 44d | 1 | 0.66mi |
| 2615 Elsie Faye Heggins St Dallas, TX | 3.0 | 2.0 | 876 | $1,280 | $1.46 | 16d | 1 | 0.68mi |
| 5221 Grovewood St Dallas, TX | 3.0 | 1.5 | 840 | $1,400 | $1.67 | 44d | 1 | 0.69mi |
| 2603 Elsie Faye Heggins St Dallas, TX | 3.0 | 2.0 | 876 | $1,385 | $1.58 | 44d | 1 | 0.69mi |
| 2563 Elsie Faye Heggins St Dallas, TX | 3.0 | 2.0 | 876 | $1,240 | $1.42 | 16d | 1 | 0.70mi |
| 2561 Elsie Faye Heggins St Dallas, TX | 3.0 | 2.0 | 876 | $1,390 | $1.59 | 7d | 1 | 0.71mi |
| 2822 McDermott Ave Dallas, TX | 3.0 | 2.0 | 1200 | $1,795 | $1.50 | 25d | 1 | 0.73mi |
| 2513 Southland St Dallas, TX | 2.0 | 1.0 | 1010 | $1,399 | $1.39 | 21d | 1 | 0.76mi |
| 2513 Southland St Dallas, TX | 2.0 | 1.0 | 1010 | $1,299 | $1.29 | 3d | 1 | 0.76mi |
| 2847 Metropolitan Ave Dallas, TX | 3.0 | 1.0 | 1344 | $2,050 | $1.53 | 22d | 1 | 0.82mi |
| 5340 Dimple Jackson St Dallas, TX | 3.0 | 2.0 | 1298 | $1,814 | $1.40 | 0d | 1 | 0.83mi |
| 2720 Morning Ave Dallas, TX | 3.0 | 2.0 | 1332 | $2,350 | $1.76 | 44d | 1 | 0.85mi |
| 3711 Guaranty St Dallas, TX | 3.0 | 1.0 | 984 | $1,800 | $1.83 | 15d | 1 | 0.89mi |
| 2642 Anderson St Dallas, TX | 2.0 | 1.0 | 820 | $1,150 | $1.40 | 25d | 1 | 0.93mi |
| 2545 Metropolitan Ave Dallas, TX | 3.0 | 1.0 | 936 | $1,750 | $1.87 | 0d | 1 | 0.95mi |
| 4303 Jamaica St Dallas, TX | 3.0 | 2.0 | 1027 | $1,299 | $1.26 | 0d | 1 | 0.96mi |
| 3308 Birmingham Ave Unit 1 Dallas, TX | 2.0 | 2.5 | 1451 | $2,275 | $1.57 | 25d | 1 | 0.99mi |
| 3308 Birmingham Ave Unit 7 Dallas, TX | 2.0 | 2.5 | 1287 | $2,125 | $1.65 | 15d | 1 | 0.99mi |
| 3308 Birmingham Ave Unit 03 Dallas, TX | 2.0 | 2.5 | 1451 | $2,275 | $1.57 | 44d | 1 | 0.99mi |
| 3308 Birmingham Ave Unit 6 Dallas, TX | 2.0 | 2.5 | 1341 | $2,175 | $1.62 | 17d | 1 | 0.99mi |
| 4706 Spring Ave Dallas, TX | 3.0 | 2.0 | 1287 | $3,900 | $3.03 | 44d | 1 | 1.07mi |
| 3501 Latimer St Dallas, TX | 2.0 | 1.0 | 1008 | $1,095 | $1.09 | 3d | 1 | 1.16mi |
Listing history 17 events
-
2026-06-18days on market $150,000 Active 302 DOM
-
2026-06-17days on market $150,000 Active 301 DOM
-
2026-06-16days on market $150,000 Active 300 DOM
-
2026-06-15days on market $150,000 Active 299 DOM
-
2026-06-13days on market $150,000 Active 297 DOM
-
2026-06-09days on market $150,000 Active 293 DOM
-
2026-06-08days on market $150,000 Active 292 DOM
-
2026-06-07days on market $150,000 Active 291 DOM
-
2026-06-04days on market $150,000 Active 288 DOM
-
2026-06-03days on market $150,000 Active 287 DOM
-
2026-06-02days on market $150,000 Active 286 DOM
-
2026-06-02days on market $150,000 Active 285 DOM
-
2026-05-31days on market $150,000 Active 284 DOM
-
2026-05-20historical Active Option Contract 886-char remark
Show marketing remark (886 chars)
Welcome to 4623 Spring Garden Road — a hidden gem with massive potential in the heart of Dallas, TX. This 3-bedroom, 1-bathroom single-family home offers a great canvas for savvy investors, renovators, or anyone looking to customize their dream home. Sitting on a spacious lot, this property features solid bones, a functional layout, and a large backyard with room for expansion or outdoor living upgrades. With some TLC and vision, this house could be transformed into a stunning residence or an income-generating rental in a neighborhood seeing steady revitalization. Located just minutes from downtown Dallas, major highways, and local schools, the property offers both convenience and long-term value. Whether you’re a flipper, landlord, or DIY enthusiast, this is your perfect chance to own in Dallas. Great bones with plenty of opportunity to renovate or rent!
-
2025-09-25price $160,000 886-char remark
Show marketing remark (886 chars)
Welcome to 4623 Spring Garden Road — a hidden gem with massive potential in the heart of Dallas, TX. This 3-bedroom, 1-bathroom single-family home offers a great canvas for savvy investors, renovators, or anyone looking to customize their dream home. Sitting on a spacious lot, this property features solid bones, a functional layout, and a large backyard with room for expansion or outdoor living upgrades. With some TLC and vision, this house could be transformed into a stunning residence or an income-generating rental in a neighborhood seeing steady revitalization. Located just minutes from downtown Dallas, major highways, and local schools, the property offers both convenience and long-term value. Whether you’re a flipper, landlord, or DIY enthusiast, this is your perfect chance to own in Dallas. Great bones with plenty of opportunity to renovate or rent!
-
2025-08-20$175,000 Active 886-char remark
Show marketing remark (886 chars)
Welcome to 4623 Spring Garden Road — a hidden gem with massive potential in the heart of Dallas, TX. This 3-bedroom, 1-bathroom single-family home offers a great canvas for savvy investors, renovators, or anyone looking to customize their dream home. Sitting on a spacious lot, this property features solid bones, a functional layout, and a large backyard with room for expansion or outdoor living upgrades. With some TLC and vision, this house could be transformed into a stunning residence or an income-generating rental in a neighborhood seeing steady revitalization. Located just minutes from downtown Dallas, major highways, and local schools, the property offers both convenience and long-term value. Whether you’re a flipper, landlord, or DIY enthusiast, this is your perfect chance to own in Dallas. Great bones with plenty of opportunity to renovate or rent!
-
1994-04-20soldstatus $35,910
ⓘ Source: listings_history table (triggers on properties + properties_extension) + one-shot
backfill from property_details.listing_events for pre-trigger history.
Tax reassessment forecast TX · Resets to sale price
- Current annual tax
- $3,160 · $263/mo
- Projected year-2 tax
- $3,160 · $263/mo
- Expected delta
- $0/yr ($0/mo · 0.0%)
ⓘ Screening estimate from a state-policy table — verify with the county assessor before closing.
Climate risk First Street
- Flood 1/10 Low FEMA zone X (unshaded) · 0% chance over 30 yrs
- Wildfire 3/10 Moderate
- Heat 7/10 Severe 7 d/yr ≥110°F today · 24 d/yr by 30 yrs out
- Wind 6/10 Major 27% chance of damaging wind over 30 yrs
- Air quality 2/10 Low 2 unhealthy d/yr today · 2 by 30 yrs out
Nearby sold comps map
Loading sold comps map…
Walkable amenities ~0.75 mi
Loading nearby amenities…
Taxation est. · year 1
- Rental income
- $19,307
- − Mortgage interest
- −$8,402
- − Property taxes
- −$3,160
- − Insurance
- −$750
- − Repairs & maintenance
- −$1,545
- − Management
- −$1,545
- − Depreciation
- −$4,364
- Taxable loss
- −$459
- Est. tax savings @ 24.0%
- +$110
- After-tax cash flow
- $2,013/yr
For passive investors: Depreciation is non-cash, so a rental often shows a tax loss while cash-flowing — sheltering income. Rental losses are passive: they offset passive income freely, and up to $25,000/yr can offset ordinary (W-2) income if you actively participate and your MAGI is under $100k (phasing out to $0 by $150k); unused losses carry forward. On sale, claimed depreciation is recaptured at up to 25%, and gains may owe capital-gains tax (a 1031 exchange can defer both). Figures are a year-1 estimate at your 24.0% rate — not tax advice; consult a CPA.
Schools (NCES district)
- District
- Dallas ISD
- NCES district ID
- 4816230
- Math proficiency
- 31% ▼ -16.00%
- Reading proficiency
- 36% ▼ -4.00%
- Median HH income
- $42,881
- Composite
- 28.41/100
- National rank
- #6763
- State rank
- #559 of 826 in TX
Livability — Dallas
- Score
- 81/100
- State rank
- #24
- US rank
- #1380
Category grades
Schools grade is shown separately in the Schools card above.
Census & demographics
- Census place
- Dallas, TX
- County
- Dallas County · 2,612,404 people
- City population
- 1,168,437
- Metro
- Dallas-Fort Worth-Arlington, TX
- Population (ZIP)
- 18,895
- Household income
- $45,557
- Rent vs Own
- Severe rent burden
- 1464.0
Population outlook (Dallas County) Hauer SSP2
- Today (2025)
- 2,979,839 people
- By 2030
- 3,191,823 · +7.1%
- By 2040
- 3,619,611 · +21.5%
- By 2050
- 4,026,915 · +35.1%
- By 2075
- 4,957,073 · +66.4%
- By 2100
- 5,508,725 · +84.9%
Race, ethnicity, and origin ACS 2023
- Neighborhood character
- Diverse neighborhood (Simpson 0.58)
- Race & ethnicity
- Black 59% Hispanic / Latino 25% White 11% Two or more races 10%
- Hispanic origin (detail)
- Mexican 21%
- Common ancestry
- Italian 1% Hispanic 1%
- Foreign-born
- 16% · Canada
- Languages at home
- 74% English-only · Spanish 26%
Political lean MEDSL · Dallas
- 2024 margin
- Strong D (+22.2) · D 60.2% · R 38.0% · Other 1.8%
- 2008→2024 swing
- +6.9pp toward D · 2008: 15.3pp · 2024: 22.2pp
- All cycles
- 2024: D+22.2 2020: D+31.6 2016: D+26.2 2012: D+15.4 2008: D+15.3
Not yet ingested
- Civics
- —
Market trends
- HPI YoY
- ▲ 0.79%
- Current HPI
- 224.2955
- Rent YoY
- ▲ 7.19%
- Metro
- Dallas-Fort Worth-Arlington, TX
- State GDP YoY
- ▲ 3.95%
- F500 in state
- 110
Industry mix (Fortune 500 HQ in TX)
| Industry | F500 HQs | Revenue |
|---|---|---|
| Energy | 16 | $1,198B |
|
||
| Technology | 5 | $198B |
|
||
| Engineering / Construction | 4 | $72B |
|
||
| Energy Services | 3 | $60B |
|
||
| Utilities | 3 | $41B |
|
||
| Healthcare | 2 | $330B |
|
||
Price history
+345.6% since first listed4 events — show timeline
- 2026-05-20 Contingent — NTREIS
- 2025-09-25 Price Changed $160,000 NTREIS
- 2025-08-20 Listed $175,000 NTREIS
- 1994-04-20 Sold (Public Records) $35,910 Public Records
Property tax history
+9.2%/yrLatest (2025): $3,160 · +13.2% YoY. Source: county tax records.
Cash-flow waterfall
monthlySold comps — $/sqft
last 12 mo · ≤1 miLoading sold comps…