 🏗️ New Construction
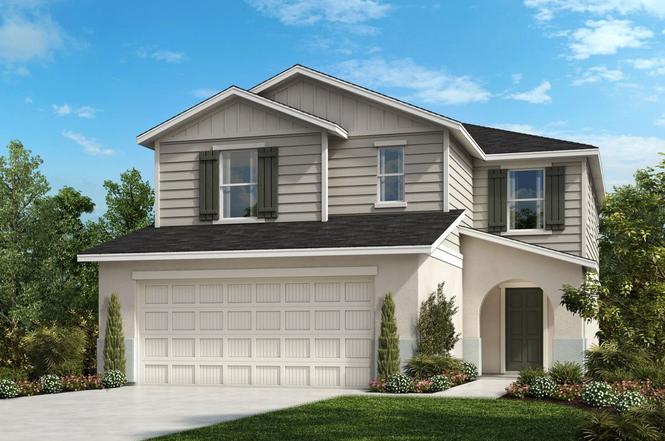
Plan 2385 Plan · North Weeki Wachee, FL
Flood risk No data
- FEMA flood zone
- —
- Chance of flooding over 30 yrs
- —
- Est. flood insurance / yr
- —
Fire risk No data
- Est. fire insurance / yr
- —
Heat risk No data
- Hot days now (above threshold)
- —
- Hot days in 30 yrs
- —
Wind risk No data
- Chance of severe wind over 30 yrs
- —
Air-quality risk No data
- Unhealthy air days now
- —
- Unhealthy air days in 30 yrs
- —
Risk factors via First Street. Map © Google.
Why this score? — see what drove the F grade
The composite is a weighted blend of 9 inputs, each scored 0–100. Each bar is that input's sub-score; the figure is the points it added to the 100-point composite (weight × sub-score).
- ARV discount +7.5/15.0
- Cash flow +6.5/30.0
- Schools +4.2/10.0
- Livability +3.4/5.0
- Rent growth +2.5/5.0
- Condition / age +2.5/5.0
- 1% rule +1.6/10.0
- DSCR +0.7/10.0
- Appreciation +0.0/10.0
$279,990
🖨 Deal sheet (PDF) 📄 Offer letter ✓ Due diligence
Listing remarks
* Large loft * Low-E windows * Dedicated laundry room * Walk-in closet at primary suite * Open floor plan * Powder bath * Den * Front porch * Spacious great room * WaterSense® labeled faucets * Walk-in kitchen pantry * ENERGY STAR® certified home * Tot lot * Dog park * Commuter-friendly location * Near the ocean * Outdoor recreation nearby * Master-planned community
Key facts
- Low-e windows
- 2 garage spots
- Listed 187 days
Tags
Property features AI
Finance
- Financial info: List price $279,990
Exterior
- Home design: Single-family plan home; Located at Weeki Wachee, FL (zip 34613)
- Exterior features: Living area of 2385 (indicator of home's size)
Interior
- Bedrooms: 3 bedrooms
- Bathrooms: 2 full bathrooms and 1 half bathroom (2.5 total)
- Interior features: Plan 2385 (new construction plan)
Neighborhood map
What this means for you Summary
Snapshot
- This is a 3-bed/2.5-bath single-family listed at $280k.
Deal economics
- At list price, monthly cash flow is $-655 ($-8k/yr) — negative.
- The deal already cash-flows at list — no discount required.
- To meet the 1% rule (rent ≥ 1% of price), the offer needs to be $253k (9.6% below list).
- Recommended offer: $246k (12.0% below list) — sets the bar for market timing.
Location & tenants
- Location reads 68/100 on livability (#534 in FL) — a middle-class / working-renter tenant base. Strengths: cost of living A+, housing A+, crime B+; Watch: health & safety C-, amenities F, commute F.
- Hernando (suburban): math 50% / reading 50% proficiency, ranked #38 of 73 in FL (top 52%) — acceptable for families but not a draw, mixed tenant base, ~2y average lease.
- Zoned schools: Winding Waters K-8 (math 50% / reading 48%, grade D, #1,134 of 2,144 statewide, top 54%, 1,622 students, 56% FRL); Weeki Wachee High School (math 41% / reading 42%, grade F, #284 of 667 statewide, top 43%, 1,435 students, 52% FRL) — zoned schools at 54% FRL track the district average.
- Market conditions: 695 active listings in the ZIP; 4 comparable units currently listed for rent nearby; rentals at typical pace (median 26d on market — plan ~3-4 weeks tenant-placement turnaround); 2,505 units permitted in Hernando County in 2024 (318 in 5+ unit buildings).
- At $2,530/mo this rent would consume 52% of the median local household income ($59k/yr) (locally 307% of renters already pay >50% of income on rent) — very limited rent-growth headroom before tenants either downsize or default.
Forward outlook
- Local home prices are declining (-3.0%/yr); year-one equity from $3k of loan paydown is wiped out by about $12k of value loss. Plan a longer hold.
- Hernando County population projected at +11% by 2050 — modest demand growth; plan on rents tracking national, not racing it.
Negotiation context
- It's been on market 187 days — a 12% lower offer ($246k) is reasonable based on typical stale-listing flexibility.
Questions for the listing agent
- What do current leases actually rent for vs. the listed asking? Can we see a recent rent roll and the last 12 months of T-12 income?
- It's been on market 187 days. Have you received any prior offers? Is the seller open to a 12% concession, seller financing, or rate buy-down credit?
- Why hasn't it sold? Are there any deal-killer items the seller is aware of (foundation, flood, title, zoning, code violations)?
- Is there a deadline driving the sale (1031 exchange, divorce, estate, relocation)? That informs how much negotiation room exists.
- Schools are F-rated, which usually means shorter tenancies and higher turnover. Who's the typical renter profile here, and what's been the actual vacancy rate?
- The area grade is low — what's the realistic commute time and amenity access for the typical tenant pool here? Any planned neighborhood developments (good or bad) we should know about?
- What's the average days-on-market for RENTAL listings here right now (not sales)? A rising rental-DOM trend means longer vacancies and softer asking-rent achievability than the comps imply.
- What's the recent tenant-quality profile in this submarket — average credit score on applications, eviction rate, late-payment / NSF rate, and stable-employment percentage? A property-management company in the area should have these aggregated.
- How much new for-sale + rental construction is in the pipeline within 1–3 miles? Heavy new supply typically softens prices + rents 12–24 months out; constrained supply supports both.
Investment metrics
- 1% rule
- 0.66% ✗
- Cap rate
- 4.25%
- Cash-on-cash
- -7.31%
- DSCR
- 0.67
- GRM
- 12.6
CMA / ARV
- ARV (on-the-fly)
- $383,985
- Comps found
- 12
Show comp detail 12 sales within ~0.75 mi
| Address | Dist | Beds/Ba | Sqft | Sold | Price | $/sf | Match |
|---|---|---|---|---|---|---|---|
| 10540 Tucker Rd | 0.15mi | 4/2.5 (+1) | 2,260 (-5%) | 1mo | $321,000 | $142 | 78 |
| 10471 Tucker Rd | 0.15mi | 4/2.5 (+1) | 2,260 (-5%) | 3mo | $319,990 | $142 | 77 |
| 10460 Tucker Rd | 0.12mi | 4/2.5 (+1) | 2,260 (-5%) | 6mo | $312,990 | $138 | 76 |
| 10507 Tucker Rd | 0.17mi | 4/2.5 (+1) | 2,260 (-5%) | 3mo | $310,000 | $137 | 76 |
| 10447 Tucker Rd | 0.14mi | 4/2.5 (+1) | 2,260 (-5%) | 6mo | $315,990 | $140 | 75 |
| 10492 Tucker Rd | 0.14mi | 4/2.5 (+1) | 2,260 (-5%) | 8mo | $328,990 | $146 | 73 |
| 11000 Maybird Ave | 0.42mi | 4/3.0 (+1) | 2,536 (+6%) | 9mo | $495,000 | $195 | 56 |
| 11079 Millerdale Rd | 0.63mi | 4/3.0 (+1) | 2,435 (+2%) | 8mo | $418,100 | $172 | 54 |
| 11009 Maybird Ave | 0.44mi | 4/2.0 (+1) | 2,238 (-6%) | 15mo | $360,000 | $161 | 50 |
| 10342 Mirage Ave | 0.71mi | 4/2.0 (+1) | 2,120 (-11%) | 3mo | $374,900 | $177 | 39 |
| 11102 Warm Wind Way | 0.70mi | 4/2.0 (+1) | 2,559 (+7%) | 24mo | $585,000 | $229 | 28 |
| 11108 Warm Wind Way | 0.73mi | 4/3.0 (+1) | 2,693 (+13%) | 19mo | $565,000 | $210 | 21 |
Match score weights: distance 35% · size 25% · config 20% · recency 20%. Top-matched comps best support the ARV.
Projected returns pro-forma
-3.0% appreciation · 3.0% rent growth · sell at horizon
- IRR
- -29.0%
- Equity multiple
- 0.03×
- Total profit
- $-103,892
- Equity at exit
- $57,253
- IRR
- -29.0%
- Equity multiple
- -0.34×
- Total profit
- $-144,018
- Equity at exit
- $33,200
Cash invested: $107,516 (down + closing). Projections, not guarantees.
Landlord ↔ Tenant lean methodology
- Overall (STATE)
- 87 Strongly Landlord-Friendly
- State Florida
- 87 Strongly Landlord-Friendly · R+3
- County
- — inherits STATE
- City
- — inherits STATE
ZIP-level market 34613
- Home prices YoY
- -17.2%
- Active inventory
- 695
- Price-to-rent
- 9.2×
Monthly cashflow live
- Estimated rent
- $2,530 medium interval (Pro) →
- Mortgage (P&I)
- −$2,014
- Tax est. 1.5%
- −$480 /mo · $5,760/yr
- Insurance
- −$160
- HOA
- −$0
- Vacancy / Maint / Mgmt
- −$531
- Net cashflow
- $-655
Break-even live
Sensitivity live
| Price | -10% $-389 | -5% $-522 | +0% $-655 | +5% $-788 | +10% $-920 |
|---|---|---|---|---|---|
| Rent | -10% $-855 | -5% $-755 | +0% $-655 | +5% $-555 | +10% $-455 |
| Rate | -1.0pp $-461 | -0.5pp $-557 | base $-655 | +0.5pp $-754 | +1.0pp $-856 |
UW: 25.0% down · 7.5% · 30yr · 1.5% tax · 5.0% vac · 8.0% maint · 8.0% mgmt
Financing live
Cash to close
- Down payment
- $95,996
- Closing costs
- $11,520
- Reserves months
- —
- Total cash needed
- —
Loan-product check · same deal, 3 products live
Conventional
25% down · 7.5% · 30yr
- Down + closing
- —
- Monthly P&I
- —
- Monthly cashflow
- —
- DSCR
- —
- Eligible?
- —
Personal DTI + credit; lowest rate.
DSCR
20% down · 8.5% · 30yr
- Down + closing
- —
- Monthly P&I
- —
- Monthly cashflow
- —
- DSCR
- —
- Eligible?
- —
No personal income docs; deal must DSCR.
Hard money
10% down · 12.0% · 12mo
- Down + closing
- —
- Monthly P&I
- —
- Monthly cashflow
- —
- DSCR
- —
- Eligible?
- —
Short-term bridge; refi at stabilization.
Rent comps 4 comps
| Address | Beds | Baths | Sqft | Rent | $/sqft | DOM | Units | Dist |
|---|---|---|---|---|---|---|---|---|
| 10507 Tucker Rd Weeki Wachee, FL | 4.0 | 2.5 | 2650 | $2,650 | $1.00 | 26d | 1 | 0.14mi |
| 9408 New Orleans Dr Weeki Wachee, FL | 2.0 | 2.0 | 1650 | $1,995 | $1.21 | 26d | 1 | 1.16mi |
| 9376 Southern Belle Dr Weeki Wachee, FL | 3.0 | 2.0 | 2028 | $2,300 | $1.13 | 3d | 1 | 1.41mi |
| 9376 Southern Belle Dr Weeki Wachee, FL | 3.0 | 2.0 | 2028 | $2,300 | $1.13 | 6d | 1 | 1.41mi |
Listing history 15 events
-
2026-06-21days on market $279,990 Active 187 DOM
-
2026-06-18days on market $279,990 Active 184 DOM
-
2026-06-17days on market $279,990 Active 183 DOM
-
2026-06-16days on market $279,990 Active 182 DOM
-
2026-06-15days on market $279,990 Active 181 DOM
-
2026-06-13days on market $279,990 Active 179 DOM
-
2026-06-13days on market $279,990 Active 178 DOM
-
2026-06-09days on market $279,990 Active 175 DOM
-
2026-06-08days on market $279,990 Active 174 DOM
-
2026-06-07days on market $279,990 Active 173 DOM
-
2026-06-04days on market $279,990 Active 170 DOM
-
2026-06-03days on market $279,990 Active 169 DOM
-
2026-06-02days on market $279,990 Active 168 DOM
-
2026-06-01days on market $279,990 Active 167 DOM
-
2026-05-31days on market $279,990 Active 166 DOM
ⓘ Source: listings_history table (triggers on properties + properties_extension) + one-shot
backfill from property_details.listing_events for pre-trigger history.
Nearby sold comps map
Loading sold comps map…
Walkable amenities ~0.75 mi
Loading nearby amenities…
Taxation est. · year 1
- Rental income
- $30,361
- − Mortgage interest
- −$21,509
- − Property taxes
- −$5,760
- − Insurance
- −$1,920
- − Repairs & maintenance
- −$2,429
- − Management
- −$2,429
- − Depreciation
- −$11,170
- Taxable loss
- −$14,856
- Est. tax savings @ 24.0%
- +$3,565
- After-tax cash flow
- $-4,293/yr
For passive investors: Depreciation is non-cash, so a rental often shows a tax loss while cash-flowing — sheltering income. Rental losses are passive: they offset passive income freely, and up to $25,000/yr can offset ordinary (W-2) income if you actively participate and your MAGI is under $100k (phasing out to $0 by $150k); unused losses carry forward. On sale, claimed depreciation is recaptured at up to 25%, and gains may owe capital-gains tax (a 1031 exchange can defer both). Figures are a year-1 estimate at your 24.0% rate — not tax advice; consult a CPA.
Schools (NCES district)
- District
- Hernando
- NCES district ID
- 1200810
- Math proficiency
- 50% ▼ -8.00%
- Reading proficiency
- 50% ▼ -4.00%
- Median HH income
- $41,985
- Composite
- 42.03/100
- National rank
- #3329
- State rank
- #38 of 73 in FL
Livability — North Weeki Wachee
- Score
- 68/100
- State rank
- #534
- US rank
- #10019
Category grades
Schools grade is shown separately in the Schools card above.
Census & demographics
- Census place
- North Weeki Wachee, FL
- County
- Hernando County · 169,677 people
- Metro
- Tampa-St. Petersburg-Clearwater, FL
- Population (ZIP)
- 19,337
- Household income
- $58,596
- Rent vs Own
- Severe rent burden
- 307.0
Population outlook (Hernando County) Hauer SSP2
- Today (2025)
- 189,218 people
- By 2030
- 194,367 · +2.7%
- By 2040
- 203,398 · +7.5%
- By 2050
- 209,589 · +10.8%
- By 2075
- 218,452 · +15.4%
- By 2100
- 205,923 · +8.8%
Race, ethnicity, and origin ACS 2023
- Neighborhood character
- Predominantly White (88%)
- Race & ethnicity
- White 88% Hispanic / Latino 6% Two or more races 4% Black 2% Asian 1%
- Hispanic origin (detail)
- Mexican 1% Puerto Rican 2% Cuban 1%
- Common ancestry
- Romanian 4% Lithuanian 3% Slovak 2%
- Foreign-born
- 8% · Canada, Vietnam
- Languages at home
- 92% English-only · Spanish 3% French/Haitian/Cajun 1% Russian/Polish/Slavic 1%
Political lean MEDSL · Hernando
- 2024 margin
- Solid R (+37.0) · D 31.1% · R 68.2%
- 2008→2024 swing
- -33.5pp toward R · 2008: -3.6pp · 2024: -37.0pp
- All cycles
- 2024: R+37.0 2020: R+30.2 2016: R+29.0 2012: R+8.5 2008: R+3.6
Not yet ingested
- Civics
- —
Market trends
- HPI YoY
- ▼ -57.51%
- Current HPI
- 276.2229
- Rent YoY
- —
- Metro
- Tampa-St. Petersburg-Clearwater, FL
- State GDP YoY
- ▲ 3.28%
- F500 in state
- 36
Industry mix (Fortune 500 HQ in FL)
| Industry | F500 HQs | Revenue |
|---|---|---|
| Industrial Technology | 2 | $29B |
|
||
| Insurance | 2 | $17B |
|
||
| Retail | 1 | $60B |
|
||
| Technology Distribution | 1 | $58B |
|
||
| Homebuilding | 1 | $35B |
|
||
| Technology Manufacturing | 1 | $35B |
|
||
Cash-flow waterfall
monthlySold comps — $/sqft
last 12 mo · ≤1 miLoading sold comps…