 Duplex
913 Old Noonday Sch House Rd · Woodstock, GA
Flood risk 1/10 · Minimal
- FEMA flood zone
- X (unshaded)
- Chance of flooding over 30 yrs
- 0.0%
- Est. flood insurance / yr
- $473 – $860
Fire risk 2/10 · Minimal
- Est. fire insurance / yr
- $963 – $1,789
Heat risk 5/10 · Moderate
- Hot days now (above 103°F)
- 7 days/yr
- Hot days in 30 yrs
- 18 days/yr
Wind risk 4/10 · Minor
- Chance of severe wind over 30 yrs
- 19.0%
Air-quality risk 4/10 · Minor
- Unhealthy air days now
- 5 days/yr
- Unhealthy air days in 30 yrs
- 7 days/yr
Risk factors via First Street. Map © Google.
Why this score? — see what drove the C grade
The composite is a weighted blend of 9 inputs, each scored 0–100. Each bar is that input's sub-score; the figure is the points it added to the 100-point composite (weight × sub-score).
- Cash flow +22.8/30.0
- ARV discount +7.5/15.0
- DSCR +7.3/10.0
- 1% rule +5.9/10.0
- Schools +3.8/10.0
- Livability +3.7/5.0
- Rent growth +2.4/5.0
- Condition / age +2.2/5.0
- Appreciation +0.0/10.0
$379,000
🖨 Deal sheet (PDF) 📄 Offer letter ✓ Due diligence
Multi-family units
County records classify this as Multi-Family (2-4 Unit). Listing-text estimate: 2 units. confirmed
Listing remarks MLS
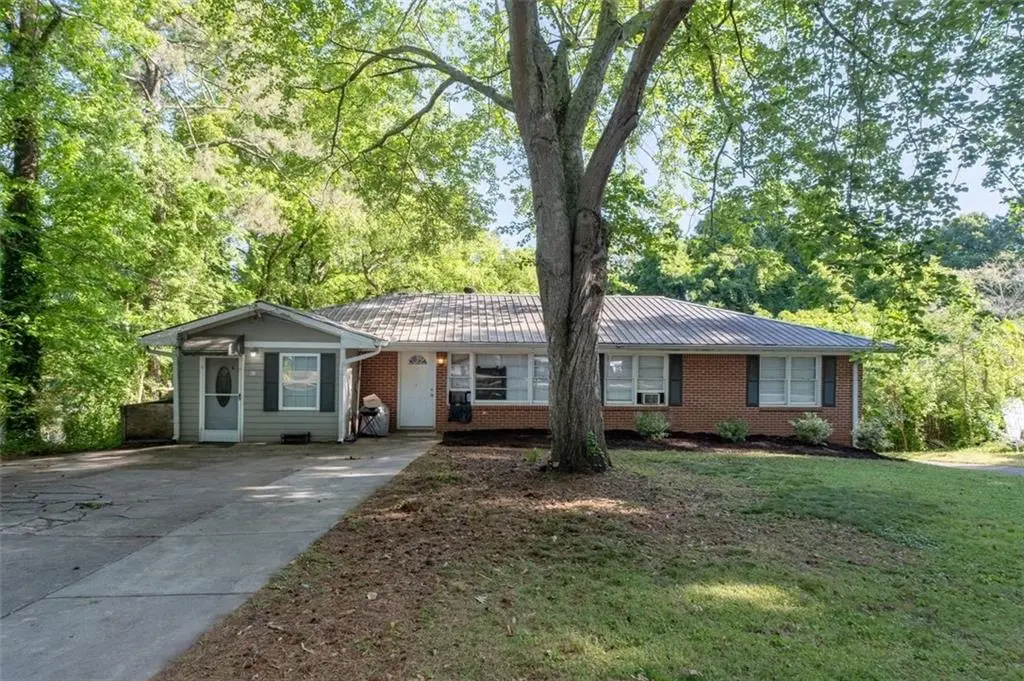
Exceptional investment opportunity at 913 Old Noonday Schoolhouse Road! This solid, four-sided brick duplex has been consistently tenant-occupied for over 17 years, providing reliable income throughout ownership. Featuring a durable metal roof and a spacious yard, the property is situated on a quiet street while still offering convenient access to all that Cobb County has to offer. Ideal for both seasoned investors and those looking to house hack, this duplex presents strong income potential with long-term rental history. Located in the highly sought-after Kell High School district, this property combines stability, location, and opportunity making it a standout addition to any real estate portfolio. Listing agent is the principal in the transaction.
Key facts
- Durable metal roof
- Spacious yard
- Quiet street
Tags
Property features AI
Finance
- Financial info: Total units: 2 (multi-family information); Unit rents noted: Unit 1 $1,100; Unit 2 $720; Unit 3 $500; Unit 4 $500; Utility/maintenance inclusions vary by unit (many include electric, gas, water, maintenance; garbage inclusion varies)
Exterior
- Parking: Driveway parking; Open parking available
- Utilities: Public water; Septic sewer; Cable available; Electricity available; Natural gas available; Water available
- Home design: Single-story property; Brick on all sides; Metal roof
- Construction: Brick construction; Metal roof
- Exterior features: Near schools; Near shopping
Interior
- Kitchen: Each unit includes a refrigerator
- Bedrooms: Unit 1: 2 bedrooms; Unit 2: 1 bedroom; Unit 3: 1 bedroom; Unit 4: 1 bedroom
- Bathrooms: Unit 1: 1 bathroom; Unit 2: 1 bathroom; Unit 3: 1 bathroom; Unit 4: 1 bathroom
- Heating & cooling: Central heating (electric); Window air conditioning units; Electric cooling available
- Interior features: One-level layout; Resale condition
- Laundry & utility: Some utilities included vary by unit (see unit details)
Neighborhood map
What this means for you Summary
Snapshot
- This is a 2 × 2-bed/2.0-bath units multifamily listed at $379k. Condition is rated fair.
Deal economics
- At list price, monthly cash flow is $657 ($8k/yr) — positive. Per door: $328/mo.
- The deal already cash-flows at list — no discount required.
- Meets the 1% rule at list price ($4k rent vs $379k).
- Recommended offer: $368k (3.0% below list) — sets the bar for market timing.
- Cap rate 8.4% vs local median 3.3% in Woodstock — top-decile yield for the area; either an underpriced asset or a hidden risk that comps aren't pricing in. Stress-test before assuming the spread holds.
Location & tenants
- Location reads 73/100 on livability (#46 in GA) — a middle-class / working-renter tenant base. Strengths: crime A+, employment A+, housing A+; Watch: amenities F, commute F, health & safety F.
- Cobb County (suburban): math 39% / reading 45% proficiency, ranked #25 of 174 in GA (top 14%) — families likely to look elsewhere, expect single-tenant / working-renter base with shorter leases.
- Zoned schools: Nicholson Elementary School (math 42% / reading 42%, grade F, #380 of 1,228 statewide, top 33%, 407 students, 36% FRL); Mccleskey Middle School (math 37% / reading 44%, grade F, #140 of 470 statewide, top 30%, 570 students, 34% FRL); Kell High School (math 28% / reading 21%, grade F, #184 of 424 statewide, top 48%, 1,506 students, 32% FRL).
- Market conditions: Rents soft (-0.4%/yr); 446 active listings in the ZIP; 18 comparable units currently listed for rent nearby; rentals at typical pace (median 19d on market — plan ~3-4 weeks tenant-placement turnaround); high-income renter base; 1,625 units permitted in Cobb County in 2024 (389 in 5+ unit buildings).
- This rent runs 43% of the median local income ($116k/yr) — at the standard rent-burdened threshold; future hikes will face affordability resistance.
Forward outlook
- Local home prices are declining (-3.0%/yr); year-one equity from $3k of loan paydown is wiped out by about $11k of value loss. Plan a longer hold.
- Cobb County population projected at +33% by 2050 — long-run rental-demand tailwind backs the buy-and-hold thesis.
Negotiation context
- It's been on market 53 days — a 3% lower offer ($368k) is reasonable based on typical stale-listing flexibility.
- 3 sale attempts with the ask held roughly flat each time — persistent listings suggest the price (not the market) is what's stuck; bring a comps-based counter.
Risks & watch-outs
- Climate carrying-cost: extreme-heat days projected 7→18/yr by 2055 (HVAC capex compounding) — expect insurance premiums to compound above CPI over the hold.
Questions for the listing agent
- It's been on market 53 days. Have you received any prior offers? Is the seller open to a 3% concession, seller financing, or rate buy-down credit?
- Can we see the unit-by-unit rent roll, current vacancy, and any below-market leases? What's the average tenancy length?
- What capital expenditures (roof, boiler, parking lot, exteriors) have been made in the last 5 years, and what's planned in the next 2?
- Have any recent inspections been done? Can we get a copy of the seller's disclosures and any deferred-maintenance estimates?
- Built in 1965 — when were the roof, HVAC, electrical panel, plumbing, and water heater last replaced?
- Is there a deadline driving the sale (1031 exchange, divorce, estate, relocation)? That informs how much negotiation room exists.
- Schools are B-rated — typically a magnet for longer-tenancy family renters. What's the average tenant stay here, and is there a school-zone premium baked into asking?
- What's the average days-on-market for RENTAL listings here right now (not sales)? A rising rental-DOM trend means longer vacancies and softer asking-rent achievability than the comps imply.
- What's the recent tenant-quality profile in this submarket — average credit score on applications, eviction rate, late-payment / NSF rate, and stable-employment percentage? A property-management company in the area should have these aggregated.
- How much new apartment / multifamily construction is in the pipeline within 1–3 miles? Heavy new supply (>2% of stock underway) typically softens rents 12–24 months out; light construction supports rent growth.
Investment metrics
- 1% rule
- 1.09% ✓
- Cap rate
- 8.37%
- Cash-on-cash
- 7.43%
- DSCR
- 1.33
- GRM
- 7.6
CMA / ARV
No comps found within radius.
Show comp detail 3 sales within ~0.75 mi
| Address | Dist | Beds/Ba | Sqft | Sold | Price | $/sf | Match |
|---|---|---|---|---|---|---|---|
| 771 Farm Creek Rd NE | 0.29mi | 5/3.0 (+1) | — | 3mo | $425,000 | — | 62 |
| 800 Farm Creek Rd NE #802 | 0.41mi | 5/4.0 (+1) | — | 23mo | $420,000 | — | 44 |
| 800 Farm Creek Rd NE | 0.41mi | 5/4.0 (+1) | — | 23mo | $420,000 | — | 44 |
Match score weights: distance 35% · size 25% · config 20% · recency 20%. Top-matched comps best support the ARV.
Projected returns pro-forma
-3.0% appreciation · 0.0% rent growth · sell at horizon
- IRR
- -8.4%
- Equity multiple
- 0.70×
- Total profit
- $-31,664
- Equity at exit
- $56,510
- IRR
- -3.3%
- Equity multiple
- 0.81×
- Total profit
- $-20,408
- Equity at exit
- $32,769
Cash invested: $106,120 (down + closing). Projections, not guarantees.
Landlord ↔ Tenant lean methodology
- Overall (STATE)
- 90 Strongly Landlord-Friendly
- State Georgia
- 90 Strongly Landlord-Friendly · R+3
- County
- — inherits STATE
- City
- — inherits STATE
ZIP-level market 30066
- Rents YoY
- -0.4%
- Active inventory
- 446
- Price-to-rent
- 15.2×
Monthly cashflow live
- Estimated rent
- $4,147 high interval (Pro) →
- Mortgage (P&I)
- −$1,988
- Tax est. 1.5%
- −$474 /mo · $5,685/yr
- Insurance
- −$158
- HOA
- −$0
- Vacancy / Maint / Mgmt
- −$871
- Net cashflow
- $657
Break-even live
Sensitivity live
| Price | -10% $919 | -5% $788 | +0% $657 | +5% $526 | +10% $395 |
|---|---|---|---|---|---|
| Rent | -10% $329 | -5% $493 | +0% $657 | +5% $821 | +10% $985 |
| Rate | -1.0pp $848 | -0.5pp $753 | base $657 | +0.5pp $559 | +1.0pp $459 |
2-unit breakdown (identical units grouped — click to expand)
| Units | Beds | Baths | Est. rent |
|---|---|---|---|
| 2× units | 2 | 2 | $4,148 |
| #1 | 2 | 2 | $2,074 |
| #2 | 2 | 2 | $2,074 |
| Total (2 units) | $4,147 | ||
UW: 25.0% down · 7.5% · 30yr · 1.5% tax · 5.0% vac · 8.0% maint · 8.0% mgmt
Financing live
Cash to close
- Down payment
- $94,750
- Closing costs
- $11,370
- Reserves months
- —
- Total cash needed
- —
Loan-product check · same deal, 3 products live
Conventional
25% down · 7.5% · 30yr
- Down + closing
- —
- Monthly P&I
- —
- Monthly cashflow
- —
- DSCR
- —
- Eligible?
- —
Personal DTI + credit; lowest rate.
DSCR
20% down · 8.5% · 30yr
- Down + closing
- —
- Monthly P&I
- —
- Monthly cashflow
- —
- DSCR
- —
- Eligible?
- —
No personal income docs; deal must DSCR.
Hard money
10% down · 12.0% · 12mo
- Down + closing
- —
- Monthly P&I
- —
- Monthly cashflow
- —
- DSCR
- —
- Eligible?
- —
Short-term bridge; refi at stabilization.
Rent comps 18 comps
| Address | Beds | Baths | Sqft | Rent | $/sqft | DOM | Units | Dist |
|---|---|---|---|---|---|---|---|---|
| 933 Old Noonday Sch House Rd Marietta, GA | 3.0 | 2.0 | 1500 | $1,800 | $1.20 | 21d | 1 | 0.07mi |
| 710 Smokey Quartz Way Kennesaw, GA | 3.0 | 2.5 | 2046 | $2,900 | $1.42 | 25d | 1 | 0.19mi |
| 675 Smokey Quartz Way Kennesaw, GA | 4.0 | 3.5 | 2390 | $3,250 | $1.36 | 6d | 1 | 0.24mi |
| 4723 Canary Diamond Ln Kennesaw, GA | 4.0 | 3.5 | 2200 | $3,250 | $1.48 | 19d | 1 | 0.28mi |
| 4809 Nevilly Way Marietta, GA | 3.0 | 2.5 | 2008 | $2,385 | $1.19 | 6d | 1 | 0.45mi |
| 4858 Chapelle Ct Marietta, GA | 3.0 | 2.0 | 1590 | $2,200 | $1.38 | 5d | 1 | 0.55mi |
| 1370 High Country Ct Marietta, GA | 3.0 | 2.0 | 1260 | $2,059 | $1.63 | 44d | 1 | 0.82mi |
| 314 New Crossing Trl E Kennesaw, GA | 4.0 | 4.0 | 2328 | $800 | $0.34 | 44d | 1 | 1.03mi |
| 1515 Captain Thomas Ct Marietta, GA | 3.0 | 2.0 | 1651 | $2,458 | $1.49 | 4d | 1 | 1.07mi |
| 527 Charing Cross Dr Marietta, GA | 4.0 | 3.0 | 2600 | $6,300 | $2.42 | 44d | 1 | 1.09mi |
| 151 Castleair Dr NE Kennesaw, GA | 3.0 | 2.0 | 1780 | $2,225 | $1.25 | 18d | 1 | 1.16mi |
| 151 Castleair Dr NE Kennesaw, GA | 3.0 | 2.0 | 1780 | $2,075 | $1.17 | 6d | 1 | 1.16mi |
| 4750 Jamerson Forest Cir Marietta, GA | 4.0 | 3.0 | 2211 | $2,545 | $1.15 | 23d | 1 | 1.17mi |
| 3978 Catalina Dr Marietta, GA | 3.0 | 2.5 | 2743 | $2,395 | $0.87 | 6d | 1 | 1.38mi |
| 4805 Shallow Farm Dr NE Kennesaw, GA | 3.0 | 2.0 | 1636 | $2,355 | $1.44 | 3d | 1 | 1.41mi |
| 891 Old Farm Walk Marietta, GA | 4.0 | 3.0 | 1550 | $2,579 | $1.66 | 18d | 1 | 1.42mi |
| 3941 Kensington Dr Marietta, GA | 5.0 | 3.0 | 2379 | $2,825 | $1.19 | 25d | 1 | 1.49mi |
| 10247 Highway 92 Woodstock, GA | 1.0–3.0 | 1.0–2.0 | 1093 | $2,025 | $1.85 | 0d | 10 | 1.50mi |
Listing history 19 events
-
2026-06-21days on market $379,000 Active 53 DOM
-
2026-06-18days on market $379,000 Active 50 DOM
-
2026-06-17days on market $379,000 Active 49 DOM
-
2026-06-16days on market $379,000 Active 48 DOM
-
2026-06-15days on market $379,000 Active 47 DOM
-
2026-06-13days on market $379,000 Active 45 DOM
-
2026-06-13days on market $379,000 Active 44 DOM
-
2026-06-09days on market $379,000 Active 41 DOM
-
2026-06-08days on market $379,000 Active 40 DOM
-
2026-06-07days on market $379,000 Active 39 DOM
-
2026-06-04days on market $379,000 Active 36 DOM
-
2026-06-03days on market $379,000 Active 35 DOM
-
2026-06-02days on market $379,000 Active 34 DOM
-
2026-06-01days on market $379,000 Active 33 DOM
-
2026-05-31days on market $379,000 Active 32 DOM
-
2026-05-08status Active 762-char remark
-
2026-05-08historical 762-char remark
-
2026-04-29$379,000 New 762-char remark
Show marketing remark (762 chars)
Exceptional investment opportunity at 913 Old Noonday Schoolhouse Road! This solid, four-sided brick duplex has been consistently tenant-occupied for over 17 years, providing reliable income throughout ownership. Featuring a durable metal roof and a spacious yard, the property is situated on a quiet street while still offering convenient access to all that Cobb County has to offer. Ideal for both seasoned investors and those looking to house hack, this duplex presents strong income potential with long-term rental history. Located in the highly sought-after Kell High School district, this property combines stability, location, and opportunity making it a standout addition to any real estate portfolio. Listing agent is the principal in the transaction.
-
2026-04-29$379,000 Active 762-char remark
Show marketing remark (762 chars)
Exceptional investment opportunity at 913 Old Noonday Schoolhouse Road! This solid, four-sided brick duplex has been consistently tenant-occupied for over 17 years, providing reliable income throughout ownership. Featuring a durable metal roof and a spacious yard, the property is situated on a quiet street while still offering convenient access to all that Cobb County has to offer. Ideal for both seasoned investors and those looking to house hack, this duplex presents strong income potential with long-term rental history. Located in the highly sought-after Kell High School district, this property combines stability, location, and opportunity making it a standout addition to any real estate portfolio. Listing agent is the principal in the transaction.
ⓘ Source: listings_history table (triggers on properties + properties_extension) + one-shot
backfill from property_details.listing_events for pre-trigger history.
Climate risk First Street
- Flood 1/10 Low FEMA zone X (unshaded) · 0% chance over 30 yrs
- Wildfire 2/10 Low
- Heat 5/10 Major 7 d/yr ≥103°F today · 18 d/yr by 30 yrs out
- Wind 4/10 Moderate 19% chance of damaging wind over 30 yrs
- Air quality 4/10 Moderate 5 unhealthy d/yr today · 7 by 30 yrs out
Nearby sold comps map
Loading sold comps map…
Walkable amenities ~0.75 mi
Loading nearby amenities…
Taxation est. · year 1
- Rental income
- $49,764
- − Mortgage interest
- −$21,230
- − Property taxes
- −$5,685
- − Insurance
- −$1,895
- − Repairs & maintenance
- −$3,981
- − Management
- −$3,981
- − Depreciation
- −$11,025
- Taxable income
- $1,966
- Est. tax owed @ 24.0%
- −$472
- After-tax cash flow
- $7,411/yr
For passive investors: Depreciation is non-cash, so a rental often shows a tax loss while cash-flowing — sheltering income. Rental losses are passive: they offset passive income freely, and up to $25,000/yr can offset ordinary (W-2) income if you actively participate and your MAGI is under $100k (phasing out to $0 by $150k); unused losses carry forward. On sale, claimed depreciation is recaptured at up to 25%, and gains may owe capital-gains tax (a 1031 exchange can defer both). Figures are a year-1 estimate at your 24.0% rate — not tax advice; consult a CPA.
Condition & rehab AI · 14 photos
This multi-family property presents a moderate level of rehab opportunity with dated kitchens, flooring, and paint needing attention. Improvements in these areas would significantly enhance its resale and rental value.
Repairs flagged
- Major Kitchen cabinets — The cabinets are dated and need to be replaced or updated.
- Major Kitchen appliances — The appliances are outdated and need to be replaced.
- Major Flooring — The carpet is worn and needs to be replaced with a more durable and attractive option.
- Major Paint — The interior walls and exterior siding need to be repainted to improve the overall appearance.
- Major Landscaping — The landscaping needs to be pruned and improved to enhance the curb appeal.
Value-add opportunities
- Both Replace kitchen cabinets and appliances — Updating the kitchen will improve the overall appearance and functionality of the home, making it more attractive to potential buyers and renters.
- Both Replace flooring — Replacing the carpet with a more durable and attractive option will improve the overall appearance and functionality of the home, making it more attractive to potential buyers and renters.
- Both Repaint interior and exterior — Repainting the interior and exterior will improve the overall appearance and functionality of the home, making it more attractive to potential buyers and renters.
- Both Improve landscaping — Improving the landscaping will enhance the curb appeal and overall appearance of the home, making it more attractive to potential buyers and renters.
Renovation cost estimate screening
| Repair item | Severity | Est. cost |
|---|---|---|
| Kitchen cabinets · The cabinets are dated and need to be replaced or updated. | Major | $15,000–50,000 |
| Kitchen appliances · The appliances are outdated and need to be replaced. | Major | $15,000–50,000 |
| Flooring · The carpet is worn and needs to be replaced with a more durable and attractive option. | Major | $15,000–50,000 |
| Paint · The interior walls and exterior siding need to be repainted to improve the overall appearance. | Major | $15,000–50,000 |
| Landscaping · The landscaping needs to be pruned and improved to enhance the curb appeal. | Major | $15,000–50,000 |
| Total estimated repair cost · 5 items | $75,000–250,000 |
Value-add ROI direction
- Both Replace kitchen cabinets and appliances — Updating the kitchen will improve the overall appearance and functionality of the home, making it more attractive to potential buyers and renters. ↑
- Both Replace flooring — Replacing the carpet with a more durable and attractive option will improve the overall appearance and functionality of the home, making it more attractive to potential buyers and renters. ↑
- Both Repaint interior and exterior — Repainting the interior and exterior will improve the overall appearance and functionality of the home, making it more attractive to potential buyers and renters. ↑
- Both Improve landscaping — Improving the landscaping will enhance the curb appeal and overall appearance of the home, making it more attractive to potential buyers and renters. ↑
ⓘ Cost ranges are severity-bucket heuristics (US national rule-of-thumb). Get contractor quotes + a written scope before underwriting a rehab budget.
Schools (NCES district)
- District
- Cobb County
- NCES district ID
- 1301290
- Math proficiency
- 39% ▼ -15.00%
- Reading proficiency
- 45% ▼ -10.00%
- Median HH income
- $68,845
- Composite
- 37.93/100
- National rank
- #4308
- State rank
- #25 of 174 in GA
Livability — Woodstock
- Score
- 73/100
- State rank
- #46
- US rank
- #5116
Category grades
Schools grade is shown separately in the Schools card above.
Census & demographics
- County
- Cobb County · 777,758 people
- City population
- 331,369
- Metro
- Atlanta-Sandy Springs-Alpharetta, GA
- Population (ZIP)
- 61,761
- Household income
- $116,074
- Rent vs Own
- Severe rent burden
- 1101.0
Population outlook (Cobb County) Hauer SSP2
- Today (2025)
- 868,385 people
- By 2030
- 929,614 · +7.1%
- By 2040
- 1,047,533 · +20.6%
- By 2050
- 1,155,537 · +33.1%
- By 2075
- 1,405,030 · +61.8%
- By 2100
- 1,555,058 · +79.1%
Race, ethnicity, and origin ACS 2023
- Neighborhood character
- Diverse neighborhood (Simpson 0.57)
- Race & ethnicity
- White 62% Black 16% Hispanic / Latino 10% Two or more races 10% Asian 6%
- Hispanic origin (detail)
- Mexican 4% Puerto Rican 1% Cuban 1%
- Common ancestry
- Italian 2% Slovak 2% Lithuanian 2%
- Foreign-born
- 15% · Canada, Vietnam, China
- Languages at home
- 82% English-only · Spanish 7% Other Indo-European 4% Other Asian/Pacific 1%
Political lean MEDSL · Cobb
- 2024 margin
- D (+14.9) · D 56.9% · R 42.0% · Other 1.1%
- 2008→2024 swing
- +24.3pp toward D · 2008: -9.4pp · 2024: 14.9pp
- All cycles
- 2024: D+14.9 2020: D+14.3 2016: D+2.1 2012: R+12.6 2008: R+9.4
Not yet ingested
- Civics
- —
Market trends
- HPI YoY
- ▼ -269.40%
- Current HPI
- 250.037
- Rent YoY
- ▼ -0.38%
- Metro
- Atlanta-Sandy Springs-Alpharetta, GA
- State GDP YoY
- ▲ 2.66%
- F500 in state
- 28
Industry mix (Fortune 500 HQ in GA)
| Industry | F500 HQs | Revenue |
|---|---|---|
| Paper / Packaging | 2 | $29B |
|
||
| Retail | 1 | $160B |
|
||
| Transportation / Logistics | 1 | $91B |
|
||
| Airlines | 1 | $62B |
|
||
| Consumer Goods | 1 | $47B |
|
||
| Utilities | 1 | $25B |
|
||
Price history
+0.0% since first listed4 events — show timeline
- 2026-05-08 Relisted — FMLS
- 2026-05-08 Listing Removed — FMLS
- 2026-04-29 Listed $379,000 FMLS
- 2026-04-29 Listed $379,000 GAMLS
Cash-flow waterfall
monthlySold comps — $/sqft
last 12 mo · ≤1 miLoading sold comps…