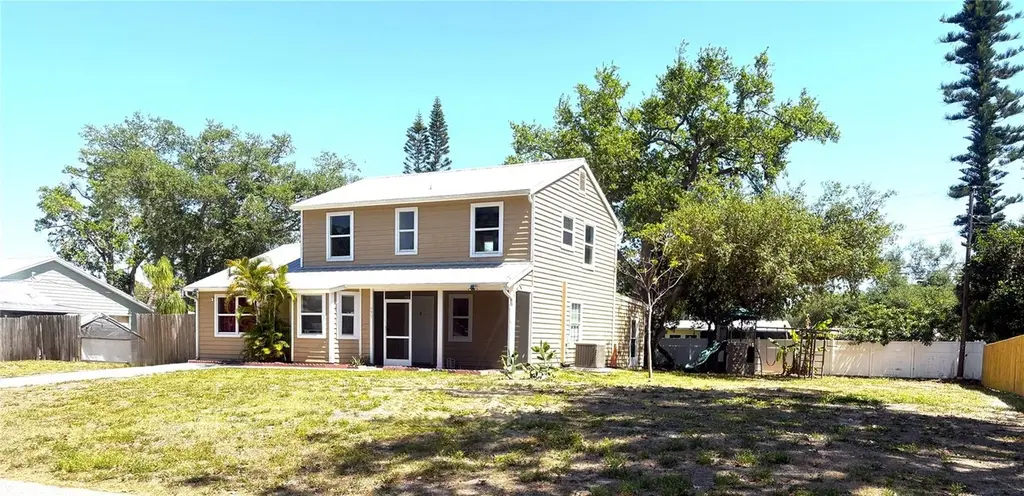
495 Burke Rd · South Venice, FL
Flood risk 3/10 · Minor
- FEMA flood zone
- X (unshaded)
- Chance of flooding over 30 yrs
- 0.09%
- Est. flood insurance / yr
- $507 – $1,088
Fire risk 1/10 · Minimal
- Est. fire insurance / yr
- $947 – $1,759
Heat risk 10/10 · Severe
- Hot days now (above 107°F)
- 7 days/yr
- Hot days in 30 yrs
- 28 days/yr
Wind risk 10/10 · Severe
- Chance of severe wind over 30 yrs
- 99.0%
Air-quality risk 2/10 · Minimal
- Unhealthy air days now
- 1 days/yr
- Unhealthy air days in 30 yrs
- 1 days/yr
Risk factors via First Street. Map © Google.
Why this score? — see what drove the C grade
The composite is a weighted blend of 9 inputs, each scored 0–100. Each bar is that input's sub-score; the figure is the points it added to the 100-point composite (weight × sub-score).
- Cash flow +24.3/30.0
- DSCR +7.9/10.0
- ARV discount +7.5/15.0
- 1% rule +6.0/10.0
- Schools +5.4/10.0
- Livability +3.4/5.0
- Rent growth +2.7/5.0
- Condition / age +2.5/5.0
- Appreciation +0.0/10.0
$250,000
🖨 Deal sheet 📄 Offer letter ✓ Due diligence
Listing remarks
Short Sale. Opportunity awaits in South Venice for buyers, renovators, or investors willing to bring vision and TLC. Tax records reflect 4 bedrooms, and the home also offers an additional first-floor bedroom with private entrance, plus another separate-entry room with water hookup that may work well as an office, studio, craft room, hobby space, or flexible-use area. The floor plan includes both a living room and a generous family room, with a covered screened lanai extending the living space outdoors. The oversized yard adds further flexibility and potential. Conveniently located near beaches, shopping, dining, Shamrock Park and Nature Center, and the Venetian Waterway Park/Legacy Trail co
Key facts
- Oversized yard
- Water hookup
- Private entrance
Tags
Property features AI
Finance
- Other: Zoning: RSF3
- Financial info: Lease restrictions apply
- HOA & community: No HOA
Exterior
- Utilities: Well water; Septic tank; Public utilities available
- Home design: Single family residence; Residential property; Two stories; Faces northwest; Entry on main level
- Construction: Frame construction with wood siding; Metal roof; Slab foundation; Built as a multi-level home
- Exterior features: Covered front porch; Screened porch; Private mailbox; Shed(s), storage and workshop on property; Paved road access; Oversized lot; Located in county
Interior
- Kitchen: Microwave; Range; Refrigerator
- Bedrooms: 4 bedrooms
- Flooring: Ceramic tile; Wood
- Bathrooms: 2 full bathrooms
- Heating & cooling: Central heating; Central air conditioning
- Interior features: Ceiling fans
- Laundry & utility: Inside laundry room
Neighborhood map
What this means for you Summary
Snapshot
- This is a 4-bed/2.0-bath single-family listed at $250k.
Deal economics
- At list price, monthly cash flow is $505 ($6k/yr) — positive.
- The deal already cash-flows at list — no discount required.
- Meets the 1% rule at list price ($3k rent vs $250k).
- Recommended offer: $246k (1.5% below list) — sets the bar for market timing.
Location & tenants
- Location reads 67/100 on livability (#549 in FL) — a middle-class / working-renter tenant base. Strengths: housing A+, crime A-, cost of living A-; Watch: schools F, amenities F, commute F.
- Sarasota (urban): math 63% / reading 63% proficiency, ranked #7 of 73 in FL (top 10%) — acceptable for families but not a draw, mixed tenant base, ~2y average lease.
- Market conditions: Rents flat; 1247 active listings in the ZIP; solid renter incomes; 7,466 units permitted in Sarasota County in 2024 (2,138 in 5+ unit buildings).
- This rent runs 37% of the median local income ($90k/yr) — at the standard rent-burdened threshold; future hikes will face affordability resistance.
Forward outlook
- Local home prices are declining (-3.0%/yr); year-one equity from $2k of loan paydown is wiped out by about $8k of value loss. Plan a longer hold.
- Sarasota County population projected at +20% by 2050 — long-run rental-demand tailwind backs the buy-and-hold thesis.
Negotiation context
- It's been on market 29 days — a 2% lower offer ($246k) is reasonable based on typical stale-listing flexibility.
- 3 sale attempts since 19y ago; this cycle's ask has dropped $50k (17%) from the opening price — seller is motivated, your offer sets the floor, not the list.
Risks & watch-outs
- Climate carrying-cost: severe wind risk, 99% chance of damaging wind over 30y; extreme-heat days projected 7→28/yr by 2055 (HVAC capex compounding) — expect insurance premiums to compound above CPI over the hold.
Questions for the listing agent
- Is there a deadline driving the sale (1031 exchange, divorce, estate, relocation)? That informs how much negotiation room exists.
- Schools are F-rated, which usually means shorter tenancies and higher turnover. Who's the typical renter profile here, and what's been the actual vacancy rate?
- What's the average days-on-market for RENTAL listings here right now (not sales)? A rising rental-DOM trend means longer vacancies and softer asking-rent achievability than the comps imply.
- What's the recent tenant-quality profile in this submarket — average credit score on applications, eviction rate, late-payment / NSF rate, and stable-employment percentage? A property-management company in the area should have these aggregated.
- How much new for-sale + rental construction is in the pipeline within 1–3 miles? Heavy new supply typically softens prices + rents 12–24 months out; constrained supply supports both.
Investment metrics
- 1% rule
- 1.10% ✓
- Cap rate
- 8.72%
- Cash-on-cash
- 8.66%
- DSCR
- 1.39
- GRM
- 7.6
CMA / ARV
No comps found within radius.
Projected returns pro-forma
-3.0% appreciation · 0.7% rent growth · sell at horizon
- IRR
- -5.7%
- Equity multiple
- 0.79×
- Total profit
- $-14,552
- Equity at exit
- $37,276
- IRR
- 1.0%
- Equity multiple
- 1.06×
- Total profit
- $4,357
- Equity at exit
- $21,615
Cash invested: $70,000 (down + closing). Projections, not guarantees.
Landlord ↔ Tenant lean methodology
- Overall (STATE)
- 87 Strongly Landlord-Friendly
- State Florida
- 87 Strongly Landlord-Friendly · R+3
- County
- — inherits STATE
- City
- — inherits STATE
ZIP-level market 34293
- Rents YoY
- 0.7%
- Active inventory
- 1247
- Price-to-rent
- 7.6×
Monthly cashflow live
- Estimated rent
- $2,759 medium interval (Pro) →
- Mortgage (P&I)
- −$1,311
- Tax from tax record
- −$259 /mo · $3,110/yr
- Insurance
- −$104
- HOA
- −$0
- Vacancy / Maint / Mgmt
- −$579
- Net cashflow
- $505
Break-even live
UW: 25.0% down · 7.5% · 30yr · 1.5% tax · 5.0% vac · 8.0% maint · 8.0% mgmt
Financing live
Cash to close
- Down payment
- $62,500
- Closing costs
- $7,500
- Reserves months
- —
- Total cash needed
- —
Loan-product check · same deal, 3 products live
Conventional
25% down · 7.5% · 30yr
- Down + closing
- —
- Monthly P&I
- —
- Monthly cashflow
- —
- DSCR
- —
- Eligible?
- —
Personal DTI + credit; lowest rate.
DSCR
20% down · 8.5% · 30yr
- Down + closing
- —
- Monthly P&I
- —
- Monthly cashflow
- —
- DSCR
- —
- Eligible?
- —
No personal income docs; deal must DSCR.
Hard money
10% down · 12.0% · 12mo
- Down + closing
- —
- Monthly P&I
- —
- Monthly cashflow
- —
- DSCR
- —
- Eligible?
- —
Short-term bridge; refi at stabilization.
Listing history 17 events
-
2026-06-10days on market $250,000 Active 29 DOM
-
2026-06-09days on market $250,000 Active 28 DOM
-
2026-06-08days on market $250,000 Active 27 DOM
-
2026-06-08days on market $250,000 Active 26 DOM
-
2026-06-05pricestatus $250,000 Active 23 DOM
-
2026-05-15status Pending
-
2026-04-22$299,900 Active
-
2026-03-05status Pending
-
2026-03-04historical
-
2026-02-12price $325,000
-
2025-12-12$350,000 Active
-
2019-08-14soldstatus $241,000
-
2008-07-22historical
-
2007-11-30$230,000
-
2005-02-02soldstatus $230,000
-
2003-12-04soldstatus $173,500
-
1994-07-26soldstatus $92,500
ⓘ Source: listings_history table (triggers on properties + properties_extension) + one-shot
backfill from property_details.listing_events for pre-trigger history.
Tax reassessment forecast FL · Resets to sale price
- Current annual tax
- $3,110 · $259/mo
- Projected year-2 tax
- $3,110 · $259/mo
- Expected delta
- $0/yr ($0/mo · 0.0%)
ⓘ Screening estimate from a state-policy table — verify with the county assessor before closing.
Climate risk First Street
- Flood 3/10 Moderate FEMA zone X (unshaded) · 9% chance over 30 yrs
- Wildfire 1/10 Low
- Heat 10/10 Extreme 7 d/yr ≥107°F today · 28 d/yr by 30 yrs out
- Wind 10/10 Extreme 99% chance of damaging wind over 30 yrs
- Air quality 2/10 Low 1 unhealthy d/yr today · 1 by 30 yrs out
Nearby sold comps map
Loading sold comps map…
Walkable amenities ~0.75 mi
Loading nearby amenities…
Taxation est. · year 1
- Rental income
- $33,111
- − Mortgage interest
- −$14,004
- − Property taxes
- −$3,110
- − Insurance
- −$1,250
- − Repairs & maintenance
- −$2,649
- − Management
- −$2,649
- − Depreciation
- −$7,273
- Taxable income
- $2,177
- Est. tax owed @ 24.0%
- −$522
- After-tax cash flow
- $5,543/yr
For passive investors: Depreciation is non-cash, so a rental often shows a tax loss while cash-flowing — sheltering income. Rental losses are passive: they offset passive income freely, and up to $25,000/yr can offset ordinary (W-2) income if you actively participate and your MAGI is under $100k (phasing out to $0 by $150k); unused losses carry forward. On sale, claimed depreciation is recaptured at up to 25%, and gains may owe capital-gains tax (a 1031 exchange can defer both). Figures are a year-1 estimate at your 24.0% rate — not tax advice; consult a CPA.
Schools (NCES district)
- District
- Sarasota
- NCES district ID
- 1201680
- Math proficiency
- 63% ▼ -8.00%
- Reading proficiency
- 63% ▼ -3.00%
- Median HH income
- $51,167
- Composite
- 53.68/100
- National rank
- #1428
- State rank
- #7 of 73 in FL
Livability — South Venice
- Score
- 67/100
- State rank
- #549
- US rank
- #10377
Category grades
Schools grade is shown separately in the Schools card above.
Census & demographics
- Census place
- South Venice, FL
- County
- Sarasota County · 448,376 people
- Metro
- North Port-Sarasota-Bradenton, FL
- Population (ZIP)
- 50,278
- Household income
- $90,038
- Rent vs Own
- Severe rent burden
- 548.0
Population outlook (Sarasota County) Hauer SSP2
- Today (2025)
- 452,380 people
- By 2030
- 474,175 · +4.8%
- By 2040
- 511,577 · +13.1%
- By 2050
- 541,467 · +19.7%
- By 2075
- 604,947 · +33.7%
- By 2100
- 621,965 · +37.5%
Race, ethnicity, and origin ACS 2023
- Neighborhood character
- Predominantly White (90%)
- Race & ethnicity
- White 90% Hispanic / Latino 5% Two or more races 4% Asian 2%
- Hispanic origin (detail)
- Mexican 1% Puerto Rican 2%
- Common ancestry
- Romanian 7% Lithuanian 4% Slovak 3%
- Foreign-born
- 9% · Canada, China, Dominican Republic
- Languages at home
- 90% English-only · Spanish 3% Russian/Polish/Slavic 2% French/Haitian/Cajun 1%
Political lean MEDSL · Sarasota
- 2024 margin
- R (+18.2) · D 40.5% · R 58.7%
- 2008→2024 swing
- -18.1pp toward R · 2008: -0.1pp · 2024: -18.2pp
- All cycles
- 2024: R+18.2 2020: R+10.4 2016: R+11.6 2012: R+7.4 2008: R+0.1
Not yet ingested
- Civics
- —
Market trends
- HPI YoY
- ▼ -355.64%
- Current HPI
- 270.5242
- Rent YoY
- ▲ 0.70%
- Metro
- North Port-Sarasota-Bradenton, FL
- State GDP YoY
- ▲ 3.28%
- F500 in state
- 36
Industry mix (Fortune 500 HQ in FL)
| Industry | F500 HQs | Revenue |
|---|---|---|
| Industrial Technology | 2 | $29B |
|
||
| Insurance | 2 | $17B |
|
||
| Retail | 1 | $60B |
|
||
| Technology Distribution | 1 | $58B |
|
||
| Homebuilding | 1 | $35B |
|
||
| Technology Manufacturing | 1 | $35B |
|
||
Price history
+224.2% since first listed12 events — show timeline
- 2026-05-15 Pending — Stellar MLS as Distributed by MLS Grid
- 2026-04-22 Listed $299,900 Stellar MLS as Distributed by MLS Grid
- 2026-03-05 Pending — Stellar MLS as Distributed by MLS Grid
- 2026-03-04 Listing Removed — Stellar MLS as Distributed by MLS Grid
- 2026-02-12 Price Changed $325,000 Stellar MLS as Distributed by MLS Grid
- 2025-12-12 Listed $350,000 Stellar MLS as Distributed by MLS Grid
- 2019-08-14 Sold (Public Records) $241,000 Public Records
- 2008-07-22 Listing Removed — Stellar MLS as Distributed by MLS Grid
- 2007-11-30 Listed $230,000 Stellar MLS as Distributed by MLS Grid
- 2005-02-02 Sold (Public Records) $230,000 Public Records
- 2003-12-04 Sold (Public Records) $173,500 Public Records
- 1994-07-26 Sold (Public Records) $92,500 Public Records
Property tax history
+3.1%/yrLatest (2025): $3,110 · +1.9% YoY. Source: county tax records.
Cash-flow waterfall
monthlySold comps — $/sqft
last 12 mo · ≤1 miLoading sold comps…