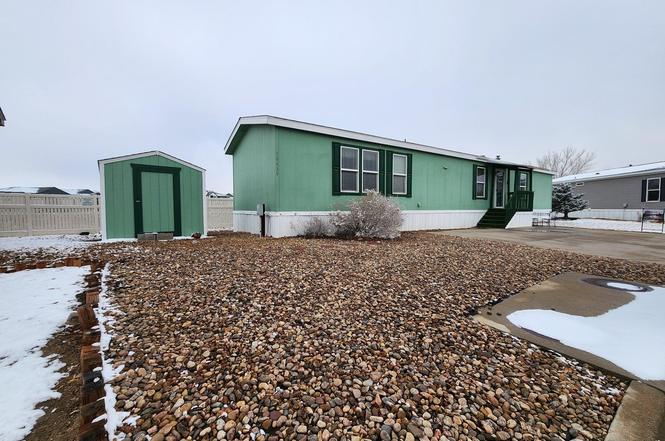
10639 Ashwood St · Firestone, CO
Flood risk No data
- FEMA flood zone
- —
- Chance of flooding over 30 yrs
- —
- Est. flood insurance / yr
- —
Fire risk No data
- Est. fire insurance / yr
- —
Heat risk No data
- Hot days now (above threshold)
- —
- Hot days in 30 yrs
- —
Wind risk No data
- Chance of severe wind over 30 yrs
- —
Air-quality risk No data
- Unhealthy air days now
- —
- Unhealthy air days in 30 yrs
- —
Risk factors via First Street. Map © Google.
Why this score? — see what drove the B+ grade
The composite is a weighted blend of 9 inputs, each scored 0–100. Each bar is that input's sub-score; the figure is the points it added to the 100-point composite (weight × sub-score).
- Cash flow +30.0/30.0
- ARV discount +15.0/15.0
- 1% rule +10.0/10.0
- DSCR +10.0/10.0
- Schools +3.8/10.0
- Livability +3.7/5.0
- Condition / age +2.5/5.0
- Rent growth +1.9/5.0
- Appreciation +0.0/10.0
$95,000
🖨 Deal sheet 📄 Offer letter ✓ Due diligence
Listing remarks MLS
Beautiful Mountain Views!!!! Backs to open space and close to walking trail. This home has been well maintained. Open floor plan, kitchen has a breakfast nook and dining area. Master bedroom has a full bathroom. ***Sellers need more space and there home is a bit packed, however they have taken really good care of the home.***
Key facts
- Outdoor pool
- Fenced area
- Clubhouse
Tags
Property features AI
Finance
- HOA & community: No association fees
Exterior
- Parking: No garage; No designated parking features listed
- Utilities: City water (meter installed); Public sewer; Natural gas available; Electricity available
- Home design: Manufactured in park (mobile home)
- Construction: Composition exterior; Fiberglass roof
- Exterior features: Land lease; Partial fencing; Storage structure; Paved lot; Gutters; Fire hydrant within 500 feet
Interior
- Kitchen: Gas range; Dishwasher; Refrigerator; Garbage disposal
- Bedrooms: 3 bedrooms
- Bathrooms: 2 full bathrooms
- Heating & cooling: Forced air heating; Central air conditioning
- Interior features: Eat-in kitchen; Cathedral ceilings; Walk-in closets
- Laundry & utility: Washer; Dryer
Neighborhood map
What this means for you Summary
Snapshot
- This is a 3-bed/2.0-bath manufactured listed at $95k.
Deal economics
- At list price, monthly cash flow is $1k ($16k/yr) — positive.
- The deal already cash-flows at list — no discount required.
- Meets the 1% rule at list price ($3k rent vs $95k).
- Recommended offer: $84k (12.0% below list) — sets the bar for market timing.
- Cap rate 23.1% vs local median 2.9% in Firestone — top-decile yield for the area; either an underpriced asset or a hidden risk that comps aren't pricing in. Stress-test before assuming the spread holds.
Location & tenants
- Location reads 73/100 on livability (#44 in CO) — a middle-class / working-renter tenant base. Strengths: employment A+, housing A+, crime A; Watch: amenities F, commute F, cost of living F.
- St. Vrain Valley School District No. Re1J (suburban): math 32% / reading 51% proficiency, ranked #23 of 86 in CO (top 27%) — families likely to look elsewhere, expect single-tenant / working-renter base with shorter leases.
- Zoned schools: Frederick Senior High School (math 21% / reading 53%, grade F, #196 of 381 statewide, top 53%, 1,412 students, 34% FRL).
- Market conditions: Rents soft (-2.3%/yr); 534 active listings in the ZIP; 5 comparable units currently listed for rent nearby; rentals at typical pace (median 21d on market — plan ~3-4 weeks tenant-placement turnaround); high-income renter base; 3,170 units permitted in Weld County in 2024 (278 in 5+ unit buildings).
Forward outlook
- Local home prices are declining (-3.0%/yr); year-one equity from $657 of loan paydown is wiped out by about $3k of value loss. Plan a longer hold.
- Weld County population projected at +46% by 2050 — long-run rental-demand tailwind backs the buy-and-hold thesis.
- At projected returns (-3.0% appreciation + 0.0% rent growth), your $27k cash investment doubles in ~2 years — after that, you're playing with house money.
Negotiation context
- It's been on market 134 days — a 12% lower offer ($84k) is reasonable based on typical stale-listing flexibility.
- 4 sale attempts since 6y ago with the ask held roughly flat each time — persistent listings suggest the price (not the market) is what's stuck; bring a comps-based counter.
- Current owner paid $65k; 46% above their basis — modest negotiation headroom, anchor on the comps not their cost.
Questions for the listing agent
- It's been on market 134 days. Have you received any prior offers? Is the seller open to a 12% concession, seller financing, or rate buy-down credit?
- Why hasn't it sold? Are there any deal-killer items the seller is aware of (foundation, flood, title, zoning, code violations)?
- Is there a deadline driving the sale (1031 exchange, divorce, estate, relocation)? That informs how much negotiation room exists.
- What's the average days-on-market for RENTAL listings here right now (not sales)? A rising rental-DOM trend means longer vacancies and softer asking-rent achievability than the comps imply.
- What's the recent tenant-quality profile in this submarket — average credit score on applications, eviction rate, late-payment / NSF rate, and stable-employment percentage? A property-management company in the area should have these aggregated.
- How much new for-sale + rental construction is in the pipeline within 1–3 miles? Heavy new supply typically softens prices + rents 12–24 months out; constrained supply supports both.
Investment metrics
- 1% rule
- 2.65% ✓
- Cap rate
- 23.08%
- Cash-on-cash
- 59.96%
- DSCR
- 3.67
- GRM
- 3.1
CMA / ARV
- ARV (on-the-fly)
- $121,440
- Comps found
- 2
Show comp detail 2 sales within ~0.75 mi
| Address | Dist | Beds/Ba | Sqft | Sold | Price | $/sf | Match |
|---|---|---|---|---|---|---|---|
| 4904 Eagle Crest Blvd | 0.32mi | 3/2.0 | 1,056 (0%) | 22mo | $85,000 | $80 | 67 |
| 10597 Bald Eagle Cir #244 | 0.23mi | 3/2.0 | 1,174 (+11%) | 5mo | $135,300 | $115 | 67 |
Match score weights: distance 35% · size 25% · config 20% · recency 20%. Top-matched comps best support the ARV.
Projected returns pro-forma
-3.0% appreciation · 0.0% rent growth · sell at horizon
- IRR
- 55.3%
- Equity multiple
- 3.33×
- Total profit
- $61,932
- Equity at exit
- $14,165
- IRR
- 59.2%
- Equity multiple
- 6.06×
- Total profit
- $134,622
- Equity at exit
- $8,214
Cash invested: $26,600 (down + closing). Projections, not guarantees.
Landlord ↔ Tenant lean methodology
- Overall (STATE)
- 38 Tenant-Leaning
- State Colorado
- 38 Tenant-Leaning · D+4
- County
- — inherits STATE
- City
- — inherits STATE
ZIP-level market 80504
- Rents YoY
- -2.3%
- Active inventory
- 534
- Price-to-rent
- 3.1×
Monthly cashflow live
- Estimated rent
- $2,514 high interval (Pro) →
- Mortgage (P&I)
- −$498
- Tax est. 1.5%
- −$119 /mo · $1,425/yr
- Insurance
- −$40
- HOA
- −$0
- Vacancy / Maint / Mgmt
- −$528
- Net cashflow
- $1,329
Break-even live
UW: 25.0% down · 7.5% · 30yr · 1.5% tax · 5.0% vac · 8.0% maint · 8.0% mgmt
Financing live
Cash to close
- Down payment
- $23,750
- Closing costs
- $2,850
- Reserves months
- —
- Total cash needed
- —
Loan-product check · same deal, 3 products live
Conventional
25% down · 7.5% · 30yr
- Down + closing
- —
- Monthly P&I
- —
- Monthly cashflow
- —
- DSCR
- —
- Eligible?
- —
Personal DTI + credit; lowest rate.
DSCR
20% down · 8.5% · 30yr
- Down + closing
- —
- Monthly P&I
- —
- Monthly cashflow
- —
- DSCR
- —
- Eligible?
- —
No personal income docs; deal must DSCR.
Hard money
10% down · 12.0% · 12mo
- Down + closing
- —
- Monthly P&I
- —
- Monthly cashflow
- —
- DSCR
- —
- Eligible?
- —
Short-term bridge; refi at stabilization.
Rent comps 5 comps
| Address | Beds | Baths | Sqft | Rent | $/sqft | DOM | Units | Dist |
|---|---|---|---|---|---|---|---|---|
| 10670 Jake Jabs Blvd Firestone, CO | 1.0–3.0 | 1.0–2.0 | 1036 | $2,595 | $2.50 | 13d | 26 | 0.13mi |
| 10910 Turner Blvd #70 Longmont, CO | 3.0 | 2.0 | 1152 | $1,999 | $1.74 | 21d | 1 | 0.77mi |
| 10692 Durango Pl Longmont, CO | 3.0 | 2.0 | 1500 | $2,395 | $1.60 | 21d | 1 | 0.93mi |
| 10426 Durango Pl Longmont, CO | 3.0 | 2.0 | 1500 | $2,350 | $1.57 | 21d | 1 | 0.96mi |
| 10767 Cimarron St Firestone, CO | 1.0–2.0 | 1.0–2.0 | 760 | $1,725 | $2.27 | 13d | 6 | 1.25mi |
Listing history 10 events
-
2026-06-18days on market $95,000 Active 134 DOM
-
2026-06-17days on market $95,000 Active 133 DOM
-
2026-06-16days on market $95,000 Active 132 DOM
-
2026-06-15days on market $95,000 Active 131 DOM
-
2026-06-14days on market $95,000 Active 129 DOM
-
2026-06-13days on market $95,000 Active 128 DOM
-
2026-06-09days on market $95,000 Active 125 DOM
-
2026-06-09days on market $95,000 Active 124 DOM
-
2026-06-07remarks 407-char remark
-
2026-06-07$95,000 Active 123 DOM
ⓘ Source: listings_history table (triggers on properties + properties_extension) + one-shot
backfill from property_details.listing_events for pre-trigger history.
Nearby sold comps map
Loading sold comps map…
Walkable amenities ~0.75 mi
Loading nearby amenities…
Taxation est. · year 1
- Rental income
- $30,162
- − Mortgage interest
- −$5,321
- − Property taxes
- −$1,425
- − Insurance
- −$475
- − Repairs & maintenance
- −$2,413
- − Management
- −$2,413
- − Depreciation
- −$2,764
- Taxable income
- $15,351
- Est. tax owed @ 24.0%
- −$3,684
- After-tax cash flow
- $12,266/yr
For passive investors: Depreciation is non-cash, so a rental often shows a tax loss while cash-flowing — sheltering income. Rental losses are passive: they offset passive income freely, and up to $25,000/yr can offset ordinary (W-2) income if you actively participate and your MAGI is under $100k (phasing out to $0 by $150k); unused losses carry forward. On sale, claimed depreciation is recaptured at up to 25%, and gains may owe capital-gains tax (a 1031 exchange can defer both). Figures are a year-1 estimate at your 24.0% rate — not tax advice; consult a CPA.
Schools (NCES district)
- District
- St. Vrain Valley School District No. Re1J
- NCES district ID
- 0805370
- Math proficiency
- 32% ▼ -8.00%
- Reading proficiency
- 51% ▬ 0.00%
- Median HH income
- $71,571
- Composite
- 37.73/100
- National rank
- #4353
- State rank
- #23 of 86 in CO
Livability — Firestone
- Score
- 73/100
- State rank
- #44
- US rank
- #5060
Category grades
Schools grade is shown separately in the Schools card above.
Census & demographics
- Census place
- Firestone, CO
- County
- Weld County · 332,652 people
- City population
- 1,684
- Metro
- Greeley, CO
- Population (ZIP)
- 63,451
- Household income
- $113,643
- Rent vs Own
- Severe rent burden
- 1028.0
Population outlook (Weld County) Hauer SSP2
- Today (2025)
- 351,957 people
- By 2030
- 385,304 · +9.5%
- By 2040
- 451,818 · +28.4%
- By 2050
- 514,478 · +46.2%
- By 2075
- 648,733 · +84.3%
- By 2100
- 720,400 · +104.7%
Race, ethnicity, and origin ACS 2023
- Neighborhood character
- Predominantly White (68%)
- Race & ethnicity
- White 68% Hispanic / Latino 24% Two or more races 13% Asian 3%
- Hispanic origin (detail)
- Mexican 18%
- Common ancestry
- Lithuanian 3% Italian 2% Iranian 2%
- Foreign-born
- 8% · Canada, Vietnam
- Languages at home
- 84% English-only · Spanish 13% Other Asian/Pacific 1%
Political lean MEDSL · Weld
- 2024 margin
- Strong R (+21.0) · D 38.2% · R 59.2% · Other 2.6%
- 2008→2024 swing
- -12.2pp toward R · 2008: -8.7pp · 2024: -21.0pp
- All cycles
- 2024: R+21.0 2020: R+18.0 2016: R+22.4 2012: R+13.2 2008: R+8.7
Not yet ingested
- Civics
- —
Market trends
- HPI YoY
- ▼ -534.45%
- Current HPI
- 245.1351
- Rent YoY
- ▼ -2.34%
- Metro
- Greeley, CO
- State GDP YoY
- ▲ 1.95%
- F500 in state
- 14
Industry mix (Fortune 500 HQ in CO)
| Industry | F500 HQs | Revenue |
|---|---|---|
| Technology Distribution | 1 | $31B |
|
||
| Food / Agriculture | 1 | $18B |
|
||
| Packaging | 1 | $14B |
|
||
| Healthcare | 1 | $13B |
|
||
| Energy | 1 | $10B |
|
||
| Technology | 1 | $4B |
|
||
Price history
+26.7% since first listed11 events — show timeline
- 2026-06-05 Relisted — IRES
- 2026-06-04 Price Changed $95,000 IRES
- 2026-05-22 Listing Removed — REColorado as Distributed by MLS Grid
- 2026-05-22 Listing Removed — IRES
- 2026-04-25 Price Changed $95,000 REColorado as Distributed by MLS Grid
- 2026-01-22 Listed $99,000 REColorado as Distributed by MLS Grid
- 2026-01-22 Listed $99,000 IRES
- 2020-09-24 Sold (MLS) $65,000 REColorado as Distributed by MLS Grid
- 2020-08-18 Pending — REColorado as Distributed by MLS Grid
- 2020-08-04 Price Changed $69,999 REColorado as Distributed by MLS Grid
- 2020-07-09 Listed $75,000 REColorado as Distributed by MLS Grid
Cash-flow waterfall
monthlySold comps — $/sqft
last 12 mo · ≤1 miLoading sold comps…