5 Garfield Dr · Cathedral City, CA
Flood risk 5/10 · Moderate
- FEMA flood zone
- X (shaded)
- Chance of flooding over 30 yrs
- 0.52%
- Est. flood insurance / yr
- $507 – $1,088
Fire risk 4/10 · Minor
- Est. fire insurance / yr
- $659 – $1,223
Heat risk 9/10 · Severe
- Hot days now (above 112°F)
- 7 days/yr
- Hot days in 30 yrs
- 21 days/yr
Wind risk 1/10 · Minimal
- Chance of severe wind over 30 yrs
- —
Air-quality risk 5/10 · Moderate
- Unhealthy air days now
- 6 days/yr
- Unhealthy air days in 30 yrs
- 8 days/yr
Risk factors via First Street. Map © Google.
Why this score? — see what drove the B+ grade
The composite is a weighted blend of 9 inputs, each scored 0–100. Each bar is that input's sub-score; the figure is the points it added to the 100-point composite (weight × sub-score).
- Cash flow +30.0/30.0
- ARV discount +15.0/15.0
- 1% rule +10.0/10.0
- DSCR +10.0/10.0
- Rent growth +3.3/5.0
- Livability +3.3/5.0
- Schools +2.7/10.0
- Condition / age +2.5/5.0
- Appreciation +0.0/10.0
$144,900
🖨 Deal sheet 📄 Offer letter ✓ Due diligence
Listing remarks MLS
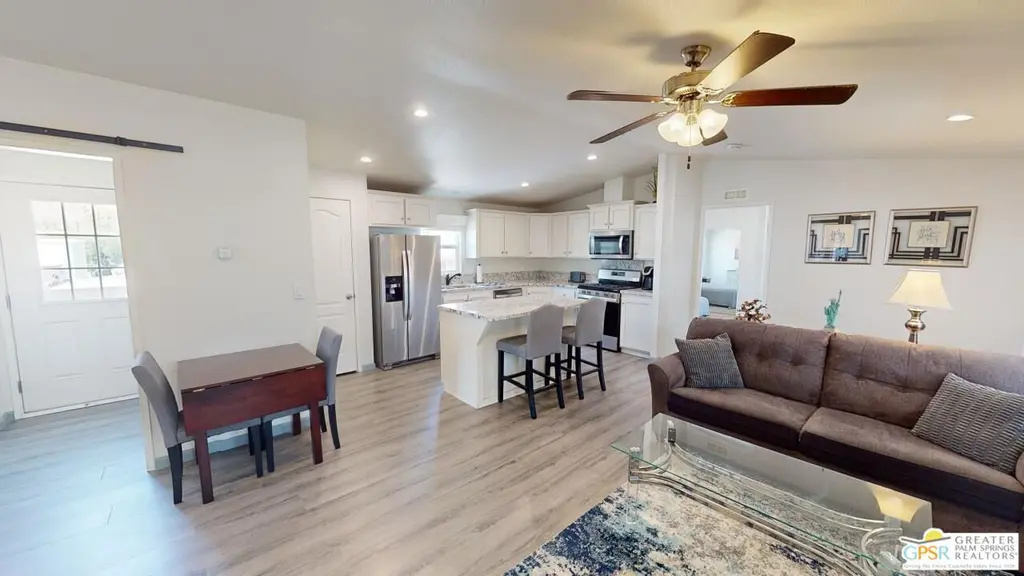
Tramview the 55+ Community! 3 Bedroom 2 Bath Double Width home which was built on 02/25/2022. This terrific home, in Tramview MHC, is situated far from the clamor of Highway 111. Beginning with the huge covered deck/terrace at the front entry and then entering this large 1120 square foot home, it is sure to please. The open concept Living, Dining and Kitchen is a perfect back drop for quiet evenings and also entertaining your family and friends. This floor plan has all of the entertaining - Living, Dining and Kitchen, in the middle of the home which gives great privacy to the primary bedroom that is located at the north end of the home, while the two other bedrooms, are located at the south end. These two bedrooms offer peek-a-boo views of the Santa Rosa Mountains. The open Kitchen with Granite Counters, Granite Island with Breakfast Bar seating, and the beautiful Stainless Steel appliance package is perfect including the side by side refrigerator, gas range and cooktop, microwave oven and dishwasher and double stainless steel sink. Although the home has Central Air-Conditioning, there are also ceiling fans throughout. The vaulted ceilings are accentuated by the new vinyl plank floors in the main living area, while the bedrooms feature updated carpeting.
Key facts
- Granite island
- Huge covered deck
- Peek-a-boo views
Tags
Neighborhood map
What this means for you Summary
Snapshot
- This is a 3-bed/2.0-bath manufactured listed at $145k.
Deal economics
- At list price, monthly cash flow is $1k ($15k/yr) — positive.
- The deal already cash-flows at list — no discount required.
- Meets the 1% rule at list price ($3k rent vs $145k).
- Recommended offer: $128k (12.0% below list) — sets the bar for market timing.
- Cap rate 16.8% vs local median 5.1% in Cathedral City — top-decile yield for the area; either an underpriced asset or a hidden risk that comps aren't pricing in. Stress-test before assuming the spread holds.
Location & tenants
- Location reads 66/100 on livability (#344 in CA) — a middle-class / working-renter tenant base. Strengths: commute A+, housing B+; Watch: employment D+, schools F, amenities D-.
- Palm Springs Unified (suburban): math 21% / reading 42% proficiency, ranked #328 of 517 in CA (top 63%) — families likely to look elsewhere, expect single-tenant / working-renter base with shorter leases; 73% free/reduced lunch — lower-income household profile, screen leases tightly.
- Market conditions: Rents rising (+3.2%/yr); 525 active listings in the ZIP; 40 comparable units currently listed for rent nearby; rentals at typical pace (median 25d on market — plan ~3-4 weeks tenant-placement turnaround); 42% of comp listings sitting > 30 days — soft ceiling on asking rent; 9,195 units permitted in Riverside County in 2024 (1,512 in 5+ unit buildings).
- At $2,772/mo this rent would consume 45% of the median local household income ($74k/yr) (locally 1682% of renters already pay >50% of income on rent) — very limited rent-growth headroom before tenants either downsize or default.
Forward outlook
- Local home prices are declining (-3.0%/yr); year-one equity from $1k of loan paydown is wiped out by about $4k of value loss. Plan a longer hold.
- Riverside County population projected at +22% by 2050 — long-run rental-demand tailwind backs the buy-and-hold thesis.
- At projected returns (-3.0% appreciation + 3.2% rent growth), your $41k cash investment doubles in ~4 years — after that, you're playing with house money.
Negotiation context
- It's been on market 469 days — a 12% lower offer ($128k) is reasonable based on typical stale-listing flexibility.
- 2 sale attempts since 2y ago with the ask held roughly flat each time — persistent listings suggest the price (not the market) is what's stuck; bring a comps-based counter.
Risks & watch-outs
- Climate carrying-cost: moderate flood risk; extreme-heat days projected 7→21/yr by 2055 (HVAC capex compounding) — expect insurance premiums to compound above CPI over the hold.
Questions for the listing agent
- It's been on market 469 days. Have you received any prior offers? Is the seller open to a 12% concession, seller financing, or rate buy-down credit?
- Why hasn't it sold? Are there any deal-killer items the seller is aware of (foundation, flood, title, zoning, code violations)?
- Is there a deadline driving the sale (1031 exchange, divorce, estate, relocation)? That informs how much negotiation room exists.
- Schools are F-rated, which usually means shorter tenancies and higher turnover. Who's the typical renter profile here, and what's been the actual vacancy rate?
- What's the average days-on-market for RENTAL listings here right now (not sales)? A rising rental-DOM trend means longer vacancies and softer asking-rent achievability than the comps imply.
- What's the recent tenant-quality profile in this submarket — average credit score on applications, eviction rate, late-payment / NSF rate, and stable-employment percentage? A property-management company in the area should have these aggregated.
- How much new for-sale + rental construction is in the pipeline within 1–3 miles? Heavy new supply typically softens prices + rents 12–24 months out; constrained supply supports both.
Investment metrics
- 1% rule
- 1.91% ✓
- Cap rate
- 16.84%
- Cash-on-cash
- 37.67%
- DSCR
- 2.68
- GRM
- 4.4
CMA / ARV
- ARV (median comp)
- $237,000
- List price
- $144,900
- Delta
- -38.86%
- Verdict
- UNDERPRICED
- Comps
- 20 within 1.0 mi
Show comp detail 12 sales within ~0.75 mi
| Address | Dist | Beds/Ba | Sqft | Sold | Price | $/sf | Match |
|---|---|---|---|---|---|---|---|
| 199 Juniper | 0.17mi | 2/2.0 (-1) | 1,080 (-4%) | 2mo | $235,000 | $218 | 79 |
| 10 Hayes St | 0.05mi | 2/2.0 (-1) | 1,021 (-9%) | 3mo | $67,200 | $66 | 75 |
| 36 Club Circle Dr | 0.18mi | 2/2.0 (-1) | 1,152 (+3%) | 9mo | $195,000 | $169 | 75 |
| 270 Encino Dr | 0.30mi | 2/2.0 (-1) | 1,120 (0%) | 8mo | $276,000 | $246 | 74 |
| 73 Calle Abajo | 0.24mi | 2/2.0 (-1) | 1,020 (-9%) | 10mo | $161,000 | $158 | 60 |
| 108 Aliso Dr | 0.11mi | 2/2.0 (-1) | 1,258 (+12%) | 12mo | $460,000 | $366 | 60 |
| 1 Buchanan St | 0.22mi | 2/2.0 (-1) | 1,213 (+8%) | 16mo | $103,000 | $85 | 58 |
| 240 Los Pinos Dr | 0.23mi | 2/2.0 (-1) | 1,248 (+11%) | 10mo | $375,000 | $300 | 56 |
| 132 Calle Arriba | 0.35mi | 2/2.0 (-1) | 1,056 (-6%) | 16mo | $200,000 | $189 | 56 |
| 3 Coolidge Dr | 0.19mi | 2/2.0 (-1) | 1,024 (-9%) | 19mo | $60,000 | $59 | 56 |
| 111 Aliso Dr | 0.14mi | 2/2.0 (-1) | 1,280 (+14%) | 17mo | $214,000 | $167 | 50 |
| 82 Calle De Espacio | 0.28mi | 2/2.0 (-1) | 1,248 (+11%) | 19mo | $125,000 | $100 | 47 |
Match score weights: distance 35% · size 25% · config 20% · recency 20%. Top-matched comps best support the ARV.
Projected returns pro-forma
-3.0% appreciation · 3.22% rent growth · sell at horizon
- IRR
- 33.9%
- Equity multiple
- 2.44×
- Total profit
- $58,241
- Equity at exit
- $21,605
- IRR
- 40.9%
- Equity multiple
- 4.89×
- Total profit
- $157,659
- Equity at exit
- $12,528
Cash invested: $40,572 (down + closing). Projections, not guarantees.
Landlord ↔ Tenant lean methodology
- Overall (STATE)
- 18 Strongly Tenant-Friendly
- State California
- 18 Strongly Tenant-Friendly · D+13
- County
- — inherits STATE
- City
- — inherits STATE
ZIP-level market 92234
- Home prices YoY
- -27.7%
- Rents YoY
- 3.2%
- Active inventory
- 525
- Price-to-rent
- 4.4×
Monthly cashflow live
- Estimated rent
- $2,772 high interval (Pro) →
- Mortgage (P&I)
- −$760
- Tax from tax record
- −$96 /mo · $1,156/yr
- Insurance
- −$60
- HOA
- −$0
- Vacancy / Maint / Mgmt
- −$582
- Net cashflow
- $1,274
Break-even live
UW: 25.0% down · 7.5% · 30yr · 1.5% tax · 5.0% vac · 8.0% maint · 8.0% mgmt
Financing live
Cash to close
- Down payment
- $36,225
- Closing costs
- $4,347
- Reserves months
- —
- Total cash needed
- —
Loan-product check · same deal, 3 products live
Conventional
25% down · 7.5% · 30yr
- Down + closing
- —
- Monthly P&I
- —
- Monthly cashflow
- —
- DSCR
- —
- Eligible?
- —
Personal DTI + credit; lowest rate.
DSCR
20% down · 8.5% · 30yr
- Down + closing
- —
- Monthly P&I
- —
- Monthly cashflow
- —
- DSCR
- —
- Eligible?
- —
No personal income docs; deal must DSCR.
Hard money
10% down · 12.0% · 12mo
- Down + closing
- —
- Monthly P&I
- —
- Monthly cashflow
- —
- DSCR
- —
- Eligible?
- —
Short-term bridge; refi at stabilization.
Rent comps 40 comps
| Address | Beds | Baths | Sqft | Rent | $/sqft | DOM | Units | Dist |
|---|---|---|---|---|---|---|---|---|
| 2800 Lawrence Crossley Rd Palm Springs, CA | 2.0 | 2.0 | 905 | $2,022 | $2.23 | 44d | 1 | 0.49mi |
| 2700 Lawrence Crossley Rd Unit B15 Palm Springs, CA | 2.0 | 2.0 | 885 | $1,950 | $2.20 | 44d | 1 | 0.51mi |
| 2700 Lawrence Crossley Rd #18 Palm Springs, CA | 2.0 | 2.0 | 885 | $2,050 | $2.32 | 18d | 1 | 0.51mi |
| 26 Pueblo Vista Dr Palm Springs, CA | 3.0 | 2.0 | 1487 | $3,200 | $2.15 | 44d | 1 | 0.53mi |
| 5301 E Waverly Dr Palm Springs, CA | 1.0–2.0 | 2.0 | 933 | $2,300 | $2.47 | 15d | 2 | 0.60mi |
| 5301 E Waverly Dr Palm Springs, CA | 1.0–2.0 | 2.0 | 933 | $2,300 | $2.47 | 18d | 2 | 0.60mi |
| 35200 Cathedral Canyon Dr Unit B10 Cathedral City, CA | 2.0 | 2.0 | 1384 | $2,600 | $1.88 | 44d | 1 | 0.67mi |
| 5300 E Waverly Dr Palm Springs, CA | 1.0–2.0 | 1.5–2.0 | 768 | $1,900 | $2.47 | 24d | 2 | 0.67mi |
| 5301 E Waverly Dr #192 Palm Springs, CA | 2.0 | 2.0 | 979 | $2,300 | $2.35 | 24d | 1 | 0.68mi |
| 2010 Lawrence Crossley Rd Unit 8 Palm Springs, CA | 2.0 | 1.5 | 993 | $1,895 | $1.91 | 14d | 1 | 0.72mi |
| 35200 Cathedral Canyon Dr Unit H64 Cathedral City, CA | 2.0 | 2.0 | 1375 | $2,500 | $1.82 | 44d | 1 | 0.73mi |
| 5300 E Waverly Dr Unit C4 Palm Springs, CA | 2.0 | 1.5 | 768 | $1,900 | $2.47 | 3d | 1 | 0.76mi |
| 68368 Calle Leon Cathedral City, CA | 2.0 | 2.0 | 1406 | $3,790 | $2.70 | 44d | 1 | 0.83mi |
| 68368 Calle Leon Cathedral City, CA | 2.0 | 2.0 | 1406 | $3,790 | $2.70 | 15d | 1 | 0.83mi |
| 34197 Calle Mora Cathedral City, CA | 2.0 | 2.0 | 1171 | $2,300 | $1.96 | 11d | 1 | 0.88mi |
| 34197 Calle Mora Cathedral City, CA | 2.0 | 2.0 | 1171 | $2,300 | $1.96 | 22d | 1 | 0.88mi |
| 34197 Calle Mora Cathedral City, CA | 2.0 | 2.0 | 1171 | $2,300 | $1.96 | 13d | 1 | 0.88mi |
| 68615 Paseo Soria Cathedral City, CA | 2.0 | 2.0 | 1462 | $3,500 | $2.39 | 8d | 1 | 0.92mi |
| 68153 Lakeland Dr Cathedral City, CA | 2.0 | 2.0 | 1255 | $2,500 | $1.99 | 24d | 1 | 0.95mi |
| 2601 S Broadmoor Dr Palm Springs, CA | 2.0 | 2.0 | 1178 | $2,050 | $1.74 | 44d | 2 | 0.98mi |
| 68859 Paseo Real Cathedral City, CA | 2.0 | 2.0 | 1406 | $3,960 | $2.82 | 44d | 1 | 0.99mi |
| 68859 Paseo Real Cathedral City, CA | 2.0 | 2.0 | 1406 | $3,960 | $2.82 | 15d | 1 | 0.99mi |
| 33892 Sky Blue Water Trl Cathedral City, CA | 3.0 | 2.0 | 1352 | $2,800 | $2.07 | 4d | 1 | 1.00mi |
| 6071 Hazeltine Plz Palm Springs, CA | 2.0 | 2.0 | 1168 | $3,200 | $2.74 | 44d | 1 | 1.03mi |
| 2441 S Birdie Way Unit E Palm Springs, CA | 2.0 | 2.0 | 1438 | $3,250 | $2.26 | 24d | 1 | 1.05mi |
| 4850 N Winners Cir Unit A Palm Springs, CA | 2.0 | 2.0 | 1275 | $2,700 | $2.12 | 17d | 1 | 1.13mi |
| 2104 S Birdie Way Palm Springs, CA | 3.0 | 2.0 | 1456 | $3,600 | $2.47 | 44d | 1 | 1.14mi |
| 2550 Miramonte Cir E Unit C Palm Springs, CA | 3.0 | 2.5 | 1397 | $2,730 | $1.95 | 24d | 1 | 1.17mi |
| 152 Estrada Way #152 Cathedral City, CA | 2.0 | 2.0 | 1500 | $2,200 | $1.47 | 44d | 1 | 1.17mi |
| 33387 Shifting Sands Trl Unit 2 Cathedral City, CA | 2.0 | 2.0 | 1300 | $1,999 | $1.54 | 24d | 1 | 1.19mi |
| 2350 Miramonte Cir E Unit E Palm Springs, CA | 2.0 | 2.0 | 1241 | $4,500 | $3.63 | 44d | 1 | 1.21mi |
| 2350 Miramonte Cir E Unit A Palm Springs, CA | 2.0 | 2.0 | 1264 | $3,000 | $2.37 | 24d | 1 | 1.21mi |
| 68177 Mountain View Rd Cathedral City, CA | 2.0 | 2.0 | 1394 | $2,895 | $2.08 | 44d | 1 | 1.21mi |
| 68695 F St Cathedral City, CA | 3.0 | 2.5 | 896 | $2,500 | $2.79 | 44d | 1 | 1.22mi |
| 33495 Cathedral Canyon Dr Cathedral City, CA | 2.0 | 1.0 | 1100 | $2,200 | $2.00 | 44d | 1 | 1.25mi |
| 33495 Cathedral Canyon Dr Unit B Cathedral City, CA | 2.0 | 1.0 | 1100 | $2,100 | $1.91 | 44d | 1 | 1.25mi |
| 2391 Mira Monte Cir W Palm Springs, CA | 2.0 | 2.0 | 1180 | $2,850 | $2.42 | 44d | 1 | 1.30mi |
| 69200 Nilda Dr Cathedral City, CA | 3.0 | 2.0 | 1330 | $2,495 | $1.88 | 22d | 1 | 1.32mi |
| 34750 Marcia Rd Unit 02 Cathedral City, CA | 3.0 | 2.0 | 1325 | $2,000 | $1.51 | 18d | 1 | 1.37mi |
| 33030 Shifting Sands Trl Apt 4 Cathedral City, CA | 2.0 | 1.0 | 821 | $1,599 | $1.95 | 24d | 1 | 1.37mi |
Listing history 18 events
-
2026-06-18days on market $144,900 Active 469 DOM
-
2026-06-17days on market $144,900 Active 468 DOM
-
2026-06-16days on market $144,900 Active 467 DOM
-
2026-06-15days on market $144,900 Active 466 DOM
-
2026-06-13days on market $144,900 Active 464 DOM
-
2026-06-13days on market $144,900 Active 463 DOM
-
2026-06-09days on market $144,900 Active 460 DOM
-
2026-06-08days on market $144,900 Active 459 DOM
-
2026-06-07days on market $144,900 Active 458 DOM
-
2026-06-04days on market $144,900 Active 455 DOM
-
2026-06-03days on market $144,900 Active 454 DOM
-
2026-06-02days on market $144,900 Active 453 DOM
-
2026-06-01days on market $144,900 Active 452 DOM
-
2026-05-31days on market $144,900 Active 451 DOM
-
2025-06-01price $144,900 1274-char remark
Show marketing remark (1274 chars)
Tramview the 55+ Community! 3 Bedroom 2 Bath Double Width home which was built on 02/25/2022. This terrific home, in Tramview MHC, is situated far from the clamor of Highway 111. Beginning with the huge covered deck/terrace at the front entry and then entering this large 1120 square foot home, it is sure to please. The open concept Living, Dining and Kitchen is a perfect back drop for quiet evenings and also entertaining your family and friends. This floor plan has all of the entertaining - Living, Dining and Kitchen, in the middle of the home which gives great privacy to the primary bedroom that is located at the north end of the home, while the two other bedrooms, are located at the south end. These two bedrooms offer peek-a-boo views of the Santa Rosa Mountains. The open Kitchen with Granite Counters, Granite Island with Breakfast Bar seating, and the beautiful Stainless Steel appliance package is perfect including the side by side refrigerator, gas range and cooktop, microwave oven and dishwasher and double stainless steel sink. Although the home has Central Air-Conditioning, there are also ceiling fans throughout. The vaulted ceilings are accentuated by the new vinyl plank floors in the main living area, while the bedrooms feature updated carpeting.
-
2025-03-06$149,900 Active 1274-char remark
Show marketing remark (1274 chars)
Tramview the 55+ Community! 3 Bedroom 2 Bath Double Width home which was built on 02/25/2022. This terrific home, in Tramview MHC, is situated far from the clamor of Highway 111. Beginning with the huge covered deck/terrace at the front entry and then entering this large 1120 square foot home, it is sure to please. The open concept Living, Dining and Kitchen is a perfect back drop for quiet evenings and also entertaining your family and friends. This floor plan has all of the entertaining - Living, Dining and Kitchen, in the middle of the home which gives great privacy to the primary bedroom that is located at the north end of the home, while the two other bedrooms, are located at the south end. These two bedrooms offer peek-a-boo views of the Santa Rosa Mountains. The open Kitchen with Granite Counters, Granite Island with Breakfast Bar seating, and the beautiful Stainless Steel appliance package is perfect including the side by side refrigerator, gas range and cooktop, microwave oven and dishwasher and double stainless steel sink. Although the home has Central Air-Conditioning, there are also ceiling fans throughout. The vaulted ceilings are accentuated by the new vinyl plank floors in the main living area, while the bedrooms feature updated carpeting.
-
2024-12-31price
-
2024-06-05Active
ⓘ Source: listings_history table (triggers on properties + properties_extension) + one-shot
backfill from property_details.listing_events for pre-trigger history.
Tax reassessment forecast CA · Resets to sale price
- Current annual tax
- $1,156 · $96/mo
- Projected year-2 tax
- $1,156 · $96/mo
- Expected delta
- $0/yr ($0/mo · 0.0%)
ⓘ Screening estimate from a state-policy table — verify with the county assessor before closing.
Climate risk First Street
- Flood 5/10 Major FEMA zone X (shaded) · 52% chance over 30 yrs
- Wildfire 4/10 Moderate
- Heat 9/10 Extreme 7 d/yr ≥112°F today · 21 d/yr by 30 yrs out
- Wind 1/10 Low
- Air quality 5/10 Major 6 unhealthy d/yr today · 8 by 30 yrs out
Nearby sold comps map
Loading sold comps map…
Walkable amenities ~0.75 mi
Loading nearby amenities…
Taxation est. · year 1
- Rental income
- $33,269
- − Mortgage interest
- −$8,117
- − Property taxes
- −$1,156
- − Insurance
- −$724
- − Repairs & maintenance
- −$2,661
- − Management
- −$2,661
- − Depreciation
- −$4,215
- Taxable income
- $13,733
- Est. tax owed @ 24.0%
- −$3,296
- After-tax cash flow
- $11,987/yr
For passive investors: Depreciation is non-cash, so a rental often shows a tax loss while cash-flowing — sheltering income. Rental losses are passive: they offset passive income freely, and up to $25,000/yr can offset ordinary (W-2) income if you actively participate and your MAGI is under $100k (phasing out to $0 by $150k); unused losses carry forward. On sale, claimed depreciation is recaptured at up to 25%, and gains may owe capital-gains tax (a 1031 exchange can defer both). Figures are a year-1 estimate at your 24.0% rate — not tax advice; consult a CPA.
Schools (NCES district)
- District
- Palm Springs Unified
- NCES district ID
- 0629550
- Math proficiency
- 21% ▼ -7.00%
- Reading proficiency
- 42% ▬ 0.00%
- Median HH income
- $43,638
- Composite
- 26.76/100
- National rank
- #7131
- State rank
- #328 of 517 in CA
Livability — Cathedral City
- Score
- 66/100
- State rank
- #344
- US rank
- #11749
Category grades
Schools grade is shown separately in the Schools card above.
Census & demographics
- Census place
- Cathedral City, CA
- County
- Riverside County · 2,287,001 people
- City population
- 52,267
- Metro
- Riverside-San Bernardino-Ontario, CA
- Population (ZIP)
- 52,267
- Household income
- $73,572
- Rent vs Own
- Severe rent burden
- 1682.0
Population outlook (Riverside County) Hauer SSP2
- Today (2025)
- 2,664,475 people
- By 2030
- 2,802,692 · +5.2%
- By 2040
- 3,050,904 · +14.5%
- By 2050
- 3,256,783 · +22.2%
- By 2075
- 3,655,058 · +37.2%
- By 2100
- 3,766,594 · +41.4%
Race, ethnicity, and origin ACS 2023
- Neighborhood character
- Diverse neighborhood (Simpson 0.56)
- Race & ethnicity
- Hispanic / Latino 59% White 30% Two or more races 27% Asian 6% Native American 2% Black 2%
- Hispanic origin (detail)
- Mexican 51%
- Common ancestry
- Lithuanian 2% Romanian 1% Italian 1%
- Foreign-born
- 28% · Canada, Vietnam
- Languages at home
- 48% English-only · Spanish 46% Tagalog/Filipino 3% Other Asian/Pacific 1%
Political lean MEDSL · Riverside
- 2024 margin
- Toss-up / Even · D 48.0% · R 49.3% · Other 2.6%
- 2008→2024 swing
- -3.6pp toward R · 2008: 2.3pp · 2024: -1.3pp
- All cycles
- 2024: R+1.3 2020: D+8.0 2016: D+4.3 2012: R+0.4 2008: D+2.3
Not yet ingested
- Civics
- —
Market trends
- HPI YoY
- ▼ -136.57%
- Current HPI
- 356.9845
- Rent YoY
- ▲ 3.22%
- Metro
- Riverside-San Bernardino-Ontario, CA
- State GDP YoY
- ▲ 3.21%
- F500 in state
- 116
Industry mix (Fortune 500 HQ in CA)
| Industry | F500 HQs | Revenue |
|---|---|---|
| Technology | 27 | $1,492B |
|
||
| Financial Services | 3 | $174B |
|
||
| Retail | 3 | $44B |
|
||
| Insurance | 3 | $26B |
|
||
| Media / Entertainment | 2 | $115B |
|
||
| Pharmaceuticals / Biotech | 2 | $62B |
|
||
Price history
-3.3% since first listed4 events — show timeline
- 2025-06-01 Price Changed $144,900 TheMLS
- 2025-03-06 Listed $149,900 TheMLS
- 2024-12-31 Price Changed — TheMLS
- 2024-06-05 Listed — TheMLS
Property tax history
-1.7%/yrLatest (2025): $1,156 · -2.1% YoY. Source: county tax records.
Cash-flow waterfall
monthlySold comps — $/sqft
last 12 mo · ≤1 miLoading sold comps…