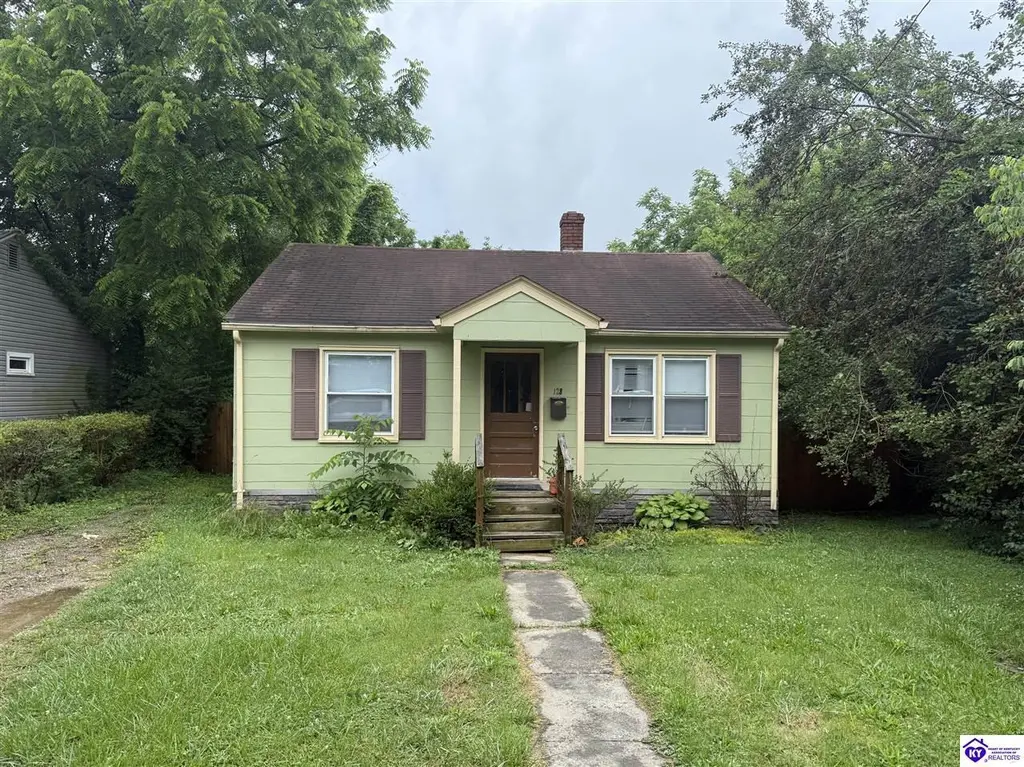
128 James St · Elizabethtown, KY
Flood risk 1/10 · Minimal
- FEMA flood zone
- X (unshaded)
- Chance of flooding over 30 yrs
- 0.0%
- Est. flood insurance / yr
- $507 – $1,088
Fire risk 3/10 · Minor
- Est. fire insurance / yr
- $839 – $1,559
Heat risk 5/10 · Moderate
- Hot days now (above 104°F)
- 7 days/yr
- Hot days in 30 yrs
- 19 days/yr
Wind risk 2/10 · Minimal
- Chance of severe wind over 30 yrs
- 2.0%
Air-quality risk 1/10 · Minimal
- Unhealthy air days now
- 0 days/yr
- Unhealthy air days in 30 yrs
- 0 days/yr
Risk factors via First Street. Map © Google.
Why this score? — see what drove the B- grade
The composite is a weighted blend of 9 inputs, each scored 0–100. Each bar is that input's sub-score; the figure is the points it added to the 100-point composite (weight × sub-score).
- Cash flow +26.5/30.0
- ARV discount +15.0/15.0
- DSCR +9.0/10.0
- 1% rule +6.4/10.0
- Livability +3.6/5.0
- Rent growth +3.3/5.0
- Schools +2.9/10.0
- Condition / age +2.5/5.0
- Appreciation +0.0/10.0
$110,000
🖨 Deal sheet (PDF) 📄 Offer letter ✓ Due diligence
Listing remarks
2 Bedroom cottage home with a enclosed rear porch is in an excellent location directly across from Etown High School. House has good bones and a lot of potential for an investor, flipper or fixer upper. Home is livable but needs some work. Since it will not currently go FHA, VA or USDA financing seller prefers a cash or conventional offer as property is being sold AS IS.
Key facts
- Enclosed rear porch
- Excellent location
- 4,792 sq ft lot
Tags
Property features AI
Exterior
- Security: Smoke detector(s)
- Utilities: Public water; Public sewer
- Home design: Single-family residence; Residential property
- Construction: Asbestos exterior material; Shingle roof
- Exterior features: Porch; Shed(s)
Interior
- Kitchen: Dishwasher; Microwave; Gas Range
- Flooring: Hardwood; Tile
- Bathrooms: 1 full bathroom (main level)
- Heating & cooling: Forced air heating (natural gas); Ceiling fan(s)
- Interior features: Dishwasher; Microwave; Gas Range; Gas Water Heater; Hardwood floors; Tile floors; Ceiling fan(s); Smoke detector(s)
- Laundry & utility: Dedicated laundry room
Neighborhood map
What this means for you Summary
Snapshot
- This is a 2-bed/1.0-bath single-family listed at $110k.
Deal economics
- At list price, monthly cash flow is $291 ($3k/yr) — positive.
- The deal already cash-flows at list — no discount required.
- Meets the 1% rule at list price ($1k rent vs $110k).
- Cap rate 9.5% vs local median 3.4% in Elizabethtown — top-decile yield for the area; either an underpriced asset or a hidden risk that comps aren't pricing in. Stress-test before assuming the spread holds.
Location & tenants
- Location reads 72/100 on livability (#131 in KY) — a middle-class / working-renter tenant base. Strengths: crime A+, cost of living A+, housing A; Watch: employment D, amenities F, commute F.
- Elizabethtown Independent (urban): math 26% / reading 45% proficiency, ranked #66 of 165 in KY (top 40%) — families likely to look elsewhere, expect single-tenant / working-renter base with shorter leases.
- Zoned schools: Morningside Elementary School (math 21% / reading 38%, grade F, #393 of 676 statewide, top 63%, 452 students, 50% FRL); Talton K Stone Middle School (math 26% / reading 51%, grade F, #68 of 217 statewide, top 32%, 545 students, 42% FRL); Elizabethtown High School (math 35% / reading 45%, grade F, #39 of 254 statewide, top 15%, 824 students, 36% FRL) — zoned schools at 43% FRL track the district average.
- Market conditions: Rents rising (+3.3%/yr); 548 active listings in the ZIP; 2 comparable units currently listed for rent nearby; 946 units permitted in Hardin County in 2024 (464 in 5+ unit buildings).
Forward outlook
- Local home prices are declining (-3.0%/yr); year-one equity from $761 of loan paydown is wiped out by about $3k of value loss. Plan a longer hold.
- Hardin County population projected at -16% by 2050 — secular population decline; favor cash flow + early exit over multi-decade hold.
- At projected returns (-3.0% appreciation + 3.3% rent growth), your $31k cash investment doubles in ~10 years — after that, you're playing with house money.
Negotiation context
- Only 3 days on market — expect competitive offers; lowballing is unlikely to land.
Risks & watch-outs
- Watch-outs: built in 1951 — expect roof / HVAC / electrical / plumbing capex.
- Climate carrying-cost: extreme-heat days projected 7→19/yr by 2055 (HVAC capex compounding) — expect insurance premiums to compound above CPI over the hold.
Questions for the listing agent
- Built in 1951 — when were the roof, HVAC, electrical panel, plumbing, and water heater last replaced?
- Is there a deadline driving the sale (1031 exchange, divorce, estate, relocation)? That informs how much negotiation room exists.
- What's the average days-on-market for RENTAL listings here right now (not sales)? A rising rental-DOM trend means longer vacancies and softer asking-rent achievability than the comps imply.
- What's the recent tenant-quality profile in this submarket — average credit score on applications, eviction rate, late-payment / NSF rate, and stable-employment percentage? A property-management company in the area should have these aggregated.
- How much new for-sale + rental construction is in the pipeline within 1–3 miles? Heavy new supply typically softens prices + rents 12–24 months out; constrained supply supports both.
Investment metrics
- 1% rule
- 1.14% ✓
- Cap rate
- 9.47%
- Cash-on-cash
- 11.33%
- DSCR
- 1.50
- GRM
- 7.3
CMA / ARV
- ARV (on-the-fly)
- $173,264
- Comps found
- 12
Show comp detail 12 sales within ~0.75 mi
| Address | Dist | Beds/Ba | Sqft | Sold | Price | $/sf | Match |
|---|---|---|---|---|---|---|---|
| 128 James St | 0.00mi | 2/1.0 | 952 (0%) | 0mo | $101,000 | $106 | 100 |
| 517 Henry St | 0.28mi | 3/1.0 (+1) | 1,000 (+5%) | 2mo | $189,000 | $189 | 72 |
| 626 N Miles St | 0.35mi | 3/1.0 (+1) | 1,000 (+5%) | 8mo | $182,600 | $183 | 64 |
| 211 Hardin St | 0.24mi | 3/1.0 (+1) | 1,025 (+8%) | 9mo | $152,500 | $149 | 63 |
| 109 Vertrees Ct | 0.49mi | 2/1.0 | 1,040 (+9%) | 3mo | $95,000 | $91 | 59 |
| 305 E Poplar St | 0.55mi | 2/1.0 | 936 (-2%) | 17mo | $164,900 | $176 | 57 |
| 312 Jefferson St | 0.47mi | 3/1.0 (+1) | 939 (-1%) | 20mo | $180,500 | $192 | 54 |
| 1110 N Main St | 0.70mi | 2/2.0 | 1,000 (+5%) | 7mo | $270,000 | $270 | 49 |
| 221 Mantle Ave | 0.73mi | 2/1.0 | 832 (-13%) | 2mo | $185,500 | $223 | 44 |
| 308 Central Ave | 0.39mi | 3/1.0 (+1) | 1,084 (+14%) | 15mo | $190,000 | $175 | 41 |
| 211 Haycraft St | 0.56mi | 2/1.0 | 840 (-12%) | 17mo | $153,000 | $182 | 40 |
| 312 Sunny St | 0.71mi | 3/1.0 (+1) | 1,008 (+6%) | 15mo | $164,300 | $163 | 39 |
Match score weights: distance 35% · size 25% · config 20% · recency 20%. Top-matched comps best support the ARV.
Projected returns pro-forma
-3.0% appreciation · 3.32% rent growth · sell at horizon
- IRR
- 0.9%
- Equity multiple
- 1.04×
- Total profit
- $1,089
- Equity at exit
- $16,401
- IRR
- 10.8%
- Equity multiple
- 1.86×
- Total profit
- $26,406
- Equity at exit
- $9,511
Cash invested: $30,800 (down + closing). Projections, not guarantees.
Landlord ↔ Tenant lean methodology
- Overall (STATE)
- 83 Strongly Landlord-Friendly
- State Kentucky
- 83 Strongly Landlord-Friendly · R+16
- County
- — inherits STATE
- City
- — inherits STATE
ZIP-level market 42701
- Home prices YoY
- -29.8%
- Rents YoY
- 3.3%
- Active inventory
- 548
- Price-to-rent
- 7.3×
Monthly cashflow live
- Estimated rent
- $1,256 medium interval (Pro) →
- Mortgage (P&I)
- −$577
- Tax from tax record
- −$78 /mo · $940/yr
- Insurance
- −$46
- HOA
- −$0
- Vacancy / Maint / Mgmt
- −$264
- Net cashflow
- $291
Break-even live
Sensitivity live
| Price | -10% $353 | -5% $322 | +0% $291 | +5% $260 | +10% $229 |
|---|---|---|---|---|---|
| Rent | -10% $192 | -5% $241 | +0% $291 | +5% $340 | +10% $390 |
| Rate | -1.0pp $346 | -0.5pp $319 | base $291 | +0.5pp $262 | +1.0pp $233 |
UW: 25.0% down · 7.5% · 30yr · 1.5% tax · 5.0% vac · 8.0% maint · 8.0% mgmt
Financing live
Cash to close
- Down payment
- $27,500
- Closing costs
- $3,300
- Reserves months
- —
- Total cash needed
- —
Loan-product check · same deal, 3 products live
Conventional
25% down · 7.5% · 30yr
- Down + closing
- —
- Monthly P&I
- —
- Monthly cashflow
- —
- DSCR
- —
- Eligible?
- —
Personal DTI + credit; lowest rate.
DSCR
20% down · 8.5% · 30yr
- Down + closing
- —
- Monthly P&I
- —
- Monthly cashflow
- —
- DSCR
- —
- Eligible?
- —
No personal income docs; deal must DSCR.
Hard money
10% down · 12.0% · 12mo
- Down + closing
- —
- Monthly P&I
- —
- Monthly cashflow
- —
- DSCR
- —
- Eligible?
- —
Short-term bridge; refi at stabilization.
Rent comps 2 comps
| Address | Beds | Baths | Sqft | Rent | $/sqft | DOM | Units | Dist |
|---|---|---|---|---|---|---|---|---|
| 900 David Ct Elizabethtown, KY | 1.0–2.0 | 1.0–1.5 | 780 | $985 | $1.26 | 45d | 15 | 0.91mi |
| 206 Cole Gray Blvd Elizabethtown, KY | 2.0–3.0 | 1.5–2.5 | 1730 | $1,399 | $0.81 | 5d | 1 | 0.93mi |
Listing history 1 events
-
2026-05-27$110,000 Active
ⓘ Source: listings_history table (triggers on properties + properties_extension) + one-shot
backfill from property_details.listing_events for pre-trigger history.
Tax reassessment forecast KY · Resets to sale price
- Current annual tax
- $940 · $78/mo
- Projected year-2 tax
- $946 · $79/mo
- Expected delta
- +$6/yr ($0/mo · 0.6%)
ⓘ Screening estimate from a state-policy table — verify with the county assessor before closing.
Climate risk First Street
- Flood 1/10 Low FEMA zone X (unshaded) · 0% chance over 30 yrs
- Wildfire 3/10 Moderate
- Heat 5/10 Major 7 d/yr ≥104°F today · 19 d/yr by 30 yrs out
- Wind 2/10 Low 2% chance of damaging wind over 30 yrs
- Air quality 1/10 Low 0 unhealthy d/yr today · 0 by 30 yrs out
Nearby sold comps map
Loading sold comps map…
Walkable amenities ~0.75 mi
Loading nearby amenities…
Taxation est. · year 1
- Rental income
- $15,067
- − Mortgage interest
- −$6,162
- − Property taxes
- −$940
- − Insurance
- −$550
- − Repairs & maintenance
- −$1,205
- − Management
- −$1,205
- − Depreciation
- −$3,200
- Taxable income
- $1,804
- Est. tax owed @ 24.0%
- −$433
- After-tax cash flow
- $3,057/yr
For passive investors: Depreciation is non-cash, so a rental often shows a tax loss while cash-flowing — sheltering income. Rental losses are passive: they offset passive income freely, and up to $25,000/yr can offset ordinary (W-2) income if you actively participate and your MAGI is under $100k (phasing out to $0 by $150k); unused losses carry forward. On sale, claimed depreciation is recaptured at up to 25%, and gains may owe capital-gains tax (a 1031 exchange can defer both). Figures are a year-1 estimate at your 24.0% rate — not tax advice; consult a CPA.
Schools (NCES district)
- District
- Elizabethtown Independent
- NCES district ID
- 2101650
- Math proficiency
- 26% ▼ -25.00%
- Reading proficiency
- 45% ▼ -17.00%
- Median HH income
- $36,400
- Composite
- 29.39/100
- National rank
- #6526
- State rank
- #66 of 165 in KY
Livability — Elizabethtown
- Score
- 72/100
- State rank
- #131
- US rank
- #6198
Category grades
Schools grade is shown separately in the Schools card above.
Census & demographics
- Census place
- Elizabethtown, KY
- County
- Hardin County · 77,611 people
- City population
- 53,987
- Metro
- Elizabethtown-Fort Knox, KY
- Population (ZIP)
- 53,987
- Household income
- $69,619
- Rent vs Own
- Severe rent burden
- 1663.0
Population outlook (Hardin County) Hauer SSP2
- Today (2025)
- 105,573 people
- By 2030
- 103,563 · -1.9%
- By 2040
- 97,077 · -8.0%
- By 2050
- 88,367 · -16.3%
- By 2075
- 65,405 · -38.0%
- By 2100
- 42,245 · -60.0%
Race, ethnicity, and origin ACS 2023
- Neighborhood character
- Predominantly White (79%)
- Race & ethnicity
- White 79% Black 9% Two or more races 6% Hispanic / Latino 5% Asian 2%
- Hispanic origin (detail)
- Mexican 3% Puerto Rican 1%
- Common ancestry
- Italian 3% Slovak 2% Romanian 2%
- Foreign-born
- 4% · Canada, South Korea
- Languages at home
- 94% English-only · Spanish 3% German/W. Germanic 1% Other Indo-European 1%
Political lean MEDSL · Hardin
- 2024 margin
- Strong R (+29.3) · D 34.5% · R 63.8% · Other 1.7%
- 2008→2024 swing
- -8.7pp toward R · 2008: -20.6pp · 2024: -29.3pp
- All cycles
- 2024: R+29.3 2020: R+24.0 2016: R+30.2 2012: R+20.8 2008: R+20.6
Not yet ingested
- Civics
- —
Market trends
- HPI YoY
- ▼ -96.94%
- Current HPI
- 228.7091
- Rent YoY
- ▲ 3.32%
- Metro
- Elizabethtown-Fort Knox, KY
- State GDP YoY
- ▲ 1.81%
- F500 in state
- 4
Industry mix (Fortune 500 HQ in KY)
| Industry | F500 HQs | Revenue |
|---|---|---|
| Healthcare | 1 | $118B |
|
||
| Food / Beverage | 1 | $7B |
|
||
Price history
1 event — show timeline
- 2026-05-27 Listed $110,000 HKARMLS
Property tax history
+5.5%/yrLatest (2025): $940 · +1.9% YoY. Source: county tax records.
Cash-flow waterfall
monthlySold comps — $/sqft
last 12 mo · ≤1 miLoading sold comps…