6604 Walburn #341 · Portage, MI
Flood risk No data
- FEMA flood zone
- —
- Chance of flooding over 30 yrs
- —
- Est. flood insurance / yr
- —
Fire risk No data
- Est. fire insurance / yr
- —
Heat risk No data
- Hot days now (above threshold)
- —
- Hot days in 30 yrs
- —
Wind risk No data
- Chance of severe wind over 30 yrs
- —
Air-quality risk No data
- Unhealthy air days now
- —
- Unhealthy air days in 30 yrs
- —
Risk factors via First Street. Map © Google.
Why this score? — see what drove the B grade
The composite is a weighted blend of 9 inputs, each scored 0–100. Each bar is that input's sub-score; the figure is the points it added to the 100-point composite (weight × sub-score).
- Cash flow +30.0/30.0
- 1% rule +10.0/10.0
- DSCR +10.0/10.0
- ARV discount +7.5/15.0
- Rent growth +4.5/5.0
- Livability +4.0/5.0
- Condition / age +4.0/5.0
- Schools +2.1/10.0
- Appreciation +0.0/10.0
$68,199
🖨 Deal sheet 📄 Offer letter ✓ Due diligence
Listing remarks MLS
New construction, 3 bed, 2 bath home with A/c and Shed
Key facts
- Full kitchen
- Picnic areas
- Built 2025
Tags
Neighborhood map
What this means for you Summary
Snapshot
- This is a 3-bed/2.0-bath manufactured listed at $68k. Condition is rated good.
Deal economics
- At list price, monthly cash flow is $714 ($9k/yr) — positive.
- The deal already cash-flows at list — no discount required.
- Meets the 1% rule at list price ($2k rent vs $68k).
- Recommended offer: $66k (3.0% below list) — sets the bar for market timing.
- Cap rate 18.9% vs local median 3.3% in Portage — top-decile yield for the area; either an underpriced asset or a hidden risk that comps aren't pricing in. Stress-test before assuming the spread holds.
Location & tenants
- Location reads 79/100 on livability (#90 in MI, #2,044 nationally) — a middle-class / working-renter tenant base. Strengths: cost of living A+, housing A+, health & safety A+; Watch: crime D+, amenities D-, commute F.
- Comstock Public Schools (suburban): math 18% / reading 32% proficiency, ranked #428 of 540 in MI (top 79%) — low school quality limits family demand, transient renter base, plan for 1-2y turnover; 65% free/reduced lunch — lower-income household profile, screen leases tightly.
- Market conditions: Rents rising fast (+7.9%/yr); 154 active listings in the ZIP; 2 comparable units currently listed for rent nearby; 339 units permitted in Kalamazoo County in 2024 (22 in 5+ unit buildings).
Forward outlook
- Local home prices are declining (-3.0%/yr); year-one equity from $471 of loan paydown is wiped out by about $2k of value loss. Plan a longer hold.
- Kalamazoo County population projected at +18% by 2050 — long-run rental-demand tailwind backs the buy-and-hold thesis.
- At projected returns (-3.0% appreciation + 7.9% rent growth), your $19k cash investment doubles in ~3 years — after that, you're playing with house money.
Negotiation context
- It's been on market 54 days — a 3% lower offer ($66k) is reasonable based on typical stale-listing flexibility.
- 3 sale attempts; this cycle's ask has dropped $18k (21%) from the opening price — seller is motivated, your offer sets the floor, not the list.
Questions for the listing agent
- It's been on market 54 days. Have you received any prior offers? Is the seller open to a 3% concession, seller financing, or rate buy-down credit?
- Is there a deadline driving the sale (1031 exchange, divorce, estate, relocation)? That informs how much negotiation room exists.
- Schools are A-rated — typically a magnet for longer-tenancy family renters. What's the average tenant stay here, and is there a school-zone premium baked into asking?
- Crime grade is D in this area — have there been break-ins, vandalism, or insurance claims at this property in the last 3 years? What carrier currently insures it and at what premium?
- What's the average days-on-market for RENTAL listings here right now (not sales)? A rising rental-DOM trend means longer vacancies and softer asking-rent achievability than the comps imply.
- What's the recent tenant-quality profile in this submarket — average credit score on applications, eviction rate, late-payment / NSF rate, and stable-employment percentage? A property-management company in the area should have these aggregated.
- How much new for-sale + rental construction is in the pipeline within 1–3 miles? Heavy new supply typically softens prices + rents 12–24 months out; constrained supply supports both.
Investment metrics
- 1% rule
- 2.20% ✓
- Cap rate
- 18.85%
- Cash-on-cash
- 44.85%
- DSCR
- 3.00
- GRM
- 3.8
CMA / ARV
No comps found within radius.
Projected returns pro-forma
-3.0% appreciation · 7.88% rent growth · sell at horizon
- IRR
- 47.4%
- Equity multiple
- 3.21×
- Total profit
- $42,160
- Equity at exit
- $10,169
- IRR
- 55.1%
- Equity multiple
- 7.83×
- Total profit
- $130,427
- Equity at exit
- $5,897
Cash invested: $19,096 (down + closing). Projections, not guarantees.
Landlord ↔ Tenant lean methodology
- Overall (STATE)
- 62 Landlord-Friendly
- State Michigan
- 62 Landlord-Friendly · EVEN
- County
- — inherits STATE
- City
- — inherits STATE
ZIP-level market 49048
- Rents YoY
- 7.9%
- Active inventory
- 154
- Price-to-rent
- 3.8×
Monthly cashflow live
- Estimated rent
- $1,500 medium interval (Pro) →
- Mortgage (P&I)
- −$358
- Tax est. 1.5%
- −$85 /mo · $1,023/yr
- Insurance
- −$28
- HOA
- −$0
- Vacancy / Maint / Mgmt
- −$315
- Net cashflow
- $714
Break-even live
UW: 25.0% down · 7.5% · 30yr · 1.5% tax · 5.0% vac · 8.0% maint · 8.0% mgmt
Financing live
Cash to close
- Down payment
- $17,050
- Closing costs
- $2,046
- Reserves months
- —
- Total cash needed
- —
Loan-product check · same deal, 3 products live
Conventional
25% down · 7.5% · 30yr
- Down + closing
- —
- Monthly P&I
- —
- Monthly cashflow
- —
- DSCR
- —
- Eligible?
- —
Personal DTI + credit; lowest rate.
DSCR
20% down · 8.5% · 30yr
- Down + closing
- —
- Monthly P&I
- —
- Monthly cashflow
- —
- DSCR
- —
- Eligible?
- —
No personal income docs; deal must DSCR.
Hard money
10% down · 12.0% · 12mo
- Down + closing
- —
- Monthly P&I
- —
- Monthly cashflow
- —
- DSCR
- —
- Eligible?
- —
Short-term bridge; refi at stabilization.
Rent comps 2 comps
| Address | Beds | Baths | Sqft | Rent | $/sqft | DOM | Units | Dist |
|---|---|---|---|---|---|---|---|---|
| 6830 E N Ave Kalamazoo, MI | 3.0–4.0 | 2.0 | 1246 | $1,179 | $0.95 | 13d | 1 | 0.16mi |
| 5141 S Wagon Trl Kalamazoo, MI | 3.0 | 1.0–2.0 | 1055 | $2,050 | $1.94 | 44d | 16 | 1.44mi |
Listing history 17 events
-
2026-06-10days on market $68,199 Active 54 DOM
-
2026-06-09days on market $68,199 Active 53 DOM
-
2026-06-08days on market $68,199 Active 52 DOM
-
2026-06-07remarks 51-char remark
-
2026-06-07days on market $68,199 Active 51 DOM
-
2026-06-05days on market $68,199 Active 48 DOM
-
2026-06-03days on market $68,199 Active 47 DOM
-
2026-06-02days on market $68,199 Active 46 DOM
-
2026-06-01days on market $68,199 Active 45 DOM
-
2026-05-31days on market $68,199 Active 44 DOM
-
2026-05-30days on market $68,199 Active 43 DOM
-
2026-05-13status Active 54-char remark
Show marketing remark (54 chars)
New construction, 3 bed, 2 bath home with A/c and Shed
-
2026-05-13price $68,199 54-char remark
Show marketing remark (54 chars)
New construction, 3 bed, 2 bath home with A/c and Shed
-
2025-10-23historical 54-char remark
Show marketing remark (54 chars)
New construction, 3 bed, 2 bath home with A/c and Shed
-
2025-10-03status Active 54-char remark
Show marketing remark (54 chars)
New construction, 3 bed, 2 bath home with A/c and Shed
-
2025-03-06historical 54-char remark
Show marketing remark (54 chars)
New construction, 3 bed, 2 bath home with A/c and Shed
-
2025-02-28$85,900 Active 54-char remark
Show marketing remark (54 chars)
New construction, 3 bed, 2 bath home with A/c and Shed
ⓘ Source: listings_history table (triggers on properties + properties_extension) + one-shot
backfill from property_details.listing_events for pre-trigger history.
Nearby sold comps map
Loading sold comps map…
Walkable amenities ~0.75 mi
Loading nearby amenities…
Taxation est. · year 1
- Rental income
- $18,001
- − Mortgage interest
- −$3,820
- − Property taxes
- −$1,023
- − Insurance
- −$341
- − Repairs & maintenance
- −$1,440
- − Management
- −$1,440
- − Depreciation
- −$1,984
- Taxable income
- $7,953
- Est. tax owed @ 24.0%
- −$1,909
- After-tax cash flow
- $6,657/yr
For passive investors: Depreciation is non-cash, so a rental often shows a tax loss while cash-flowing — sheltering income. Rental losses are passive: they offset passive income freely, and up to $25,000/yr can offset ordinary (W-2) income if you actively participate and your MAGI is under $100k (phasing out to $0 by $150k); unused losses carry forward. On sale, claimed depreciation is recaptured at up to 25%, and gains may owe capital-gains tax (a 1031 exchange can defer both). Figures are a year-1 estimate at your 24.0% rate — not tax advice; consult a CPA.
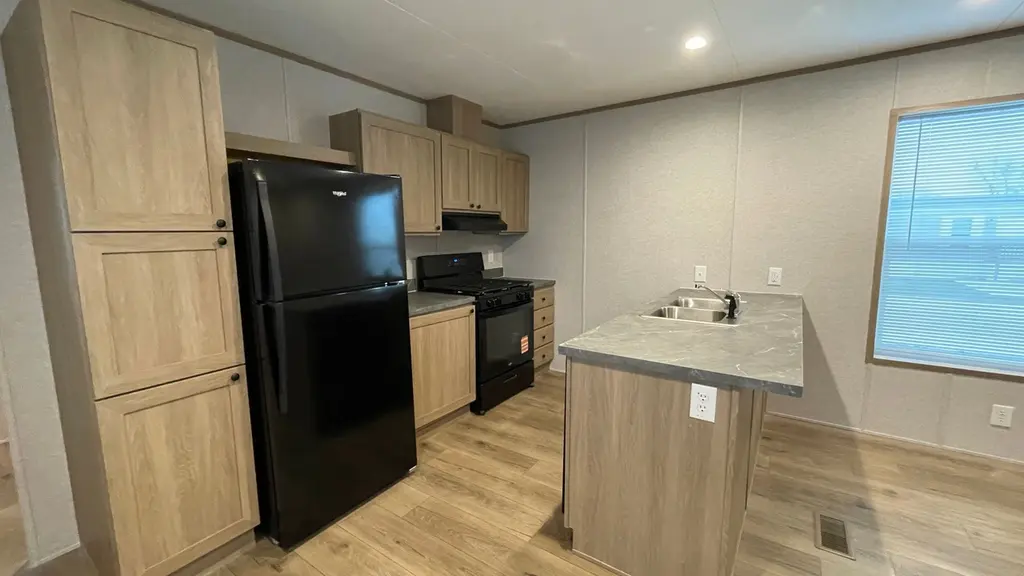
Condition & rehab AI · 2 photos
This move-in ready manufactured home is in good condition with a modern kitchen and neutral interior. It has potential for further enhancing its value through minor updates and improvements.
Value-add opportunities
- Both Painting interior walls — Fresh paint can enhance curb appeal and interior aesthetics.
- Both Landscaping and curb appeal improvements — Enhances the home's curb appeal and can attract more potential buyers or renters.
- Rental Add a small outdoor seating area — Can increase rental value by providing a more appealing living space for tenants.
- Both Install smart home features — Can increase both resale and rental value by adding modern conveniences and energy efficiency features.
Renovation cost estimate screening
Value-add ROI direction
- Both Painting interior walls — Fresh paint can enhance curb appeal and interior aesthetics. ↑
- Both Landscaping and curb appeal improvements — Enhances the home's curb appeal and can attract more potential buyers or renters. ↑
- Rental Add a small outdoor seating area — Can increase rental value by providing a more appealing living space for tenants. ↑
- Both Install smart home features — Can increase both resale and rental value by adding modern conveniences and energy efficiency features. ↑
ⓘ Cost ranges are severity-bucket heuristics (US national rule-of-thumb). Get contractor quotes + a written scope before underwriting a rehab budget.
Schools (NCES district)
- District
- Comstock Public Schools
- NCES district ID
- 2610590
- Math proficiency
- 18% ▼ -2.00%
- Reading proficiency
- 32% ▼ -1.00%
- Median HH income
- $41,293
- Composite
- 21.17/100
- National rank
- #8423
- State rank
- #428 of 540 in MI
Livability — Portage
- Score
- 79/100
- State rank
- #90
- US rank
- #2044
Category grades
Schools grade is shown separately in the Schools card above.
Census & demographics
- County
- Kalamazoo County · 224,317 people
- City population
- 50,560
- Metro
- Kalamazoo-Portage, MI
- Population (ZIP)
- 22,791
- Household income
- $60,454
- Rent vs Own
- Severe rent burden
- 835.0
Population outlook (Kalamazoo County) Hauer SSP2
- Today (2025)
- 280,982 people
- By 2030
- 292,068 · +3.9%
- By 2040
- 312,191 · +11.1%
- By 2050
- 331,196 · +17.9%
- By 2075
- 379,021 · +34.9%
- By 2100
- 396,579 · +41.1%
Race, ethnicity, and origin ACS 2023
- Neighborhood character
- Predominantly White (67%)
- Race & ethnicity
- White 67% Black 20% Hispanic / Latino 7% Two or more races 7% Asian 2%
- Hispanic origin (detail)
- Mexican 4%
- Common ancestry
- Iranian 6% Romanian 4% Lithuanian 2%
- Foreign-born
- 4% · Canada
- Languages at home
- 94% English-only · Spanish 3% Other Indo-European 1%
Political lean MEDSL · Kalamazoo
- 2024 margin
- D (+17.7) · D 58.0% · R 40.3% · Other 1.7%
- 2008→2024 swing
- -1.8pp toward R · 2008: 19.5pp · 2024: 17.7pp
- All cycles
- 2024: D+17.7 2020: D+18.7 2016: D+12.8 2012: D+13.3 2008: D+19.5
Not yet ingested
- Civics
- —
Market trends
- HPI YoY
- ▼ -205.26%
- Current HPI
- 180.4766
- Rent YoY
- ▲ 7.88%
- Metro
- Kalamazoo-Portage, MI
- State GDP YoY
- ▲ 1.37%
- F500 in state
- 28
Industry mix (Fortune 500 HQ in MI)
| Industry | F500 HQs | Revenue |
|---|---|---|
| Automotive Parts | 3 | $48B |
|
||
| Automotive | 2 | $372B |
|
||
| Chemicals | 1 | $45B |
|
||
| Automotive Retail | 1 | $29B |
|
||
| Healthcare / Medical Devices | 1 | $23B |
|
||
| Automotive Technology | 1 | $20B |
|
||
Price history
-20.6% since first listed6 events — show timeline
- 2026-05-13 Relisted — Zillow
- 2026-05-13 Price Changed $68,199 Zillow
- 2025-10-23 Delisted — Zillow
- 2025-10-03 Relisted — Zillow
- 2025-03-06 Delisted — Zillow
- 2025-02-28 Listed $85,900 Zillow
Cash-flow waterfall
monthlySold comps — $/sqft
last 12 mo · ≤1 miLoading sold comps…